App session replay: What you need to know
Understanding how users interact with your app is the key to building better experiences, reducing churn, and increasing conversions.
But not all tools track user behavior the same way.
From session replays and in-app feedback to event-based analytics and heatmaps, each tool uses different methods for different goals.
In this article, we’ll walk you through seven powerful platforms, what they do best, and how you can use them to get a fuller picture of user behavior.
Table of Contents
Let’s start with our own solution, Shake.
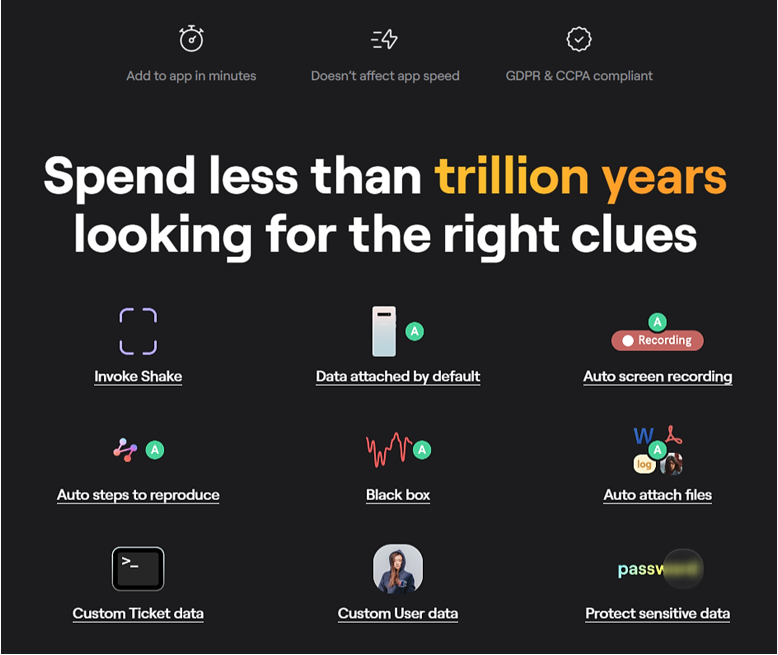
It’s a lightweight tool that can be added to your web or mobile app in minutes, and it won’t affect app speed.
Once installed, Shake tracks how users interact with your app during those inevitable moments when something goes wrong, like a bug or a crash.
When a crash occurs or a user encounters a bug and wants to report it, Shake automatically:
In short, developers get all the contextual data they need to debug smarter and faster.
Here are Shake’s key features:
By capturing the full context behind every crash or bug in real time, Shake bridges the gap between bug reporting and user behavior insight.
This makes it much easier to understand how users experience your app and where exactly things go wrong.
Take automatic screen recording, for example.
Session replays alone show what users did before an issue, but not why the issue occurred.
However, when paired with Shake’s reports—which capture background processes at the time when the issue appeared—screen recordings become a powerful tool for context-rich debugging.
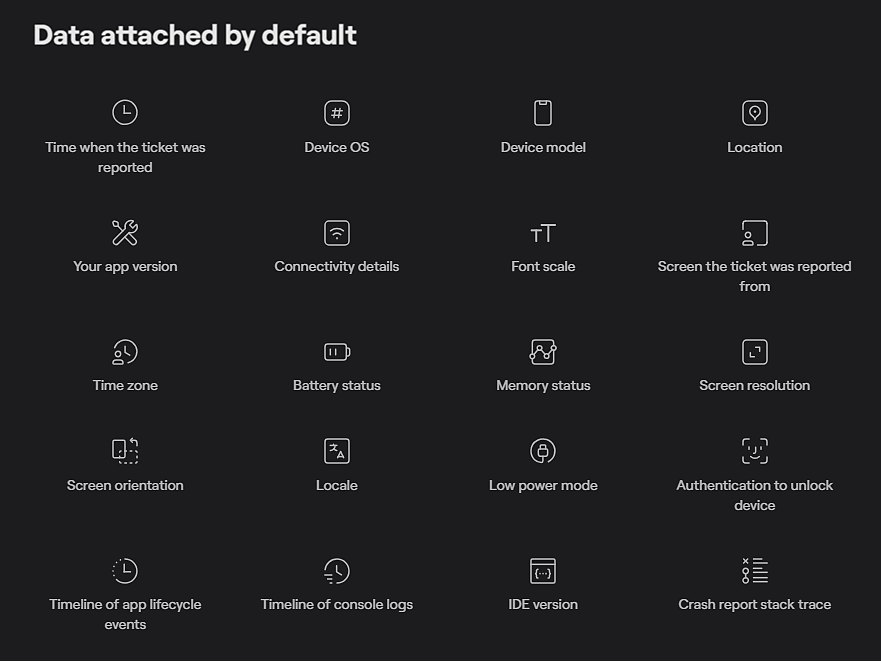
That context, alongside the session replay, comes from the rich data Shake automatically attaches to each report:
Shake is free forever for web apps and also includes a Chrome extension, making it easy to get started without any cost.
When it comes to mobile apps, there’s a free tier offering unlimited users and crash reports, though bug reports are limited to 20 per month.
For teams needing more capacity, Shake’s Premium plan ($160/month) and Organization plan ($340/month) also unlock unlimited bug reports, as shown below.
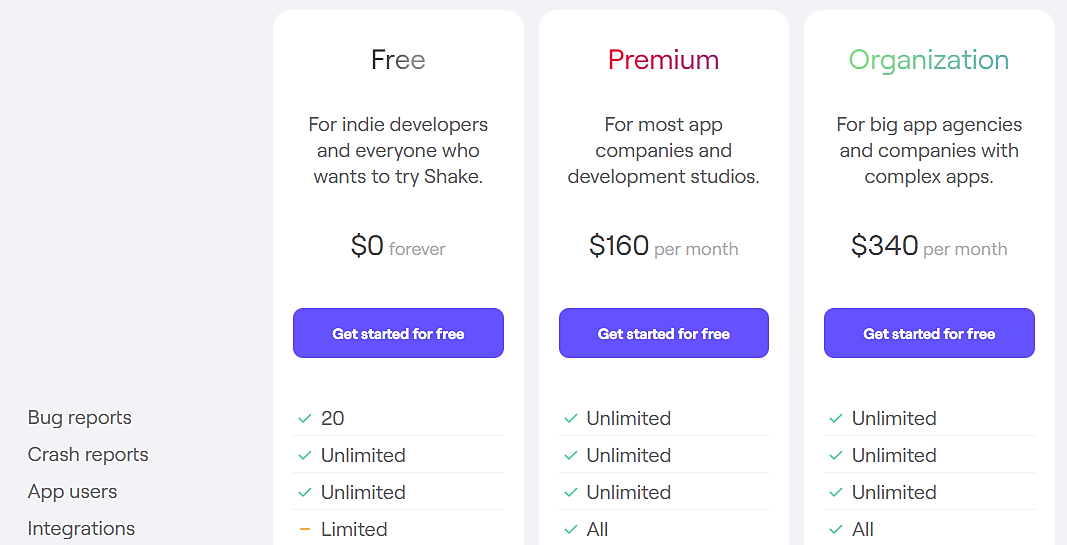
Shake also offers early-stage startup discounts, with the Premium plan available at $15 per month during the first year.
While Shake excels as an automated bug and crash reporting tool with robust in-app feedback features, it is not a full behavioral analytics platform.

Get unreal data to fix real issues in your app & web.
Its core strength lies in delivering precise, actionable debugging data, rather than comprehensive user behavior optimization.
That said, Shake integrates seamlessly with other dedicated analytics tools—such as Fullstory—enhancing the deeper product insights and behavioral analysis they provide.
In summary, Shake is a lightweight, effective solution for capturing crucial user interaction data during app issues, speeding up bug resolution while complementing broader analytics platforms.
Heap offers automatic, comprehensive event tracking without manual tagging, capturing all user interactions in your mobile and web apps.
In practice, once you install Heap’s tracking code or SDK, it automatically records user interactions without requiring you to manually define or tag each event in advance.
This includes capturing events such as page views, clicks, form submissions, text input changes, and session starts by default.
This automated, continuous capture of raw event data allows dev teams to retroactively label and analyze these events at any time, even for interactions not initially planned to be tracked.
Heap also enriches these auto-captured events with additional contextual data—called properties—such as user identifiers, session details, device information, and event metadata.
These properties provide deeper insights into user behavior without extra coding.
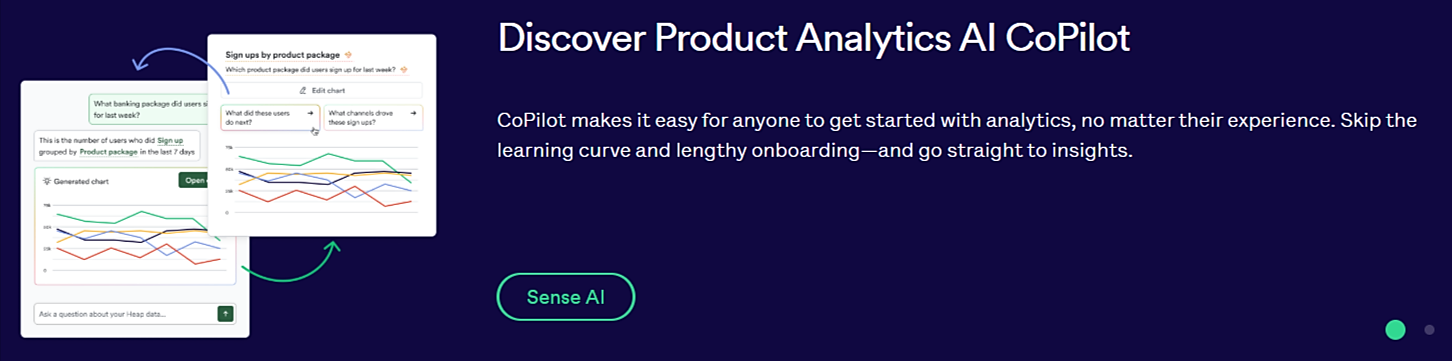
Heap also offers an Analytics AI CoPilot, a virtual assistant that enables anyone to dive deep into analytics regardless of their experience.
In addition to event tracking and AI-supported behavioral analytics, Heap also provides tracking features like heatmaps and session replay.
However, these capabilities are add-ons, meaning they’re charged extra.
On that note, here are Heap’s pricing plans, including a free tier, but with no specific prices listed:
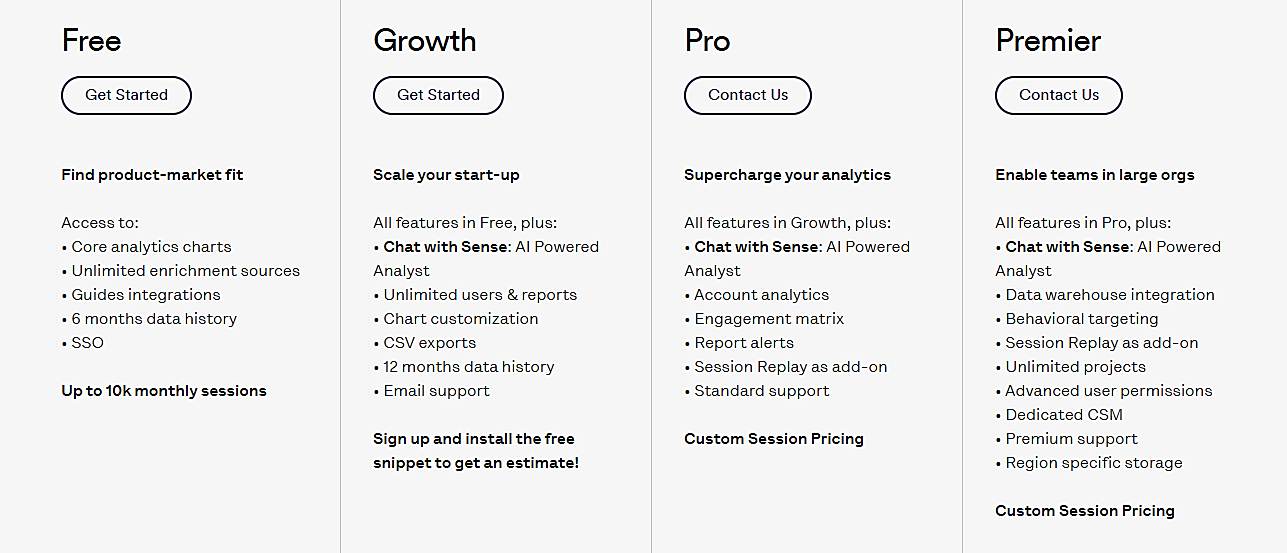
In other words, you’ll need to sign up for a free trial or contact Heap to find out the price.
Another potential Heap’s downside is too much unfiltered data, as one Reddit user explains:
“Too much data is a headache, you get this paralysis by analysis effect, and it messes up your decision-making ability. Spend time to just track the event you want, it might take a little bit more time, but (you’ll) thank me later.”
Ultimately, Heap is a powerful option for teams that want to track everything upfront and make sense of it later—just be prepared to manage the volume of data it delivers.
Userpilot tracks user behavior to deliver insights that, when combined with its onboarding and in-app engagement tools, help teams increase product adoption, retention, and conversions in both web and mobile apps.
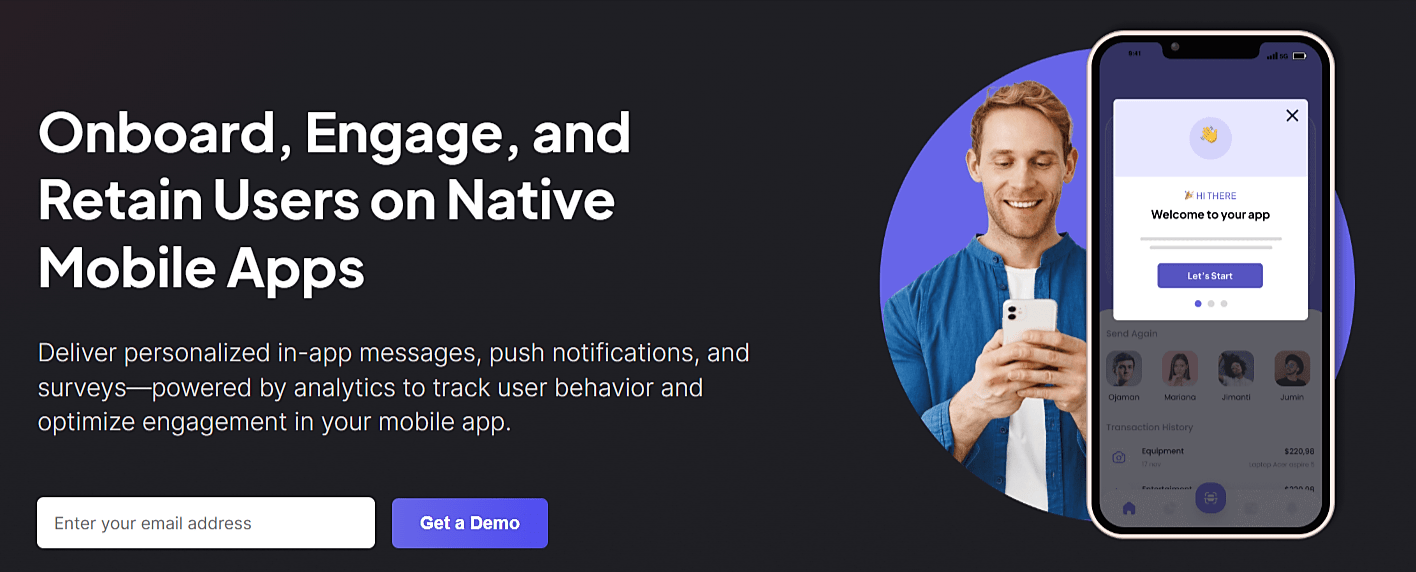
As shown above, Userpilot does capture user events and interactions.
However, its primary strength lies in guiding users inside the app and boosting engagement using behavior-driven insights.
When it comes to behavior tracking, Userpilot combines event tracking, session replay, and in-app surveys, but the last two are only available in higher pricing tiers.
Importantly, teams can tag features and events they want to track without writing a single line of code.
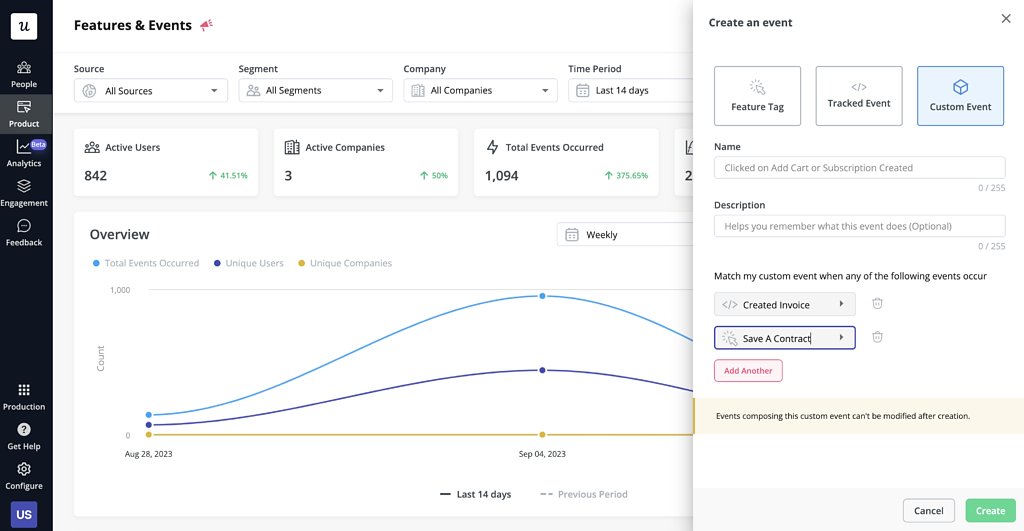
This feature allows teams to select interaction types and on-screen elements they find the most relevant for their goals.
After some data is collected, they can leverage Userpilot’s analytics to generate detailed user behavior reports.
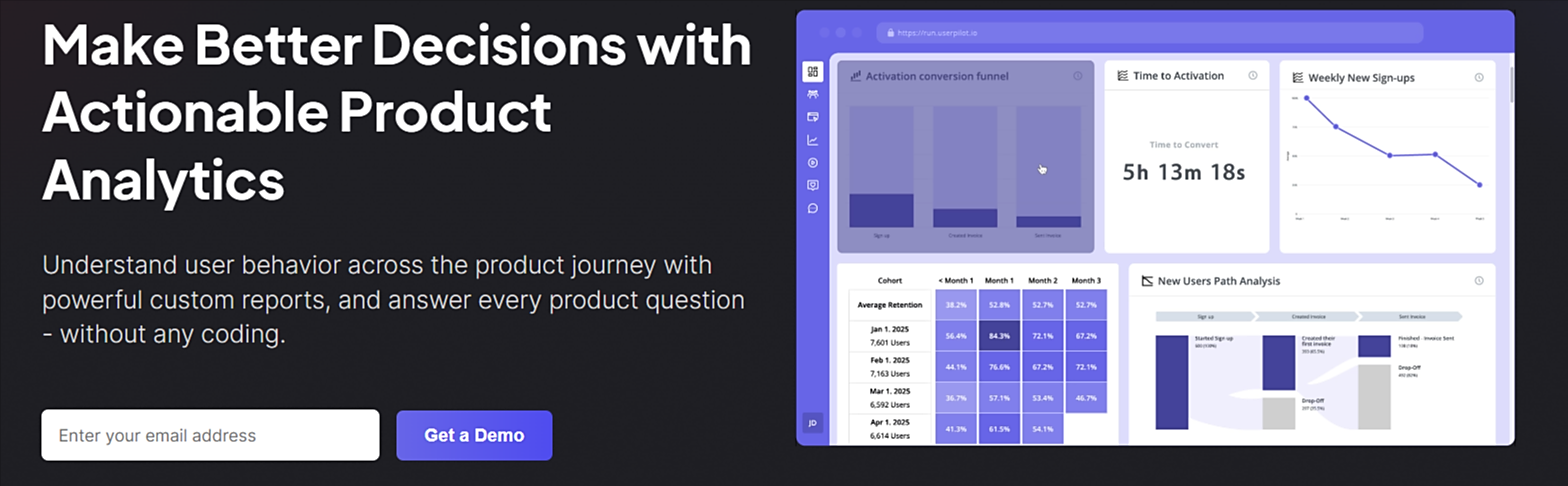
Userpilot’s analytics dashboard combines both quantitative and qualitative data, allowing teams to segment users based on their behavior.
These insights can then be used alongside other Userpilot features, such as triggering in-app messages or specific actions in response to user behavior.
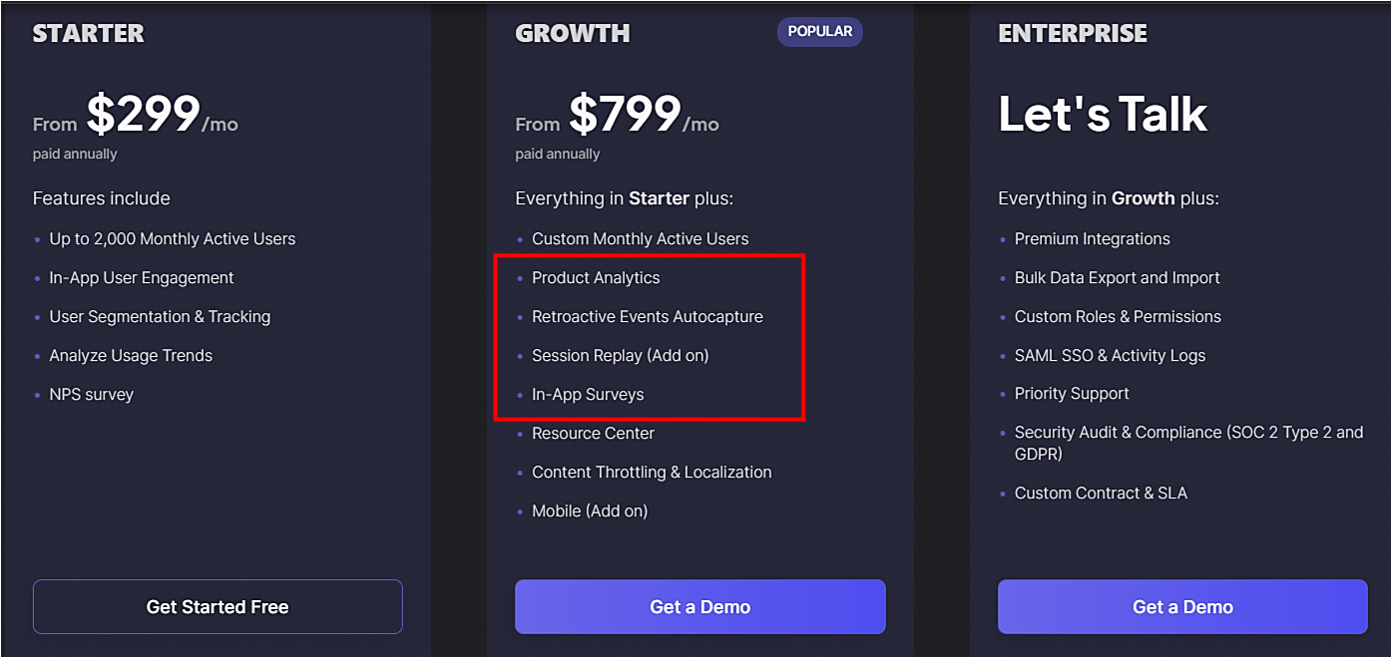
As for pricing, it’s on the higher side compared to some other tools, particularly since product analytics, session replays, and in-app surveys are only included in the higher-tier plans.
While Userpilot generally receives excellent reviews, some users note that its user segmentation and targeting features can be complex, and linking certain features together isn’t always intuitive.
Overall, Userpilot is a powerful choice for teams focused on product adoption and in-app engagement, offering strong analytics and behavior-based targeting capabilities.
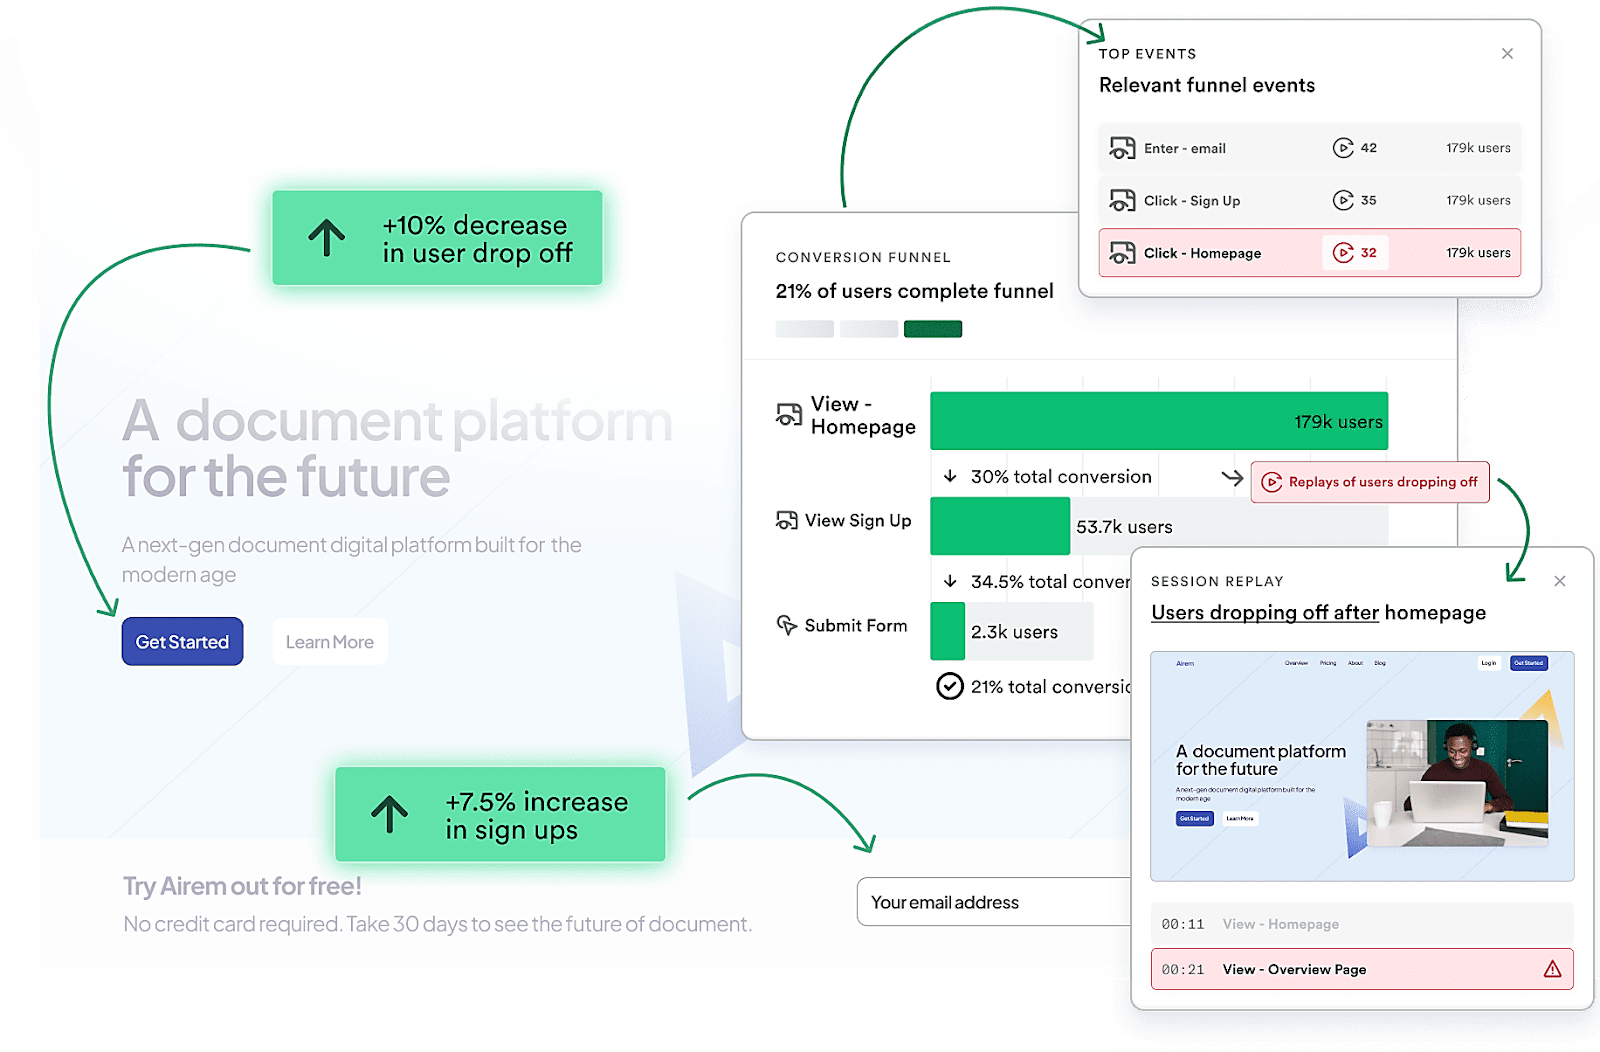
Mixpanel is a leading platform for tracking app user behavior through event-based analytics and session replays.
It captures detailed user actions in real time and helps teams uncover trends through powerful funnel and cohort analyses.
Funnel analysis reveals where users drop off during multi-step processes, while cohort analysis groups users by shared behaviors over time.
Together, these capabilities—product analytics and granular session replays—let you move seamlessly from the big picture to individual user experiences in seconds.
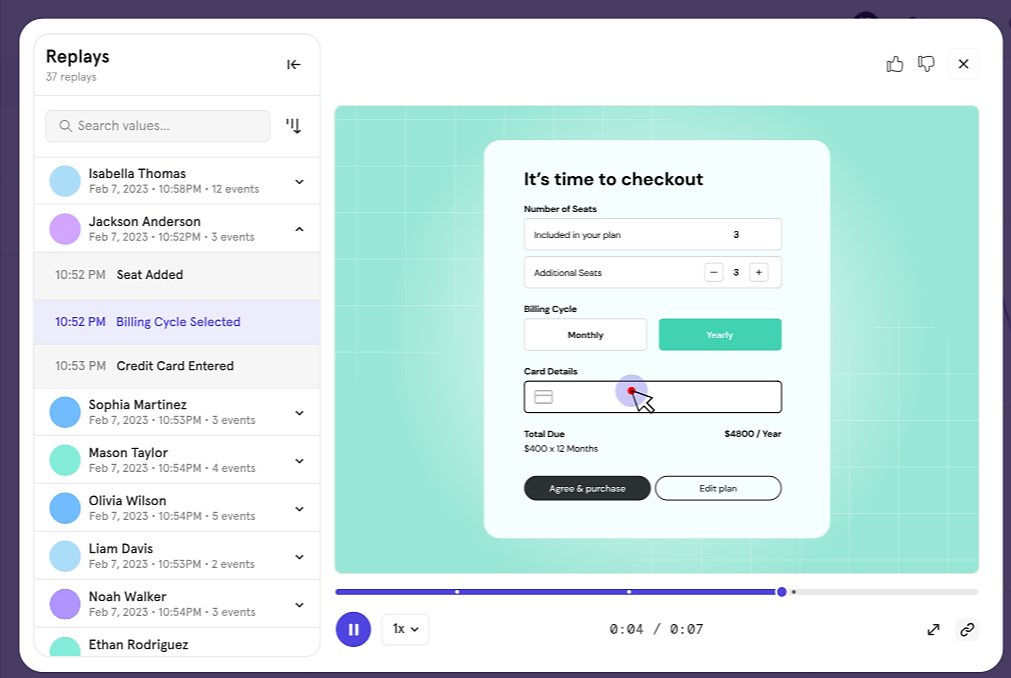
Teams can easily link backend events with session replays to add valuable context to user behavior.
By combining high-level analytics with precise interaction data in a single platform, they can better understand pain points, spot patterns, and make more informed decisions.
Beyond these two core features, Mixpanel also offers:
As for pricing, Mixpanel doesn’t list exact amounts but does offer a free tier.
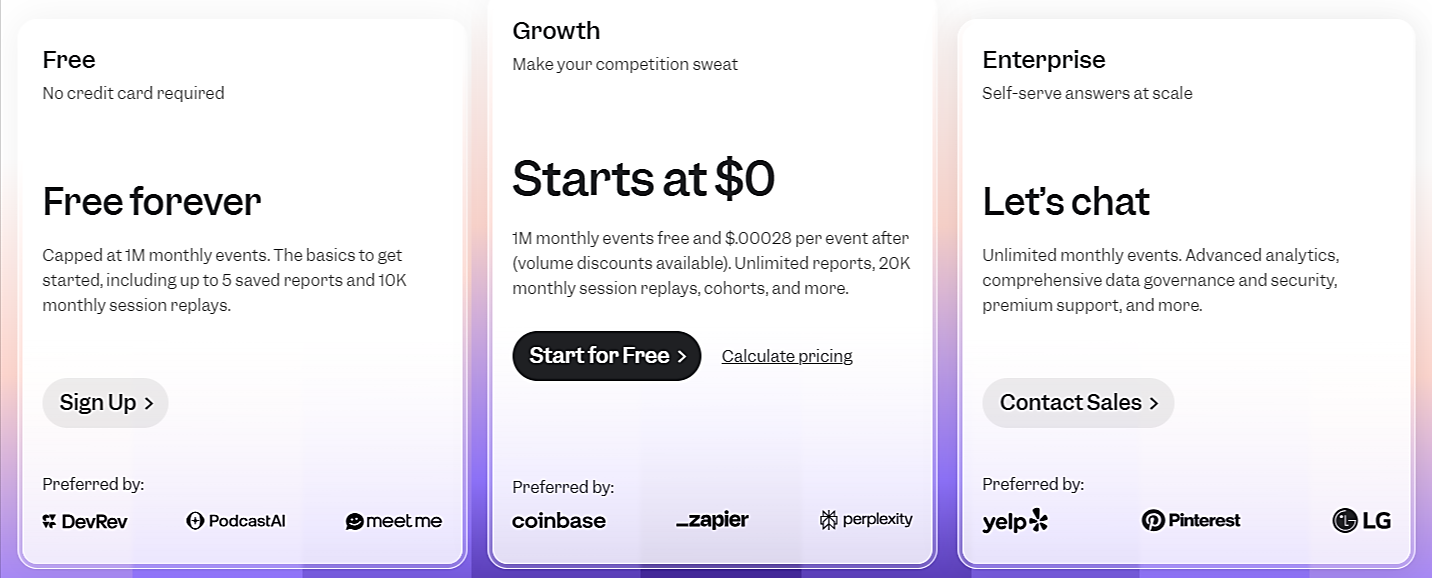
Mixpanel consistently receives strong reviews, though some users have noted limitations in dashboard customization and concerns about displayed data accuracy.
Nevertheless, Mixpanel remains a well-established and user-friendly analytics platform ideal for teams seeking both high-level insights and detailed user behavior tracking in one place.
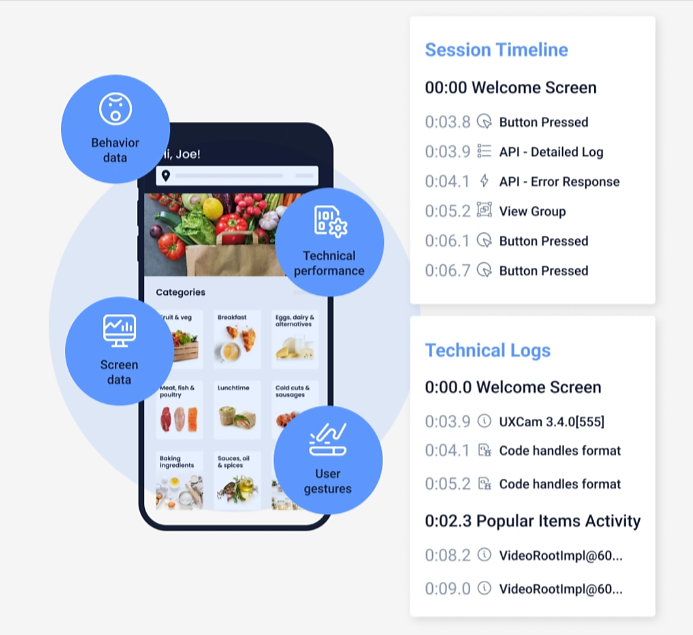
UXCam began as a session replay and heatmap tool for web and mobile apps.
Heatmaps visually represent where users tap, swipe, and scroll, helping teams see how people interact with their app screens.
But many user behavior questions can’t be answered by visual data alone.
To bridge that gap, UXCam’s creators added a qualitative layer of contextual data.
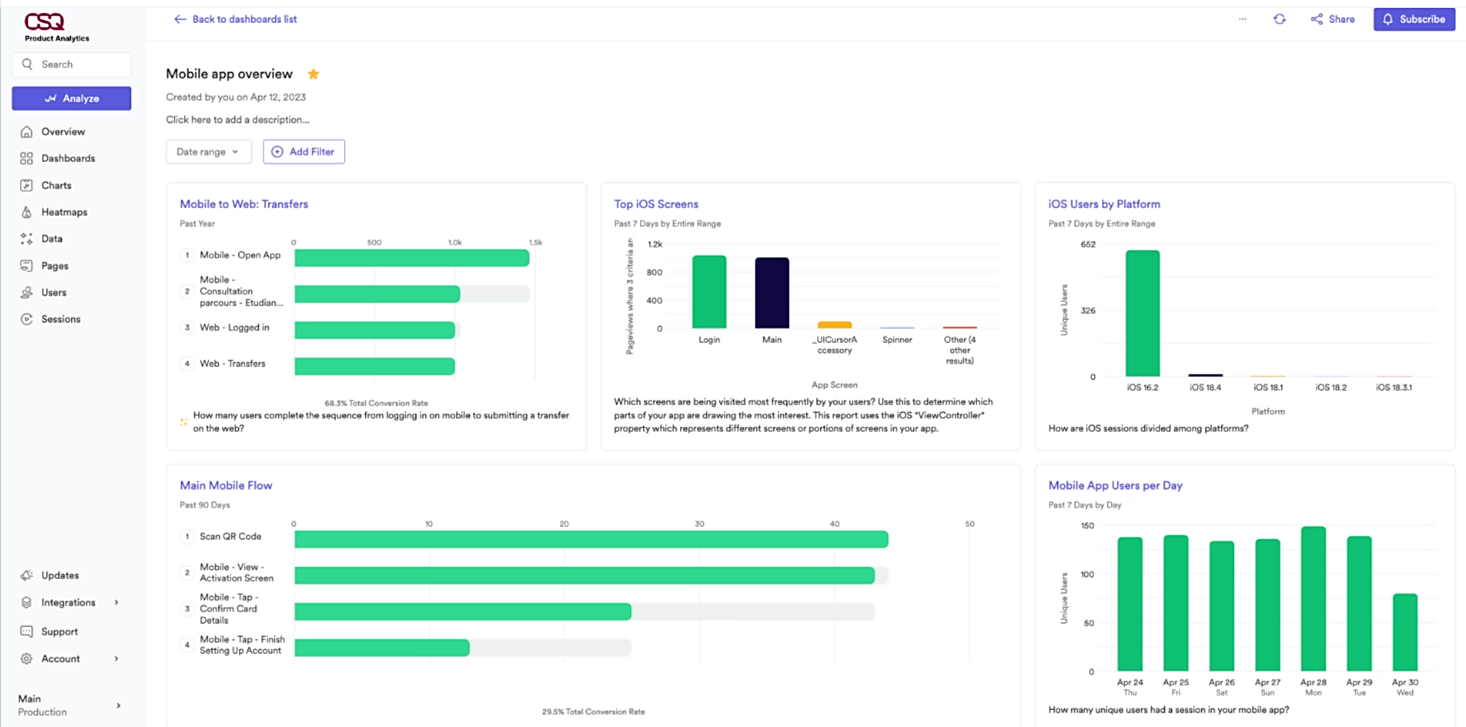
Today, UXCam is a full-featured analytics platform that captures session replays, micro-interactions, crash statistics, and heatmaps, giving teams a complete picture of how users behave.
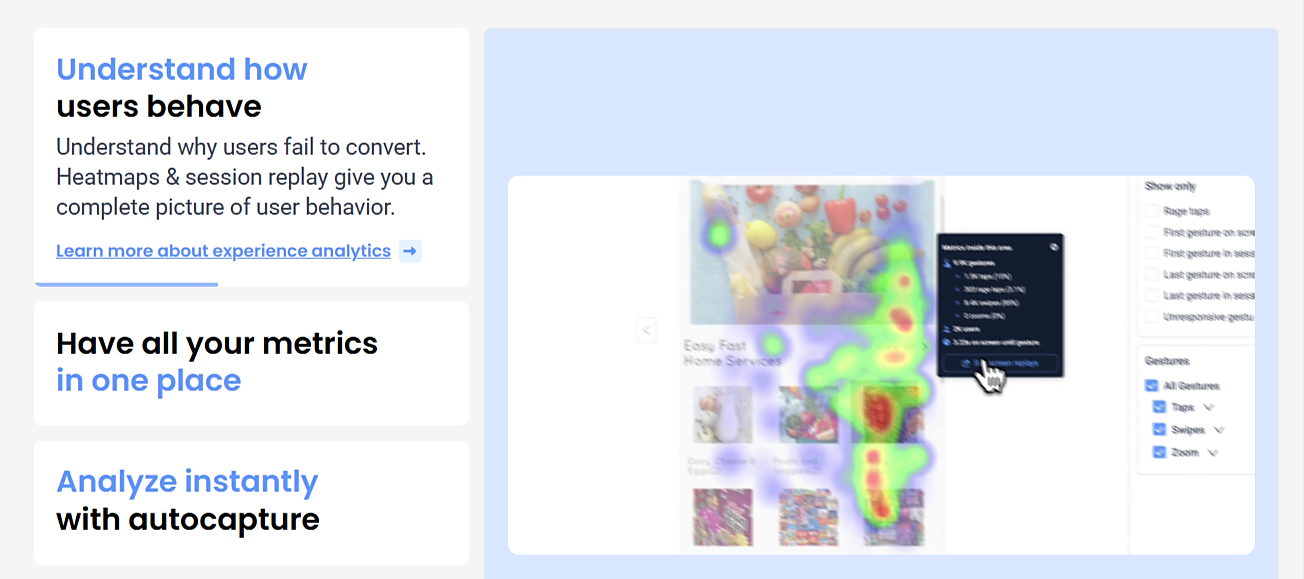
The features shown above give teams a full visual narrative of user journeys while automatically capturing key metrics and every user interaction with no manual tagging required.
More precisely, UXCam records the entire user experience out of the box, making it easy to retroactively analyze behavior across multiple dimensions and uncover usability issues, drop-off points, or technical friction.
In addition to these user-friendly features, UXCam is currently announcing the launch of its AI analyst, Tara.
As the banner below shows, Tara will be able to watch replay sessions on your behalf, identify key behavioral patterns, and surface insights.

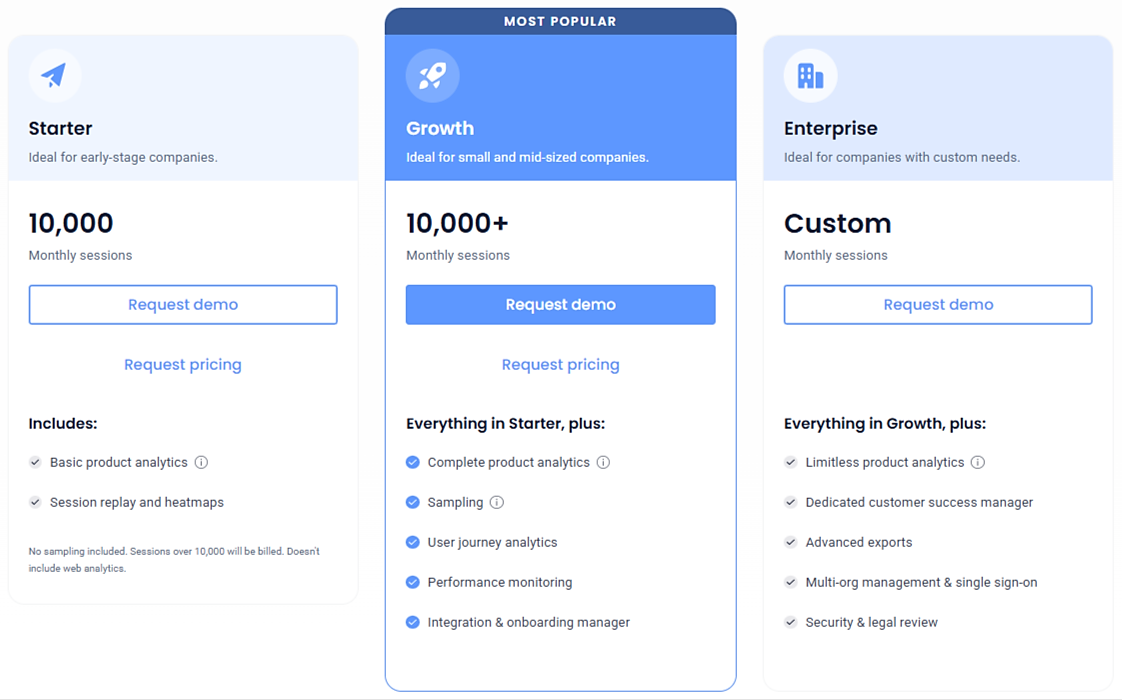
While UXCam generally receives high praise in user reviews, it does not provide specific pricing details.
Its pricing plans are based on the number of monthly sessions, with a free plan capped at 3,000 sessions and limited session replay and data retention features.
Details of the other plans—except for exact pricing—are shown below:
The session-based pricing model is likely why one user noted that additional costs after exceeding the monthly session limit were unexpectedly high.
Overall, UXCam is a comprehensive experience analytics platform whose session replays, heatmaps, and contextual data enable teams to understand user behavior and optimize app performance accordingly.

Capture, Annotate & Share in Seconds with our Free Chrome Extension!
Contentsquare is an enterprise-grade digital experience analytics platform that helps teams understand how users interact with websites, mobile web, and apps.
Like most other solutions featured here, it automatically captures every user interaction—such as clicks, scrolls, and navigation—without requiring manual event tagging.
With its CS Apps solution, Contentsquare extends this tracking to native mobile apps, enabling seamless cross-device and cross-channel analysis.
This functionality enables Contentsquare to connect user journeys across multiple sessions, devices, and channels, whether visitors are anonymous or known.
The result is a holistic view of customer behavior.
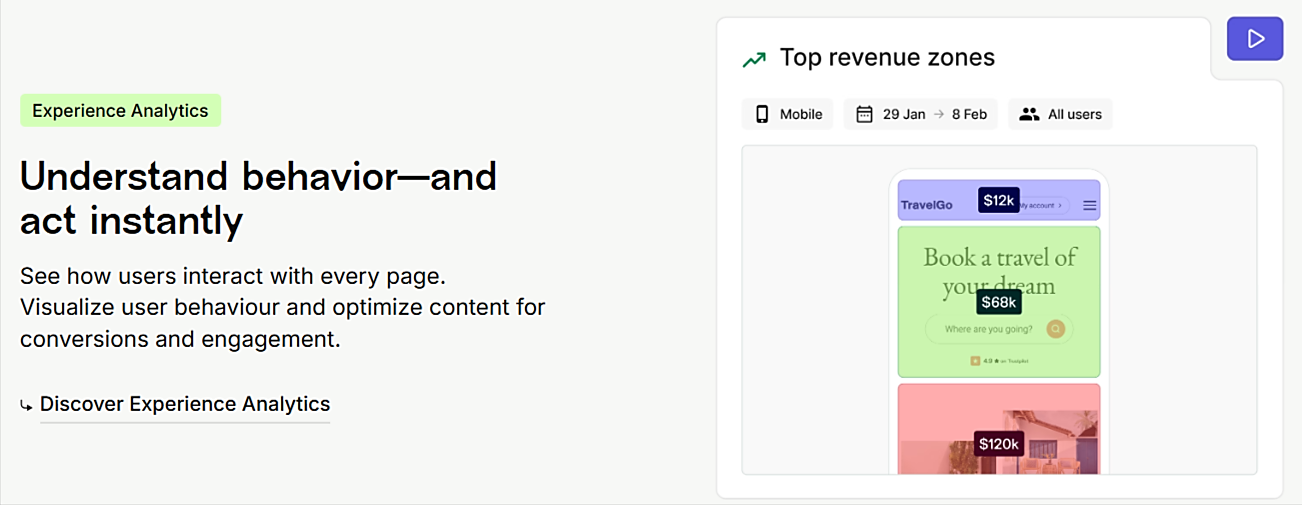
This comprehensive visibility is further enhanced through features like heatmaps, journey analysis, session replays, and zoning analytics.
These are all part of Contentsquare’s core offering: Experience Analytics.
In its higher pricing tiers, Contentsquare also includes AI-powered insights, such as automated frustration detection, trend summaries, and actionable recommendations that help teams prioritize optimizations faster.
Beyond its core Experience Analytics offering, Contentsquare provides two separately charged add-ons:
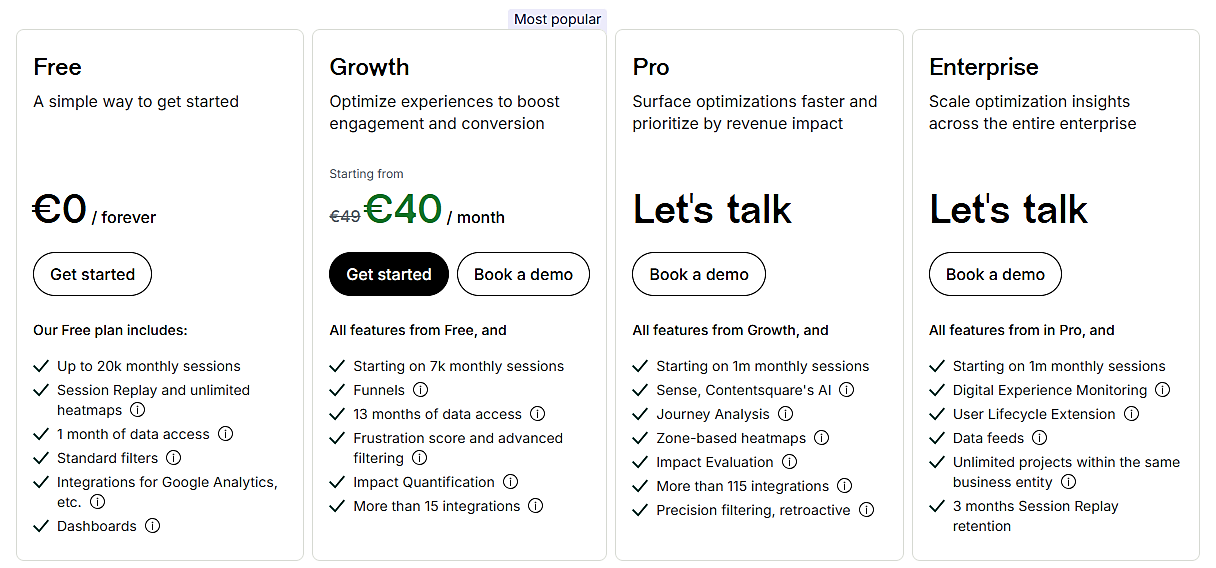
Contentsquare publicly lists only one starting price (€40 per month), with full plan details available upon request.
Here are its Experience Analytics tiers:
While most users give Contentsquare high ratings, some mention steep pricing, complex setup, and integration challenges.
Overall, Contentsquare is a powerful tool for enterprise teams that need deep behavior tracking and AI-backed insights to improve digital experiences.
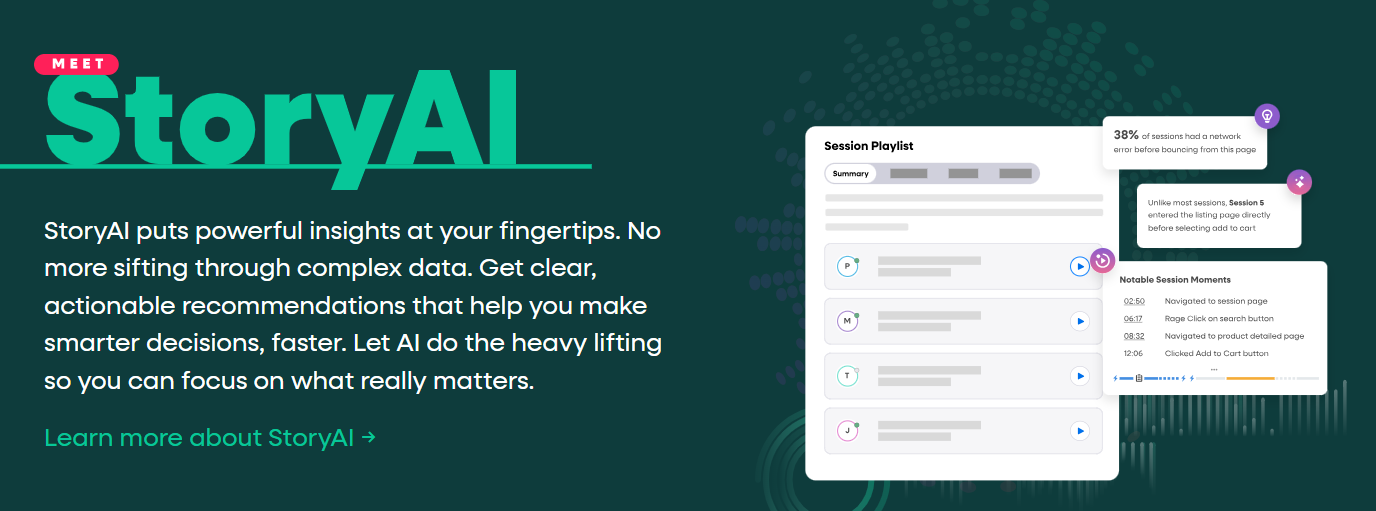
Fullstory is a web and mobile analytics platform that combines user behavior tracking with AI-driven insights and workflow optimization tools.
It offers all the essentials you’d expect—session replays, heatmaps, funnels, and more—for tracking and visualizing user interactions.
One standout feature is StoryAI, an assistant that scans behavioral data and surfaces clear, actionable insights to speed up decision-making.
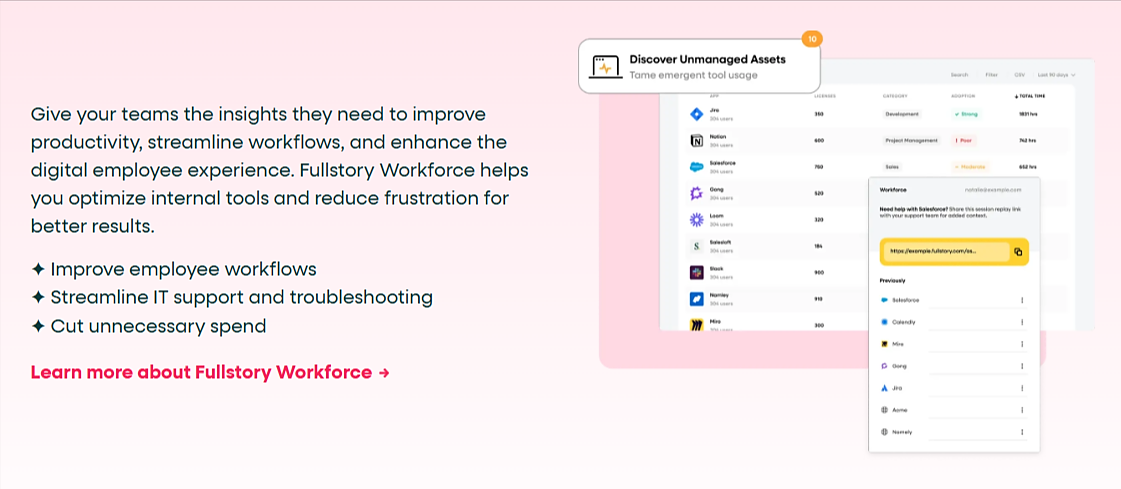
Beyond user analytics, Fullstory also helps product teams drive internal improvements through two key features:
Fullstory Anywhere enables seamless integration with other tools, ensuring that behavioral data flows across platforms.
Meanwhile, Fullstory Workforce focuses on optimizing internal tools and employee workflows that ultimately enhance the end-user experience.
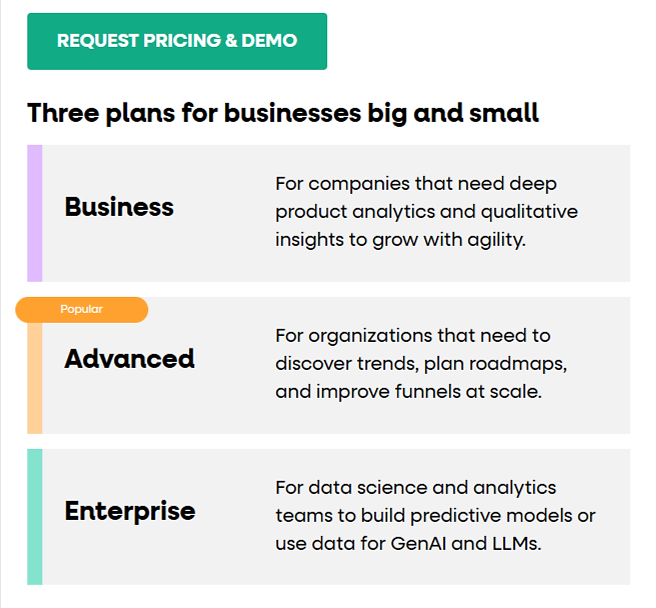
Like many other providers on this list, Fullstory doesn’t disclose pricing publicly.
Instead, you’re encouraged to request a quote and schedule a free demo.
That said, the platform outlines three pricing tiers, each with varying feature sets and limitations.
It’s worth noting that mobile app analytics are treated as an additionally charged add-on across pricing plans.
Similarly, the Business plan—shown below—does not include StoryAI summaries and some other advanced capabilities.
According to some sources, Fullstory’s pricing is based on the number of sessions rather than users.
As one user noted, this model can result in unexpectedly high costs, since tracked events can quickly exceed the allocated quota.
Cost concerns aside, Fullstory is a powerful behavior analytics platform offering advanced AI features and workflow integrations.
And there you have it—seven platforms in the crowded field of user experience analytics, each with its own mix of features and pricing models.
Whether you’re focused on mobile app behavior, user issues, or customer sentiment, the right tool depends on your team’s goals, scale, and budget.
Understanding the strengths and limitations of each option helps you make a more informed decision and ultimately deliver better digital experiences.
From internal bug reporting to production and customer support, our all-in-one SDK gets you all the right clues to fix issues in your mobile app and website.
We love to think it makes CTOs life easier, QA tester’s reports better and dev’s coding faster. If you agree that user feedback is key – Shake is your door lock.
Read more about us here.

Add to app in minutes

Doesn’t affect app speed

GDPR & CCPA compliant

Unexpected things pop up
Just like bugs in your app or web 🐛 Fix them now with just one reporting tool.