
Bug reporting takes time. Here’s how AI helps teams work more efficiently

As technology continues to advance, it’s important that developers keep tabs on their app’s performance.
But how to know which metrics to measure?
If a mobile app is experiencing issues, there are plenty of things that could be at the root of the problem—from latency to memory usage to errors, no two apps are alike.
So rather than try to isolate one or two most important metrics, we’ve come up with a list of nine key components you should be monitoring.
Stay tuned for a deeper dive into each one.
Table of Contents
Because a CPU is the heart of any app system, monitoring its usage can be essential to ensure smooth performance.
If your app eats up too much processing power, it can slow down or lag while in use.
It can also cause a device to become hot and drain its battery more quickly than normal, and that’s something no one wants.
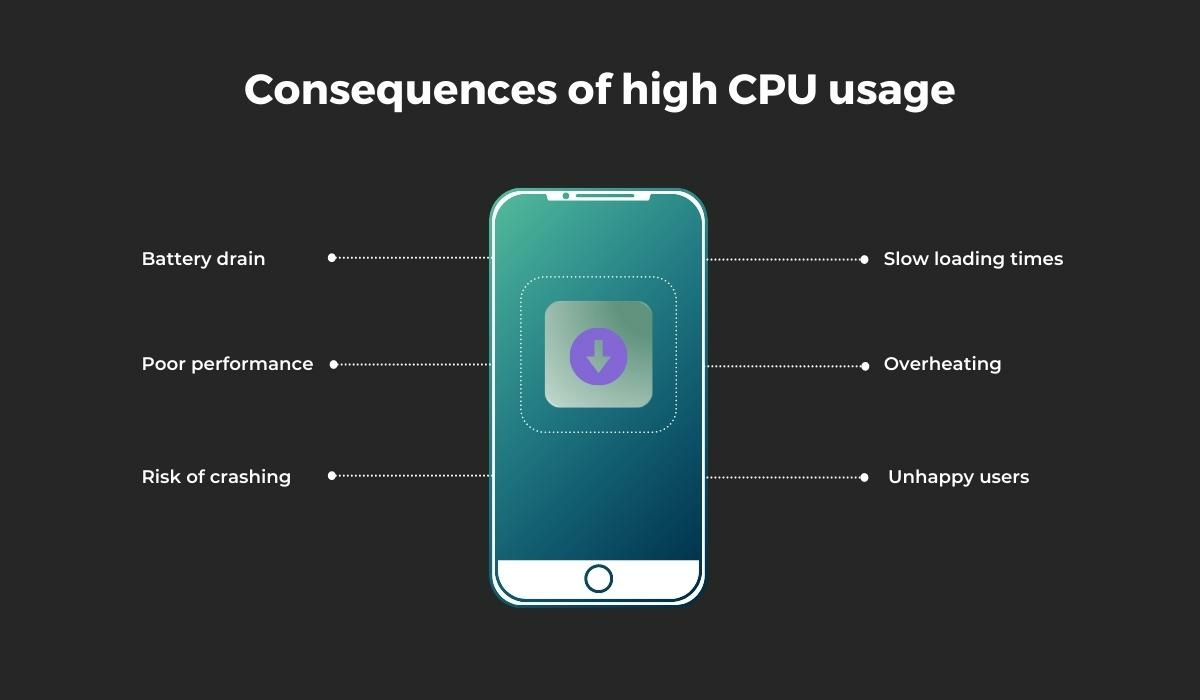
As you can imagine, this can significantly impact user experience.
Monitoring CPU usage can also help you spot potential issues that could lead to problems in the future.

Get unreal data to fix real issues in your app & web.
For example, if you notice that your CPU usage is high while your app is idle, it could mean that there are too many processes running or that something isn’t properly optimized.
This way you can get a better idea of whether the problem persists and what may be causing it.
If you’re developing Android mobile apps, CPU Profiler can measure the app’s CPU usage for you.
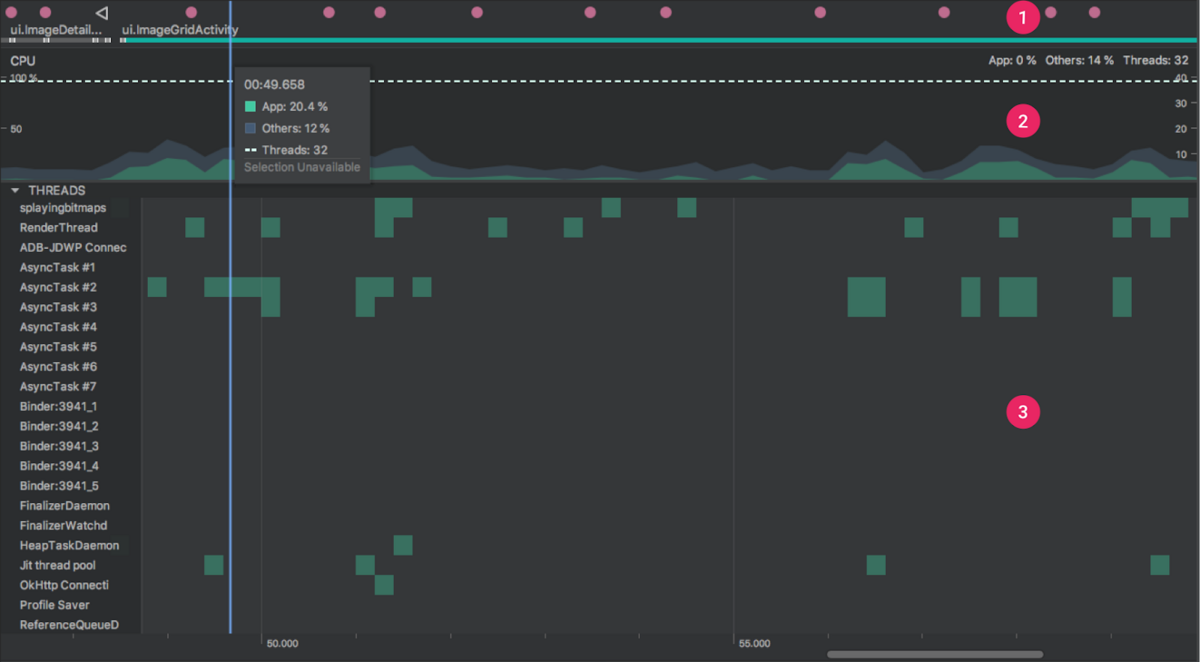
For iOS, you can use the Instruments tool in Xcode to measure processing power.
Either way, paying attention to your app’s CPU usage is one of the most important things you can do to ensure a smooth, fast user experience.
In general, mobile apps grow in size as they evolve over time–from the initial release to updates and new versions.
As they get bigger, they take up more space on the device.
While this isn’t necessarily problematic in itself because today’s phones have enough memory to handle the extra weight, high memory usage can still lead to issues such as crashes and slow performance, especially if the user launches multiple apps at once or has limited storage space.
For example, Jack Wallen of TechRepublic has encountered this problem several times and needed to restart his device in order to fix it.
I’ve experienced it a few times in the past. The biggest indicator was a phone getting hot and the UI being irresponsive.
This can be frustrating for users and make them wonder why their phone is suddenly acting up.
Therefore, developers who want to tune their app’s performance should get in the habit of monitoring memory usage.
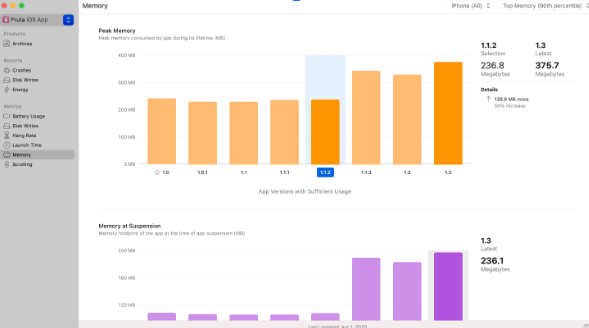
When your app’s memory usage is too high, for example, you may want to see which features or objects are consuming the most memory and why.
You may also want to see how your app behaves in different situations, such as when the user is interacting with it or when it’s idle.
This will let you make informed decisions about how the app is performing, allowing you to detect memory issues and improve it.
Now that we’ve covered performance basics like CPU and memory usage, let’s move on to more advanced topics like app latency.
App latency refers to the time it takes an application to complete a given task or function.
This includes things such as how long it takes to load content from the server, how long it takes to process user interactions and produce a response, or how long it takes for a user to move from one page of your app to another.
App latency should be one second or less to provide users with the best experience.
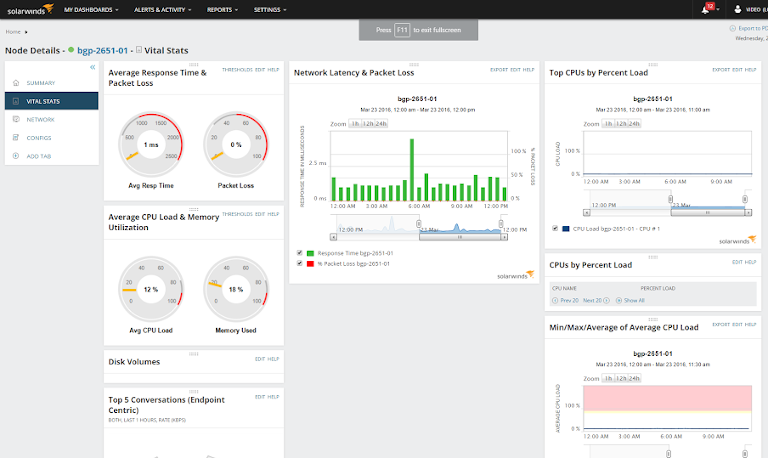
One method of measuring latency is through a tool such as New Relic or Network Performance Monitor, which will help you identify and diagnose issues with your app’s latency.
You can use these tools to see if your app has high latency in specific areas or find out what causes a sudden drop in response time.
If latency is high in any part of your app, then you may want to consider using content delivery networks (CDNs), which are networks of servers that deliver content based on geographic location.
Sometimes, when faced with app latency issues, you can also trick users into believing that everything is working properly by using progress bars and dynamically loading pages.
While these techniques can lower latency, you should still monitor it to ensure that it doesn’t creep back up over time.
In addition to CPU, memory usage, and latency, you should also keep an eye on the error rate.
This performance metric measures the percentage of requests with errors out of all requests during a given time period.
A big spike in the number of errors will likely mean that you’ll experience significant performance issues soon.
But if your app has a low error rate, it means that the majority of your requests are successful, and users can enjoy a smooth experience.
Some applications, such as GitHub, for example, even reveal their error rate publicly as well as a history of such incidents to demonstrate that they can successfully handle the load created by users.
There’s a wide array of tools you can use to monitor your app’s error rate.
For example, tools such as Scout, Rollbar, and Airbrake can provide a more in-depth look at your app’s health and performance, including the error rates of individual requests as well as their impact on your system.
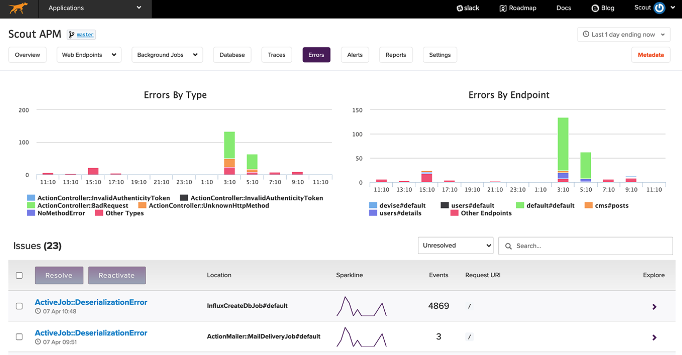
These tools also show you where the errors are occurring, enabling you to improve your error rate and performance by pinpointing the source of the problem.
By tracking these metrics over time, you can see if your error rate is going down and if there are any trends that need to be addressed.
A crash is an action that makes an app stop functioning, even if it only lasts for one instant.
This metric is important to measure because it indicates how often your app stops mid-use.
If the number of crashes is high, it could indicate serious problems with the app and should be investigated.
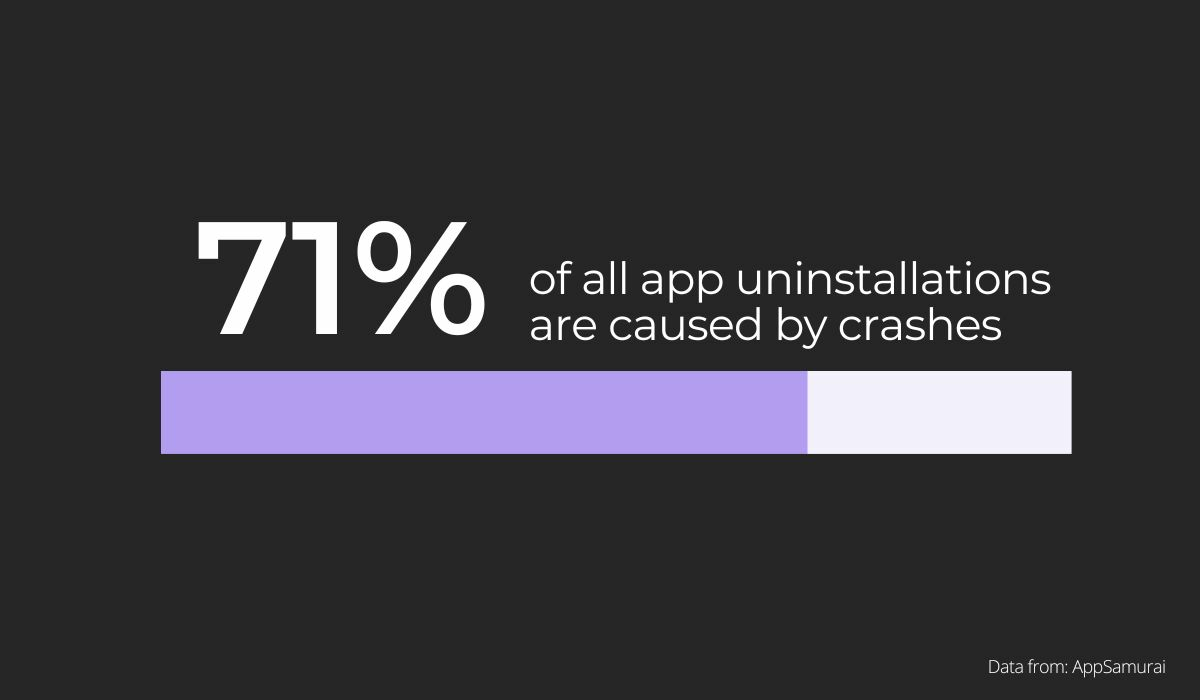
Also, many users tend to quit apps after they crash—making this metric of paramount importance.
You can calculate the crash rate by dividing the number of crashes by the number of users who ran the app and then multiplying that by 100.
This gives you a percentage that can be compared over time to see if your app’s crash rate is increasing or decreasing.

For example, if you have 500 users and 20 of them crash, your app’s crash rate is 4%.
The higher this percentage is, the worse your app performs.
To reduce the number of crashes, you need to test your app often—especially before launching it.
For that purpose, you can use crash reporting tools, such as our very own Shake.
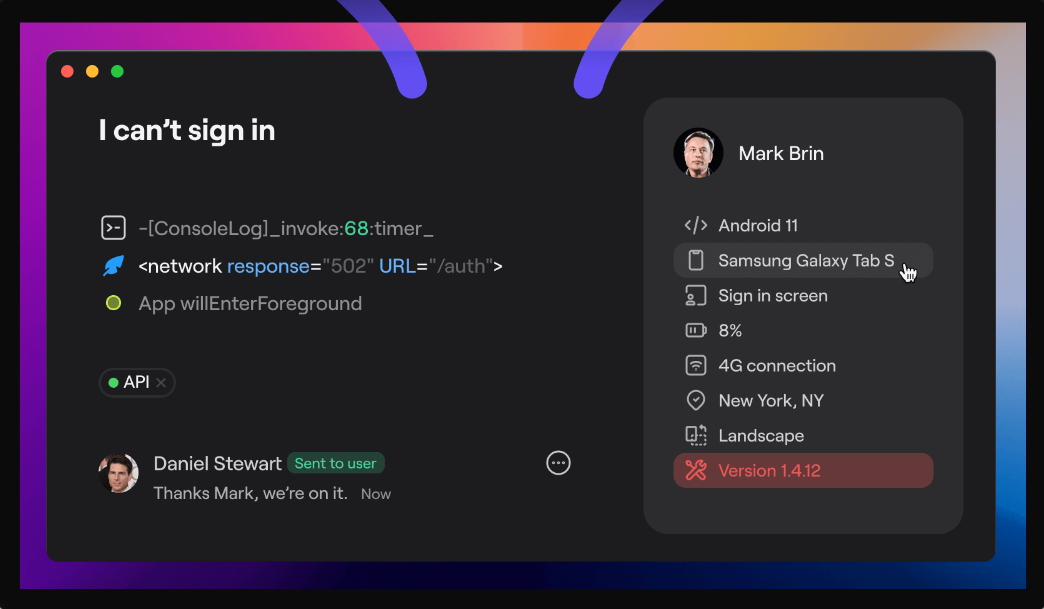
With a single shake of the phone, it will automatically check if your app is working properly and report potential crashes back to you.
It has everything you need to test your app’s performance, including the ability to generate screenshots of user crashes, track device information, and more.
Regularly maintaining and updating your app will help you fix bugs and prevent crashes before they even happen.
When it comes to mobile applications, the request rate is one of the most important metrics to track.
It’s a great indicator of how your application is being used, and whether or not you need to make any changes.
But what exactly is the request rate?
In a nutshell, it’s the number of requests your application receives over a period of time.
It’s calculated by dividing the total number of requests by the amount of time that’s elapsed.

Based on this number, you can see how many requests an application receives on average every minute, every hour, and so on.
This metric is especially useful for applications that require high levels of interaction with users, but it can also help you determine how well your application performs under load.
If your application, for instance, receives more than 1,000 requests per second during peak hours of activity and your server is unable to keep up with the demand, then you may need to scale up or add more servers.
All in all, the request rate can be used to identify any bottlenecks in your application.
It can also be used to see if your application is being throttled by the network or backend.
We all know that it’s important to have a high retention rate in order to have a successful app.
Retention rate is the percentage of people who, having downloaded your app and tried it once, continue to use it.
You can get an idea of your app’s retention rate by dividing the number of active users by the total number of installs over a set period (say 30 days).
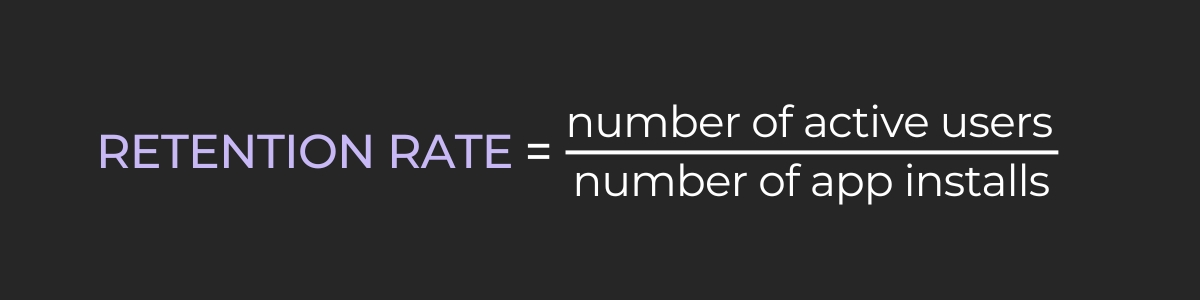
The higher your retention rate, the more likely it is that people will continue using your app after their first use.
For example, if you have 1,000 downloads and 500 active users after 30 days, your app’s retention rate is 50%.
This means that half of the people who downloaded your app used it again.
Why is this number important?
Because it tells you how much of your user base is sticking around.
If the retention rate is low, it means that people are leaving your app after their first use and not coming back.
This can be a sign that they didn’t find what they were looking for or that they had a bad experience.
This information can help you identify where your app’s strengths and weaknesses are so that you know where to focus future development efforts.
And that is something worth considering.
The Apdex is a relatively new metric, but it has already become a common term.
Although it’s a little complicated to grasp at first, once you know how it works and what each part means, you’ll be able to put its benefits into practice and see the results.
It works by establishing a benchmark for how long requests should take.
These requests are then categorized into three types—satisfied, tolerating, and frustrated—and the score is calculated using a simple math formula.
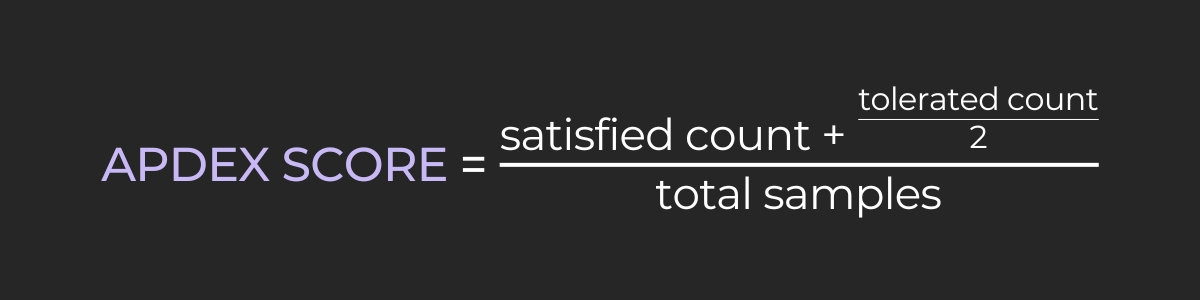
If everyone is happy with an app’s performance, then its Apdex score will be 1.
However, if the majority of users are frustrated, then its Apdex score will drop to 0.
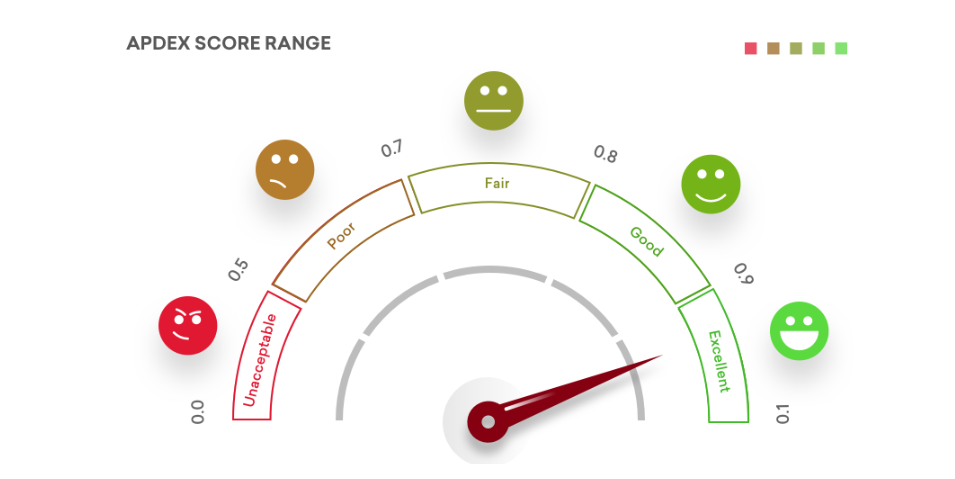
This metric can be valuable when you’re trying to get a feel for how customers are actually experiencing the app.
When you notice that an app’s Apdex score dips below one, it means something needs to be done.
It can also be helpful when you and your team are deploying new features. If you see that the Apdex score drops after deployment, then it’s a good idea to figure out why.
By tracking this metric over time, you’ll be able to see whether or not your app’s performance is improving or declining.
This is particularly important for apps that are used regularly, like e-commerce or social media apps.
Net Promoter Score (NPS) is a great metric to take into account when judging the performance of your mobile app.
It’s based on asking users a single question: “How likely is it that you would recommend this app to a friend or family member?”
The answer is scored on a scale of 0-10, with 10 being very likely, and 0 not being likely at all.
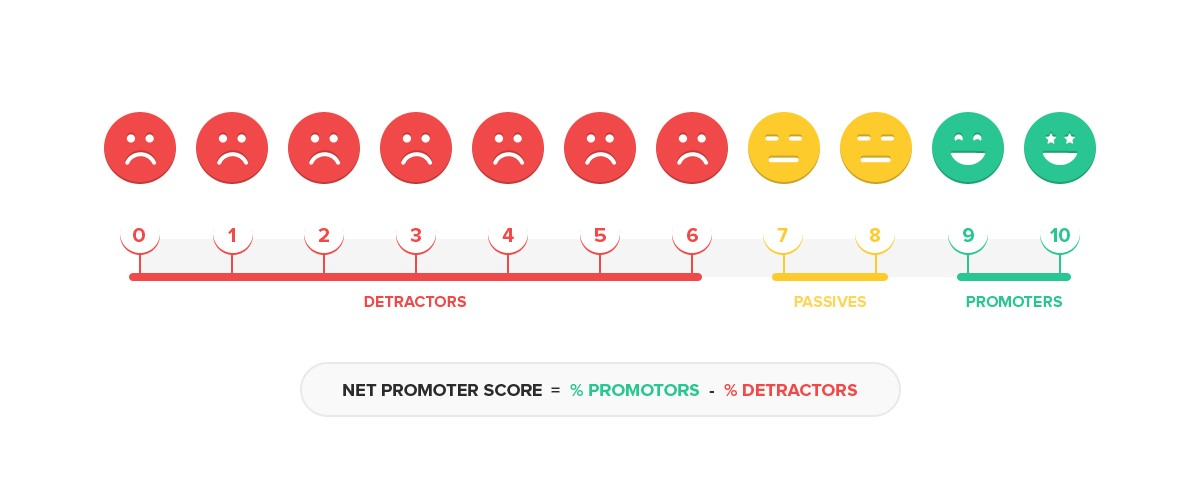
As shown in the picture, if the score is 9 or above, then you have a promoter, if it’s 0-6, you have a detractor, and if it’s 7-8, you have a passive person.
If you have more promoters than detractors, then you have a good NPS.
This means that people are talking positively about your app and are likely encouraging their friends to use it as well.
You can easily find the number of promoters, passives and detractors through in-app surveys that ask users to give you feedback on your app.
Also, you can use social media and email marketing to ask for user feedback.
This metric is a great way to measure how you’re doing in terms of customer satisfaction and loyalty.
It lets you know whether users are enjoying and recommending your app or not, which will help you improve it over time.
Trying to track your app’s performance can be a challenge—but it’s something that you shouldn’t leave to chance if you want to know how your app is doing.
But what should you track? How can you use this data to improve your app’s performance? And what are some of the best tools for doing this?
These are some of the questions we tried to answer in this article.
Hopefully, this will help you to better understand the importance of app performance tracking and give some ideas on which metrics are worth measuring.

From internal bug reporting to production and customer support, our all-in-one SDK gets you all the right clues to fix issues in your mobile app and website.
We love to think it makes CTOs life easier, QA tester’s reports better and dev’s coding faster. If you agree that user feedback is key – Shake is your door lock.
Read more about us here.

Add to app in minutes

Doesn’t affect app speed

GDPR & CCPA compliant

Unexpected things pop up
Just like bugs in your app or web 🐛 Fix them now with just one reporting tool.