
Bug reporting takes time. Here’s how AI helps teams work more efficiently

Usability testing is your way of finding out how well real people will respond to your product in terms of its effectiveness, efficiency, and comfort when completing tasks and solving problems.
It’s done through careful observation of users when they’re interacting with the software and tracked by applying various tried and true metrics that will give you objective insights into user experience.
In this article, we’ll cover some of the most commonly used metrics and show you how to do usability testing the right way.
Let’s start with the most basic one: completion rate.
Table of Contents
The key to understanding usability lies in being aware that it isn’t just one solid characteristic of a system but a dynamic combination of properties.
As such, usability actually contains three factors:
Effectiveness is the foundation on which usability is built—and the metric that can help you track it is called completion rate.
Completion rate is simply the percentage of users who successfully completed a specific task in a specific context using your product, compared to the total number of users who have attempted it.
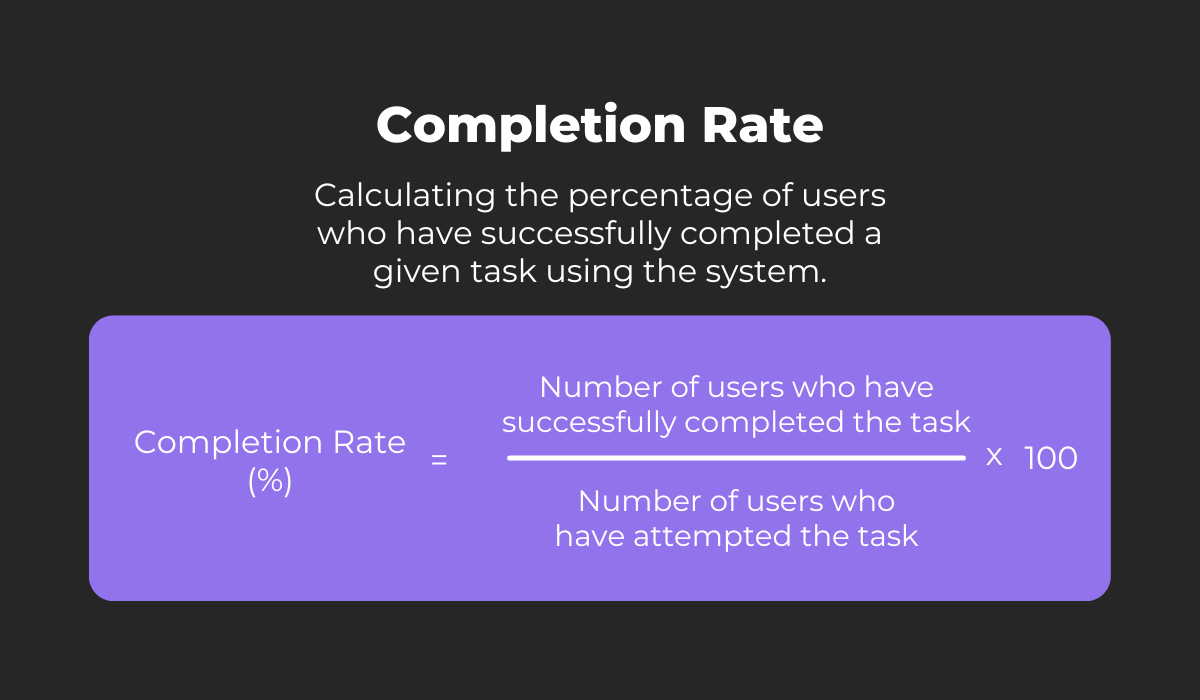
The result is a percentage that can be interpreted as the level of effectiveness of your software at completing the measured task.

Get unreal data to fix real issues in your app & web.
The simplicity of this metric is what makes it so popular.
It’s also very easy to express visually to get instant understanding of how users are performing within the software when they set out to complete tasks with it.
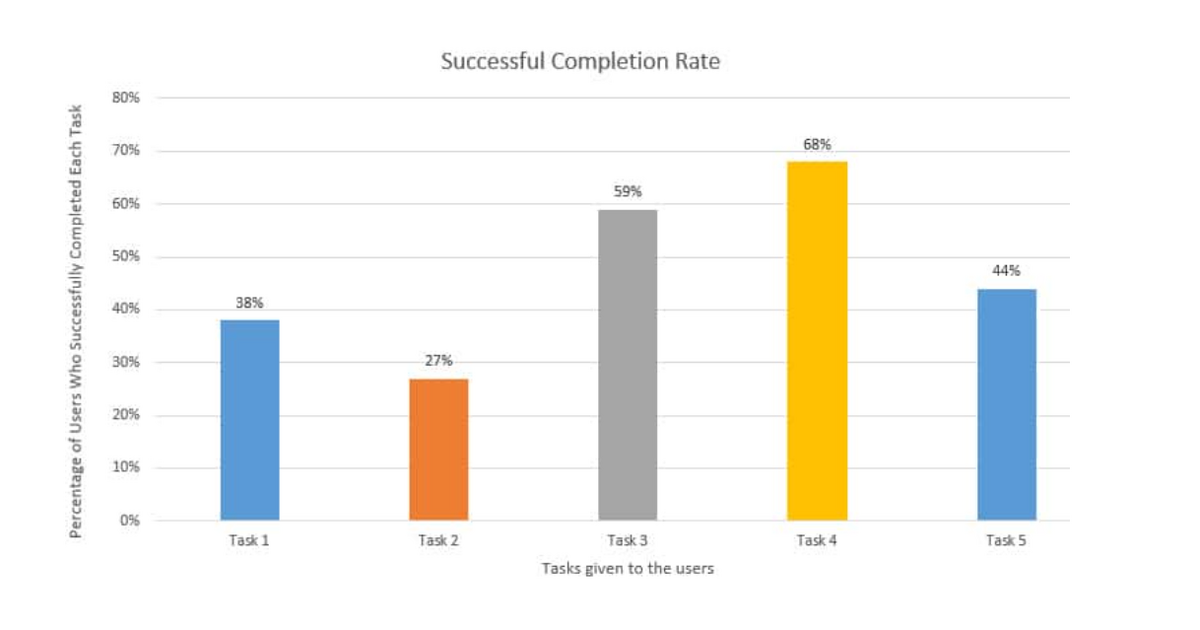
So, if you track tasks within the software with this metric, you stand to get valuable insight into which tasks users are having trouble with.
Using that information, you know exactly where to focus your efforts to make tasks easier to complete, which will improve the overall usability of your product.
Completion rate is a very valuable metric, but it’s missing a key component: time.
If most of your test subjects can complete a certain task but only after a long period of trying, that might mean the system isn’t an effective solution for that task after all.
Now, that doesn’t mean that task completion should always take as little time as possible.
Keep in mind that complex tasks inevitably require a bit of time and effort, and it’s the user’s perception of how much of it they should invest in a certain task that really matters.
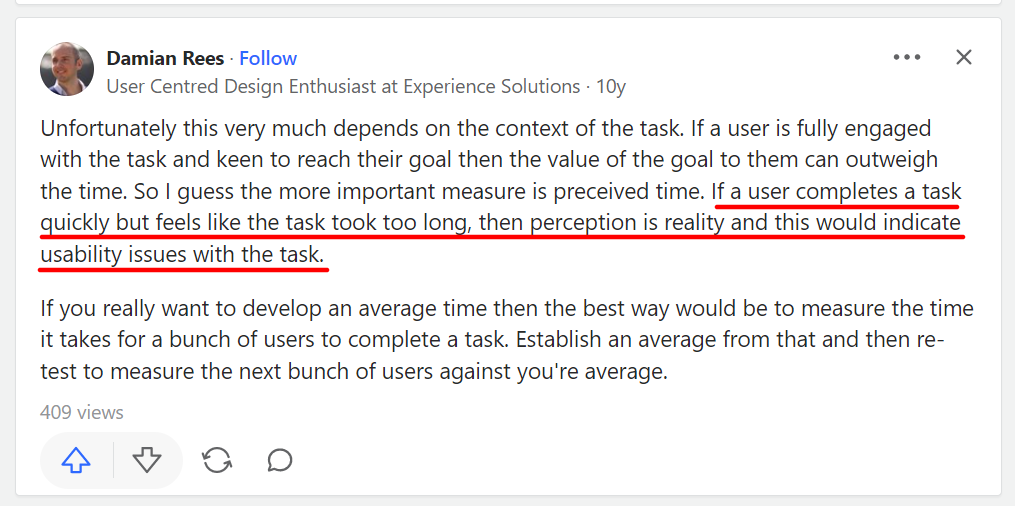
Nevertheless, a user who feels that a task is taking too long will abandon it eventually, meaning you’ll need to keep a close eye on how much time testers are spending on a task and optimize as much as you can.
This metric is tracked by measuring the time that passes between when the user begins the task and completes it.
If you’re doing remote usability testing, you can track time on task with great precision, using tools with a session recording feature.
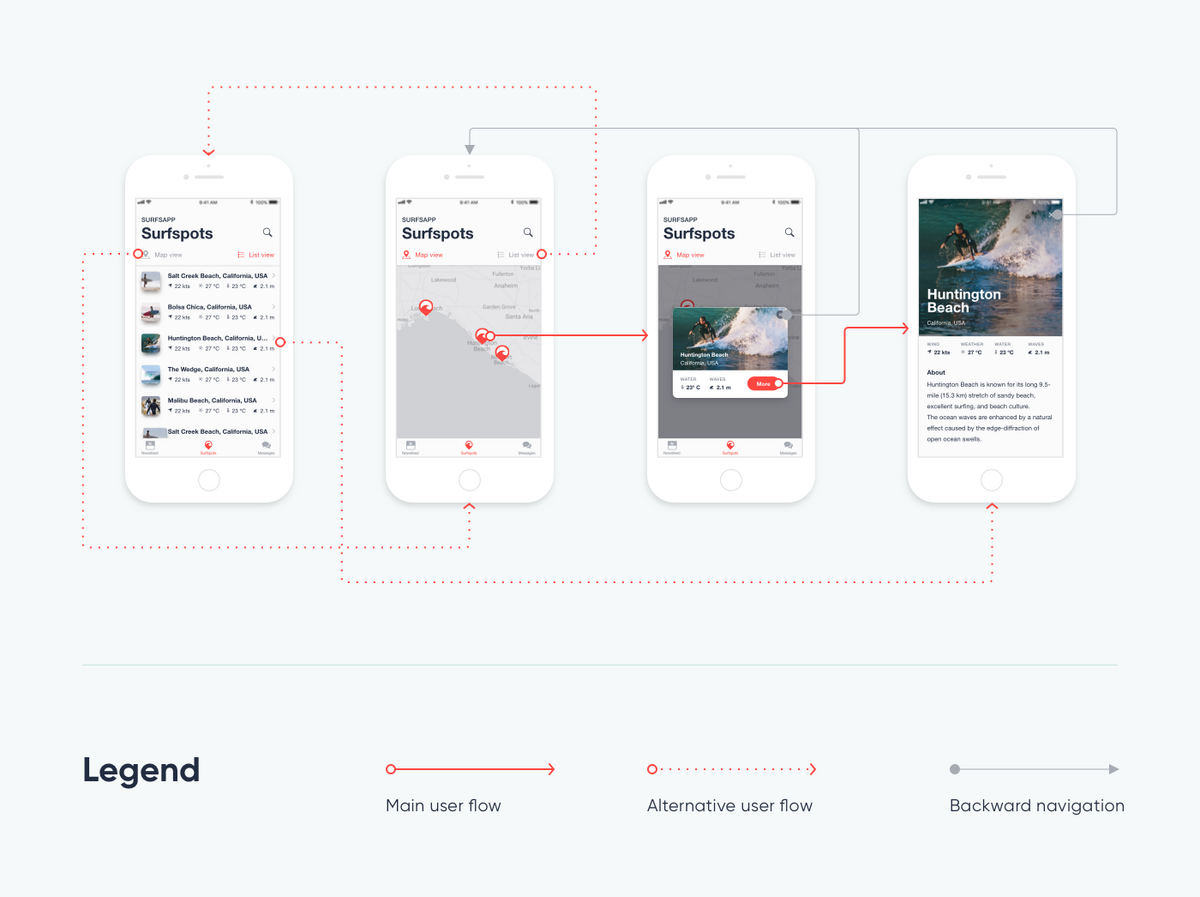
Here’s how session recording looks in UXcam:
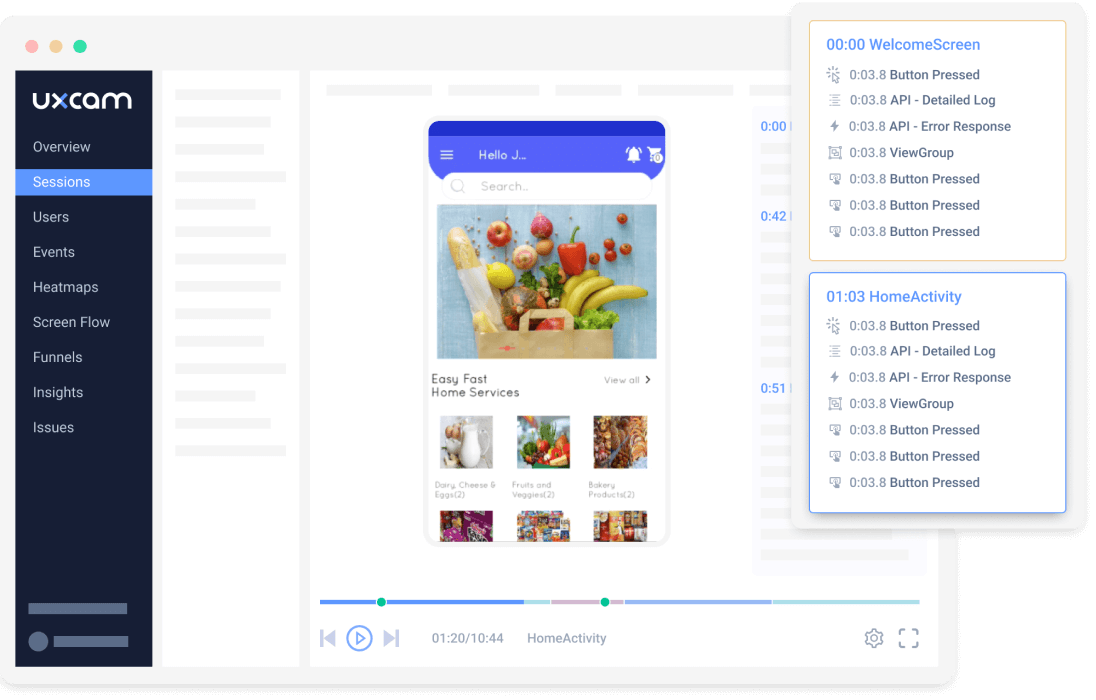
The insight you can get from this type of tool is impressive.
Apart from showing you how long it took the user to complete a task, it also shows you which actions they took to arrive at the solution and when each action occurred.
With this kind of data, you have a micro-view into which steps represent obstacles and prolong task completion and which make it easier.
Remember, modern technology users want quick solutions and low-effort task completion.
To deliver on that, you’ll need to look beyond completion rates and closely measure time on task if you want to increase usability.
A good way to measure efficiency in your software is to count the number of user actions taken to complete a task.
The fewer actions a user needs to take to complete a task, the more efficient the process of completing the task.
Having designed the software, you already know the best and fastest way to complete a given task. That means that any deviation from this procedure can signal a usability problem.
For example, let’s say you’re tracking a task that can be completed in at least three steps.
If usability testing discovers that many users are completing the task in five actions (say, by going back or making a wrong step), that’s a clear sign that there’s room for improvement.
To improve usability, you’ll need to make the correct sequence of actions clearer for the user, perhaps by enlarging on-page elements or removing options that are confusing or frustrating to the user.
The efficiency of task completion in your software depends on users quickly finding their way from start to finish.
If testing reveals too much wandering and superfluous actions, then the task isn’t as efficient as it can be, and it should be improved.
Another way to spot and remove obstacles in the user’s path is to track what kinds of errors pop up during usage and how often the same error is experienced.
Errors can be very frustrating for users and may drive product abandonment, so discovering why and how they appear can impact usability significantly.
An error, in this case, can be defined as anything that prolongs or interferes with successful task completion and is generated by the user.
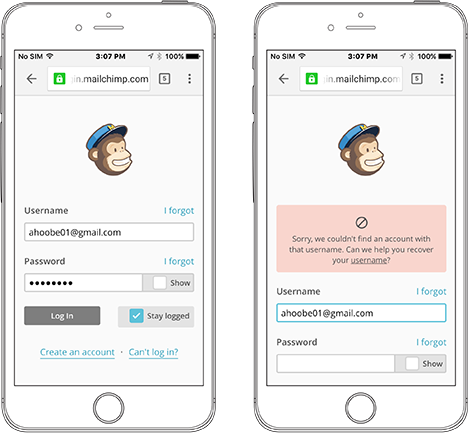
For example, choosing the wrong menu or entering the wrong credentials both may seem like inconsequential errors, but if they crop up too often, they can seriously jeopardize the usability of the product.
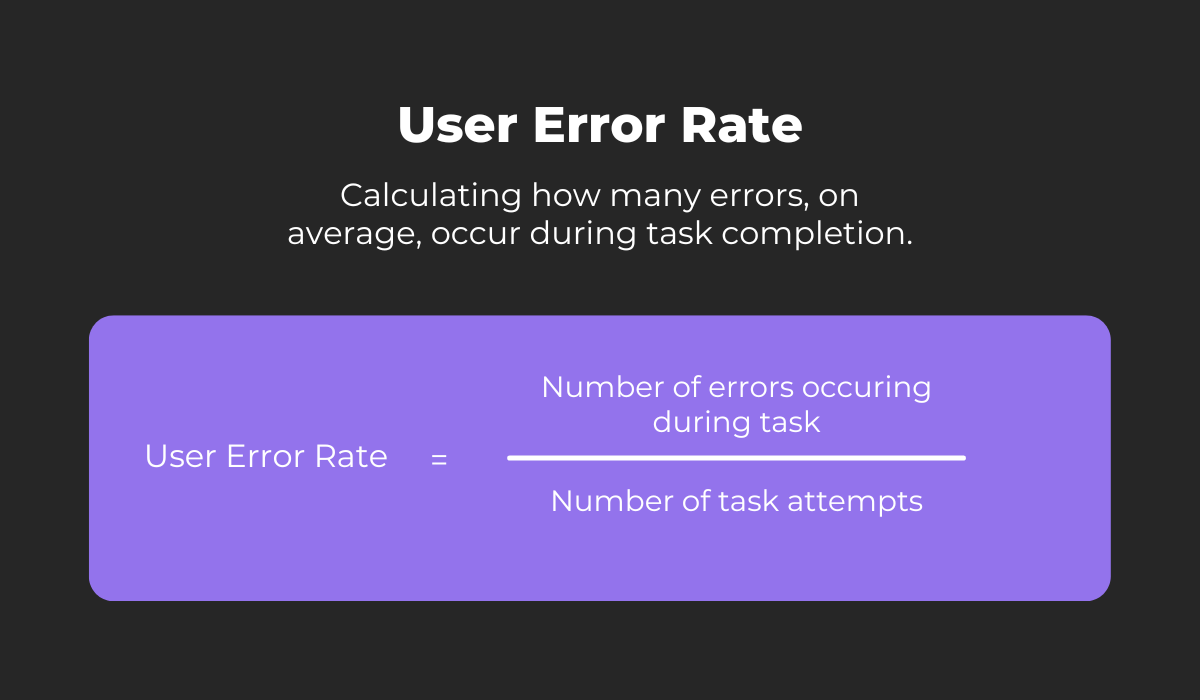
Error rates are easy enough to calculate. All you need to do is divide the number of errors by the number of attempts to accomplish a specific task.
However, the problem with this metric is that it can be challenging to automate the process of identifying user errors.
In many cases, this part of usability testing is done by reviewing user sessions and recording which mistakes occurred and how often.
This is a valuable metric to track because eliminating the causes of user errors is one of the most effective ways to improve user experience and usability.
This metric is quite similar in character to user error rate because it also focuses on finding points in product usage that are problematic for the user or tester.
The difference here is that you’ll be looking for instances when users reached out to ask for assistance in completing a task.
It’s easy to see the value here. If users request assistance when completing a task, then that means that the actions needed for task completion aren’t self-evident but rather confusing.
Clarifying how to complete the task and making the process more intuitive will improve usability significantly.
If you’re conducting usability testing in a lab environment, then the methodology for collecting this data is pretty straightforward.
Just record every instance of a tester requesting help with completing the assigned task or expressing doubt about what to do next.
You can also measure help requests on a bigger scale once the product is launched by tracking support tickets created by the customer service team.
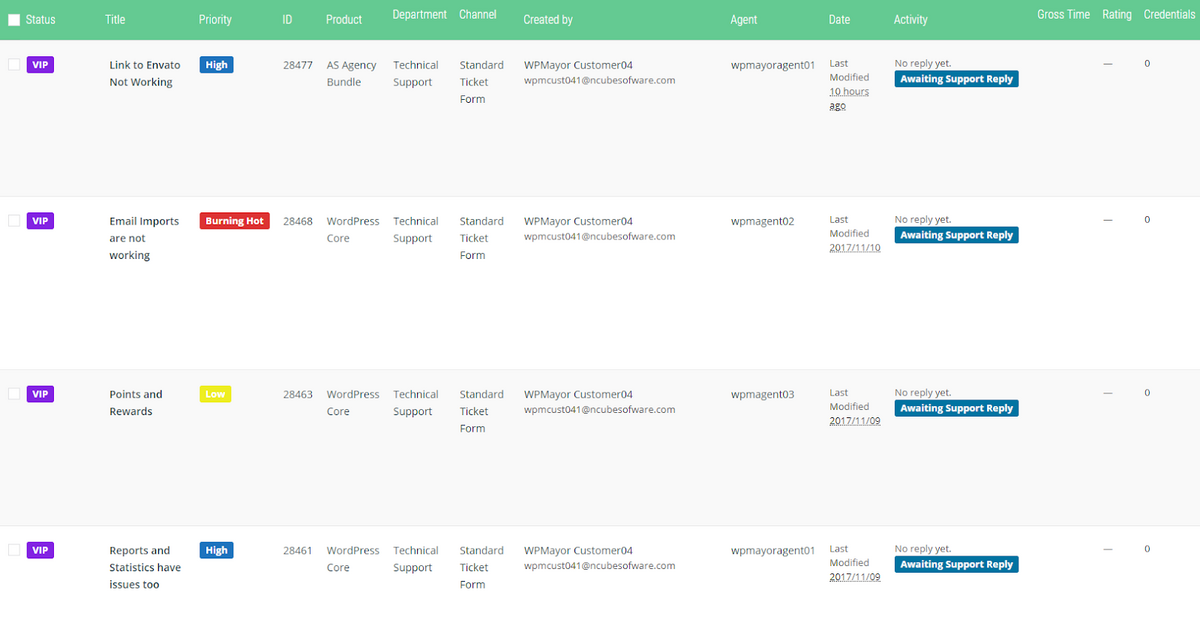
In both cases, you’ll want to divide the help requests into categories so you can measure the frequency of the problems users are facing.
The issues that crop up most often can be prioritized, and you can tackle them first in order to help the greatest number of users have a pleasant experience.
Up to this point, we have discussed metrics that don’t require direct interaction with the tester or user.
However, the testers themselves can provide you with a wealth of information on how effective, efficient, and satisfying the software is in completing tasks, so let’s look at some metrics that focus on the tester.
We’ll start with task level satisfaction.
This metric is tracked by having testers fill out a short questionnaire immediately after completing a task as a means of giving you feedback on it.
The questionnaire can contain several questions, but it often has just one (especially when many tasks are measured during usability testing), referred to as the Single Ease Question (SEQ).
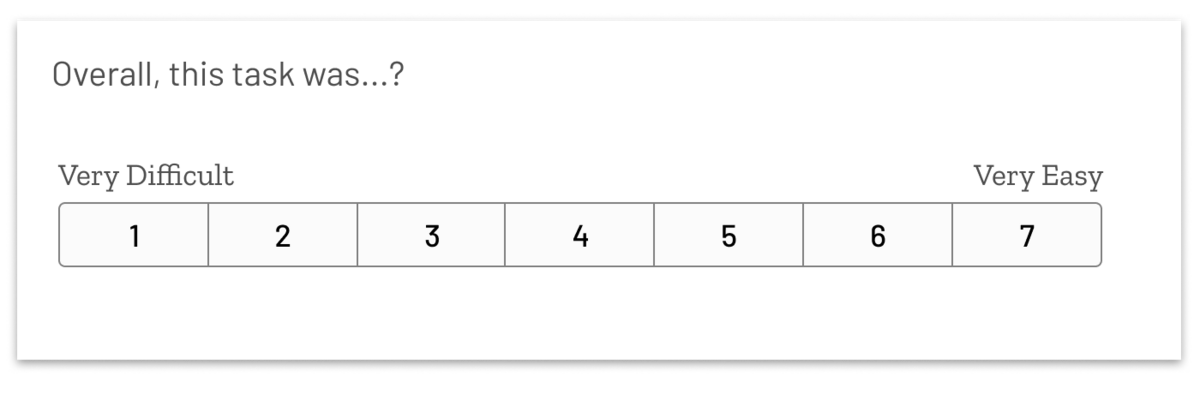
The tester answers the single ease question by rating the task on a scale from one to seven.
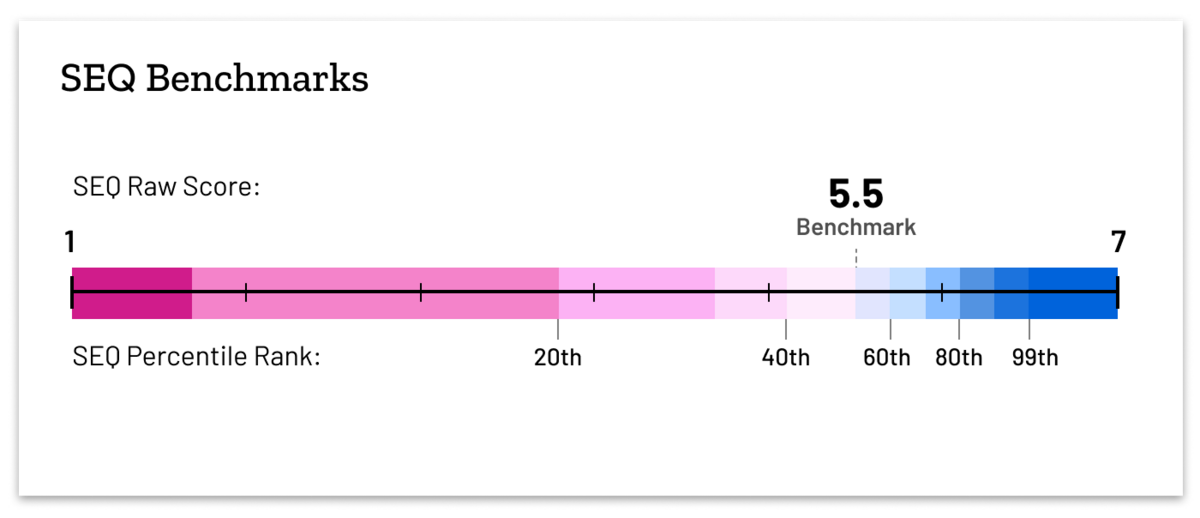
Once you collect enough feedback in this way, you can compare the average result to the commonly accepted SEQ benchmarks to see if this task gets a passing grade or if changes need to be made to make the task easier for users.
As you’ve probably noticed, this is a very easy metric to track, but it’s popular in usability testing because it’s accurate and correlates to the other metrics we’ve discussed here.
Notably, these are completion rate and time on task, which makes sense because users who aren’t able to complete a task or take too long to do it are very likely to mark it as difficult.
The same methodology can be applied to the level of the entire system, which is the topic of our next section.
As testers complete a whole set of tasks and get familiar with the product as a larger system, they’ll form an impression of it that you can quantify using the test level satisfaction metric.
This metric is used to collect feedback on the ease of use for the entire product, and the methodology once again involves a questionnaire distributed after usability testing is completed.
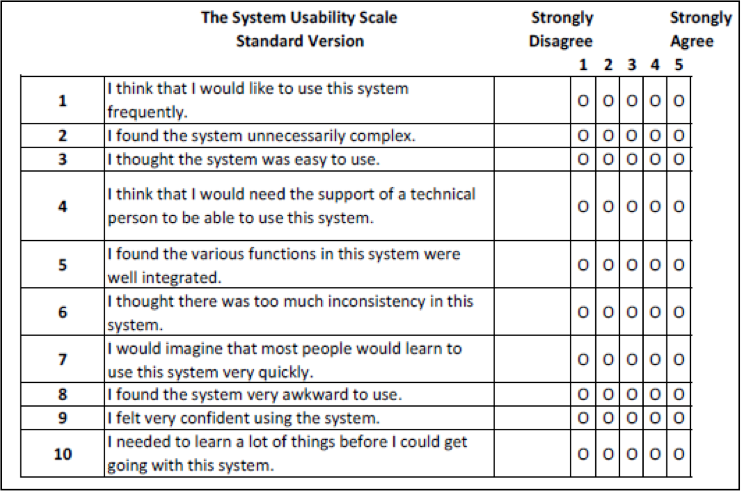
The questionnaire commonly applied for this metric is the System Usability Scale (SUS) which consists of ten questions. Here they are:
After you’ve collected the feedback, it’s time to calculate your SUS score. There’s a set formula for that:
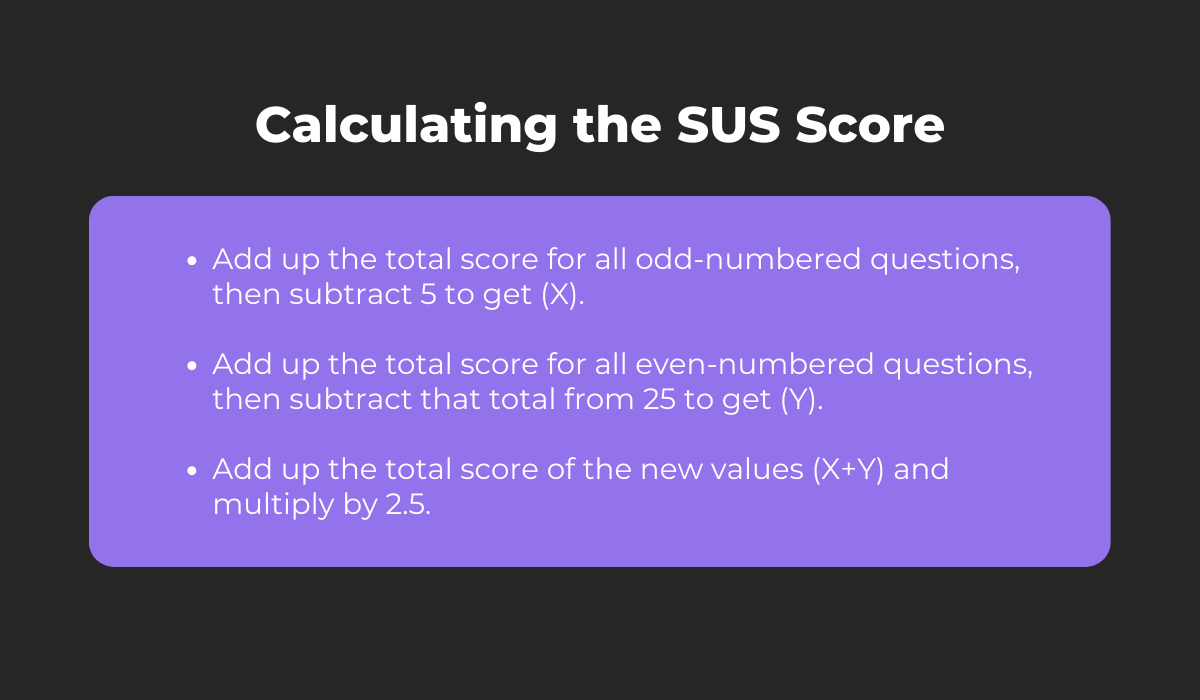
The SUS score will be a number lower or equal to 100 which you can then compare to the SUS benchmark, just like we did with the single ease question.
Comparing your SUS score to the benchmark will instantly tell you how well your system worked for the user and reveal if it passes this usability test.
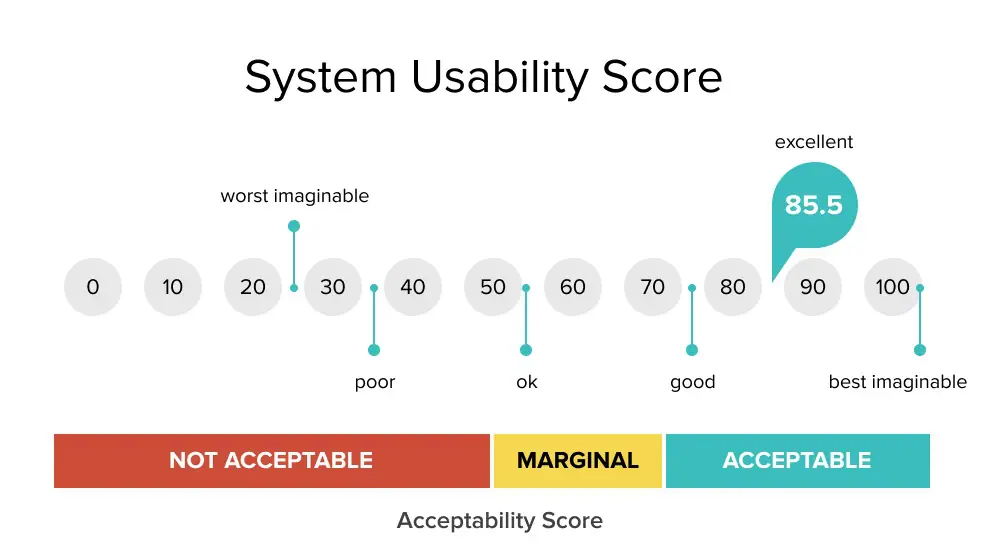
Research into system usability testing has revealed that the average SUS is 68, meaning you can consider a result below this figure to be below average, and vice versa, a score above it means a higher-than-average score.
Unlike some other metrics in this article, this metric won’t tell you exactly where the problems lie, but it will provide you with easy feedback from testers that will help you gauge where you currently stand on usability.
In a previous section, we mentioned that task level satisfaction is closely related to other metrics, particularly completion rate and time on task.
In fact, these metrics are often combined to form a single figure that expresses overall usability: the Single Usability Metric (SUM).
Why those three metrics specifically?
Well, besides the fact that they’re strongly correlated, they also cover all three properties of usability:
Do you see the value in that?
SUM enables you to sum up the results from the three above-mentioned metrics and arrive at a result that expresses the overall usability for a task you’re measuring.
Not only that, but it also allows you to sum up the results of individual tasks to get a usability score for the entire system, meaning you can view it from a micro and macro perspective.
The other reason why this is one of the most useful usability metrics is that it has been studied and standardized at great length, which enables you to benchmark your results very reliably.
In very general terms, a result above 50% is considered good, while everything under that needs improvement.
The way this metric is calculated is rather complex, but the reliability of SUM definitely makes the effort worthwhile.
Here’s the formula:
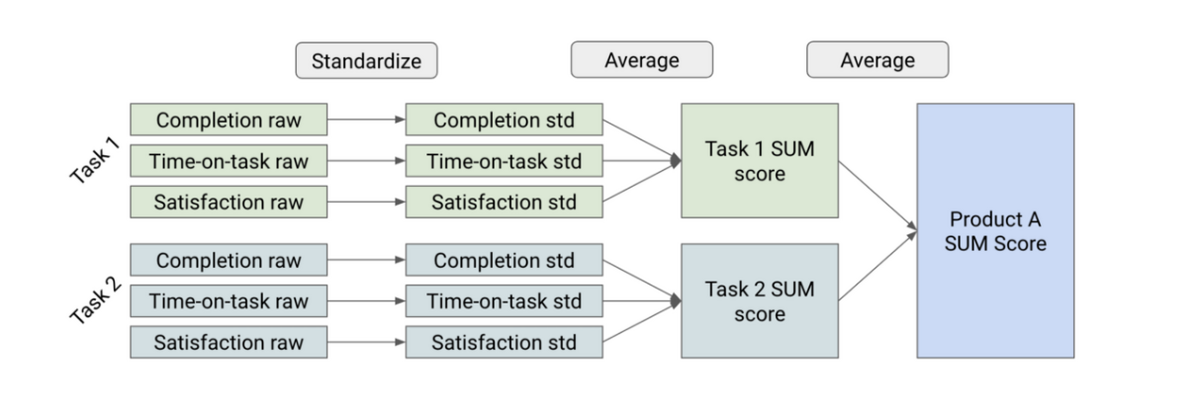
So, you’ll first have to standardize the data you get from individual metrics and then average it to get a SUM score.
The average of SUM scores for all individual tasks results in the SUM score for the whole system.
The single usability metric is probably the most reliable and commonly tracked metric out of this list, so don’t skip it when you’re doing usability testing for your software.
We hope we managed to show you there’s a lot you can measure when doing usability testing for your software product.
Every metric we discussed in this article can provide you with objective information on one or more usability dimensions, so for optimal results, we recommend using a combination of the measurements that best fit the characteristics and intended audience of your product.
Remember, if users have a hard time operating your software or find it too difficult to use, it’s unlikely it will get enough traction.
So give usability testing the attention it deserves and measure it as closely as you can.
From internal bug reporting to production and customer support, our all-in-one SDK gets you all the right clues to fix issues in your mobile app and website.
We love to think it makes CTOs life easier, QA tester’s reports better and dev’s coding faster. If you agree that user feedback is key – Shake is your door lock.
Read more about us here.

Add to app in minutes

Doesn’t affect app speed

GDPR & CCPA compliant

Unexpected things pop up
Just like bugs in your app or web 🐛 Fix them now with just one reporting tool.