
Bug reporting takes time. Here’s how AI helps teams work more efficiently
Debugging is an unavoidable part of the app development process.
No matter how hard you try to avoid bugs, at some point you will encounter them in your code. And when that happens, debugging can help isolate and resolve the problem quickly.
Whether it’s a syntax error, an unexpected result, or another type of bug entirely, debugging is one of the best ways to improve your app’s quality.
In this article, we’re going to cover the nitty-gritty of this process.
If you’ve ever wondered what all these error messages in your code mean or how to fix them, read on.
Table of Contents
The term debugging was coined by computer scientist and Navy admiral Dr. Grace Hopper in 1947, when she and her team were working on one of the first computers ever built.
A moth was found in the machine, causing it to become unresponsive.
After Dr. Hopper and her team removed the moth, they taped it to the log sheet for that day, writing: “First actual case of bug being found.”
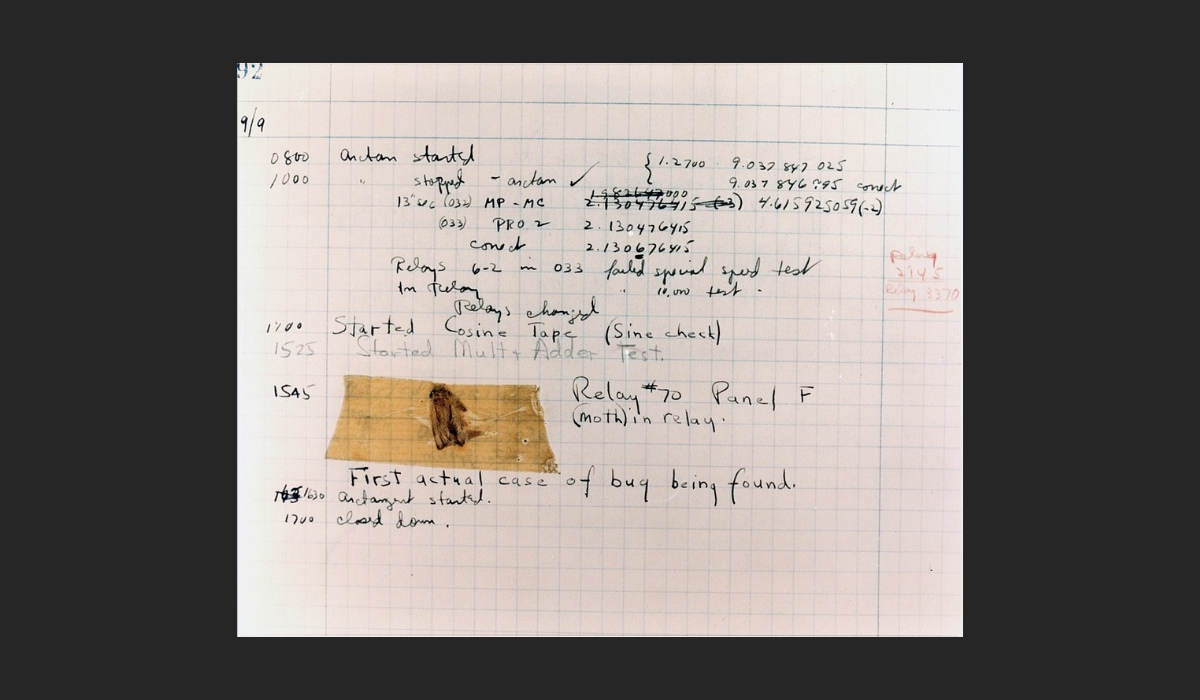
As a result, the term debugging was popularized in computing to describe the process of finding and removing bugs in the code.
However, today’s developers have a different perspective on debugging—they view it as an essential part of the development life cycle that helps ensure quality code.

Get unreal data to fix real issues in your app & web.
They use debugging to investigate issues with their apps and to verify that their code is working as intended.
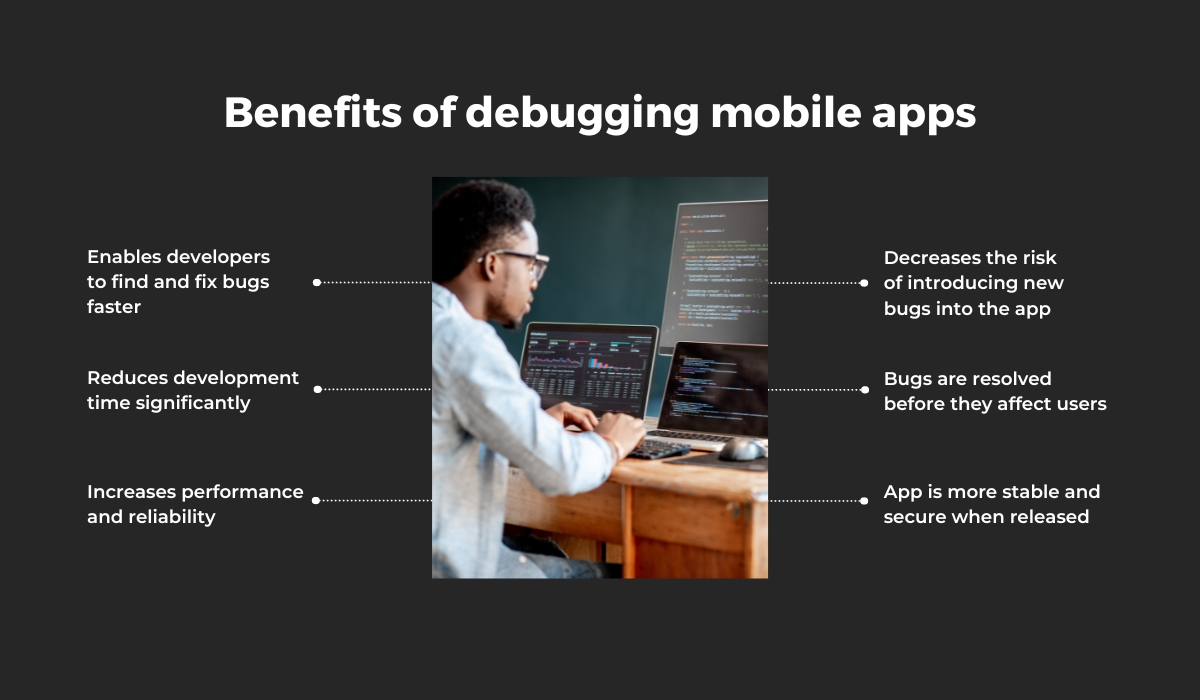
Debugging can range from the simple process of running the app in the debugger (picture below) to more advanced and complex techniques, such as using breakpoints and console logging.
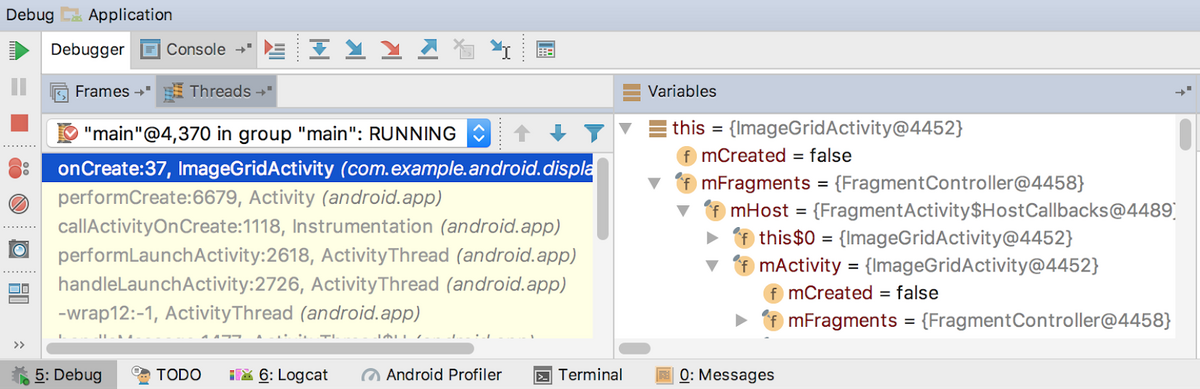
Although this can often be a very time-consuming and tedious process, it’s essential if you want to ensure that your app is stable and performs well for your end users.
In other words, debugging is paramount for any development team who wants to create a reliable, high-quality application.
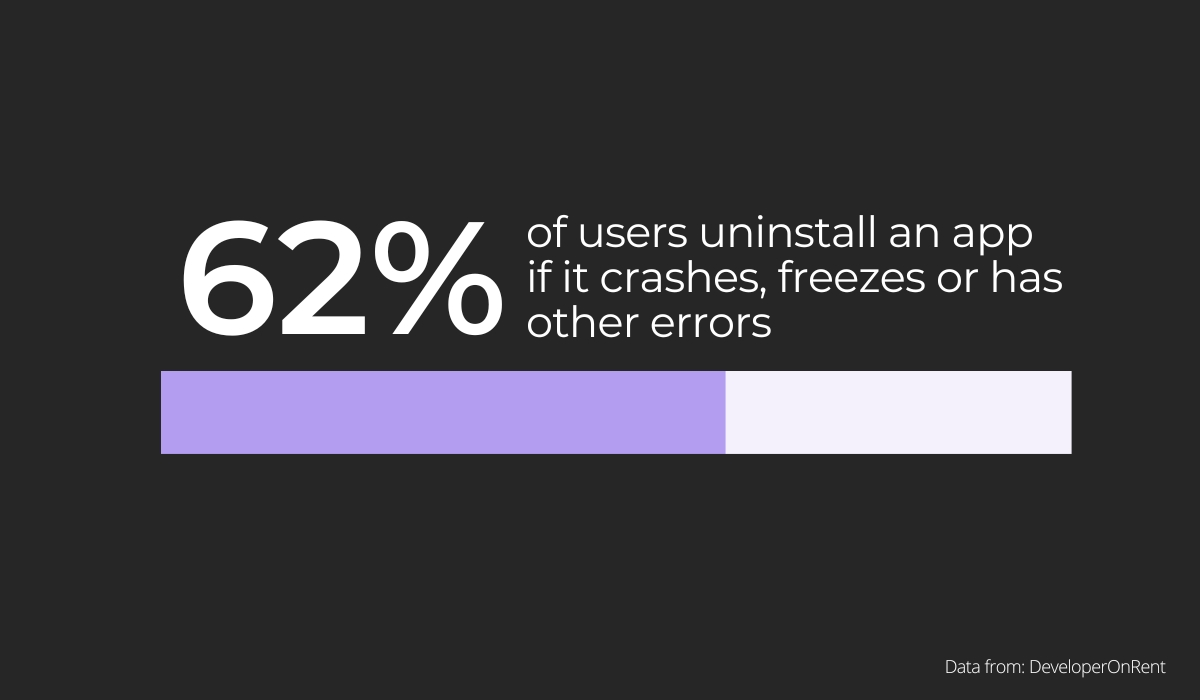
Users want their apps to run smoothly.
In fact, 62% of them will uninstall an app if they experience crashes, frozen screens, or other errors, meaning that debugging can be a deciding factor in whether the app succeeds or not.
You should, therefore, wait until you’ve debugged your app as much as possible, before releasing it to the public.
Otherwise, you’ll have to deal with frustrated users and bad reviews.
There are other important aspects of debugging, too.
For starters, it saves developers a lot of precious time.
According to Rollbar, 26% of developers report that they spend as much as half of their time fixing bugs.
With debugging tools in place, bugs and errors are usually immediately identified so there is little to no need to search for them manually.
Errors are reported in an orderly and structured manner, making it easier for developers to troubleshoot.
Additionally, fixing bugs as soon as they’re identified makes it easier to maintain and write future code, which facilitates development.
As you can imagine, this approach, when implemented consistently and properly, can significantly increase productivity.
And while debugging may not be the most exciting part of a developer’s job, it can make all the difference in how smoothly the app runs once it’s in production.
While it’s important to know how to debug code, understanding what kinds of bugs are the most frequent and how to find them is equally essential.
That’s why we’re now going to take a look at some of the most common bugs that can be found during debugging, and how you can identify them.
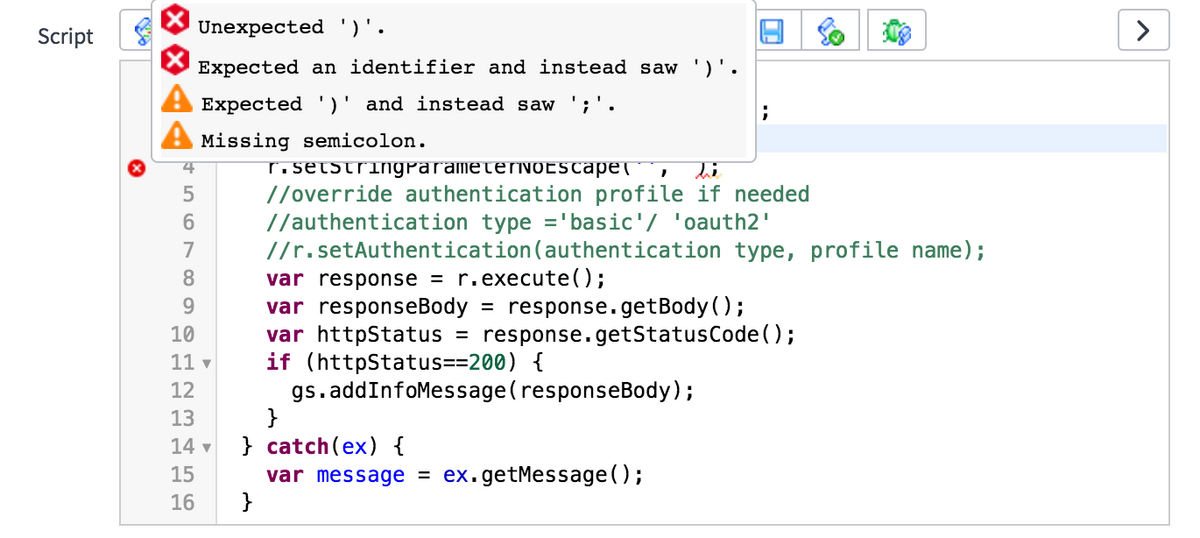
First off, let’s start with syntax errors, as they’re the most basic errors you can make.
As the name suggests, they occur due to a problem with the code’s syntax, which can be caused by misspelled words, missing punctuation, or incorrect use of parentheses or brackets.
You can usually find these errors by looking through your code for any red lines, squiggly underlines, or other warnings, as you can see in the image below.
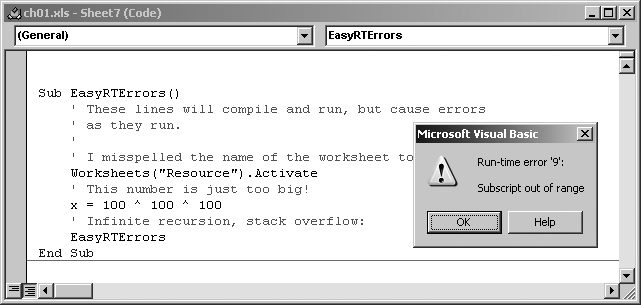
Another common category of bugs includes runtime errors, which occur when the code runs but produces an error message.
These errors often stem from various causes, including a missing file, invalid input, or incorrect data structures.
Runtime errors are easy to spot because they usually result in a dialog box that contains an error message, like the one below.
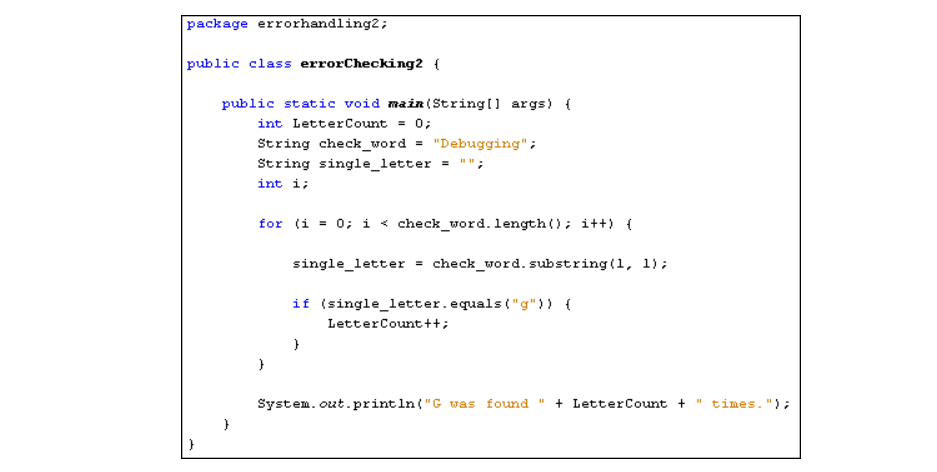
Logical errors represent the third kind of bug. They’re the hardest to find because they are not automatically flagged in your code or at runtime.
These mistakes can be incredibly subtle, like a line of code that doesn’t do what you think it should but doesn’t throw an error either.
They often occur when a program produces an unexpected result while running, one that doesn’t match the inputs—for example, when you ask it to add two numbers together and it gives you a different answer than you expected.
On the other hand, linker errors are a bit easier to find. They’re typically caused by missing files or libraries, which can be identified and resolved with a quick search.
These are just some of the most typical errors you’ll see when developing.
By understanding the nature of these errors and how to resolve them, debugging and troubleshooting will become much more straightforward.
There are many different approaches to debugging, but they usually involve following a few steps.
In the first step, the bug is identified.
This is important because it’ll help you narrow down the cause of a problem and prevent you from making assumptions that could lead you in the wrong direction.
The next step is to pinpoint where the bug happens by watching for unexpected behavior in different parts of the application.
This means taking a closer look at the code—preferably using some sort of debugging tool.
After that, you should analyze the bug, preferably with a bottom-up approach where you start from its location and work your way up to the root cause.
This will help you identify how the error happened, as well as why it occurred.
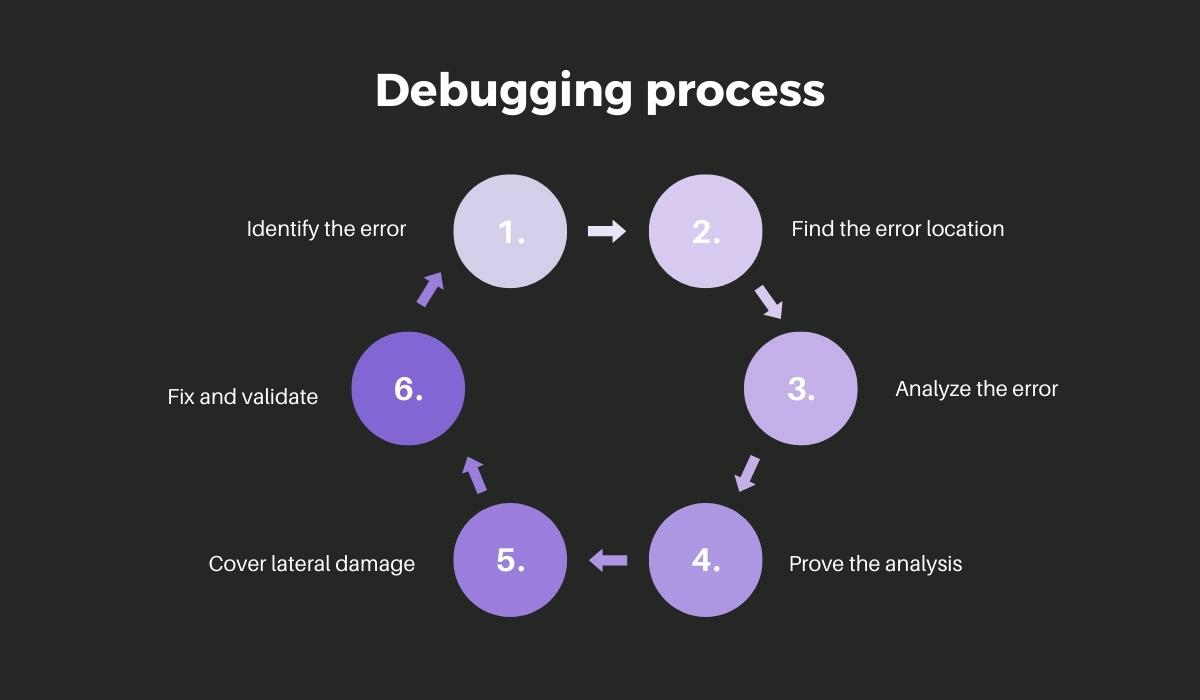
Next, you need to prove that your analysis is correct by looking for more errors.
To do so, you should write automated tests to check these areas using a special test framework.
After that, it’s time to cover lateral damage, meaning you should perform unit testing of all code where you made the changes.
If all of those tests pass, then it’s time to move on to the final stage. Otherwise, you’ll need to resolve any failing test cases before moving on.
The final step of the debugging process is to fix any errors and bugs and validate your solutions by testing them through test scripts.
As you can see, the process includes a lot of steps.
The key is to be methodical and to apply the same steps to all stages of the development cycle until as many bugs as possible have been removed.
When debugging an app, there are several strategies you can use to track down the source of a bug.
Some of them are more applicable than others, depending on the nature of the bug, but it’s good to be familiar with all of them so you can choose the best one for each situation.
Let’s start with one of the most common strategies called backtracking.
This is a technique where you start from the point at which the bug occurred, and work backwards through the code to see what triggered the error.
This strategy may take several trial-and-error attempts to pinpoint the bug’s source, but it’s still a reliable and easy way to diagnose and fix errors.
The cause elimination method is similar to backtracking, but instead of working backward through the code, you work forwards.
This means that instead of trying to determine what triggered a bug, you try to come up with hypotheses about what may have caused it.
The downside of this approach, though, is that the hypotheses won’t always lead to the correct solution, as principal consultant Wisen Tanasa points out in his tweet.
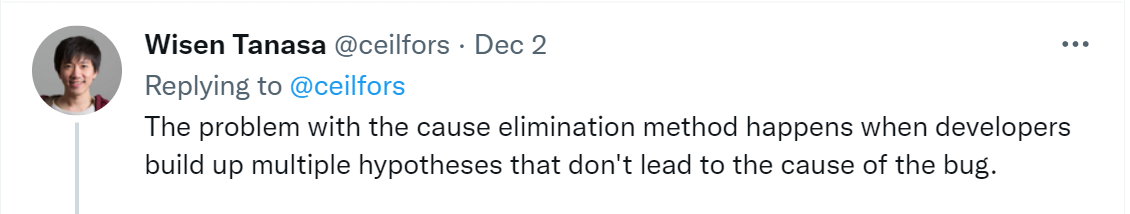
This basically means that you could spend a lot of time and effort on a wild goose chase.
In that case, you might be able to yield better results by chatting to a rubber duck.
Rubber duck debugging is a method of debugging where you explain your problem to an inanimate object.
You may think this sounds silly, but it can be very effective in helping you solve difficult issues in the code.
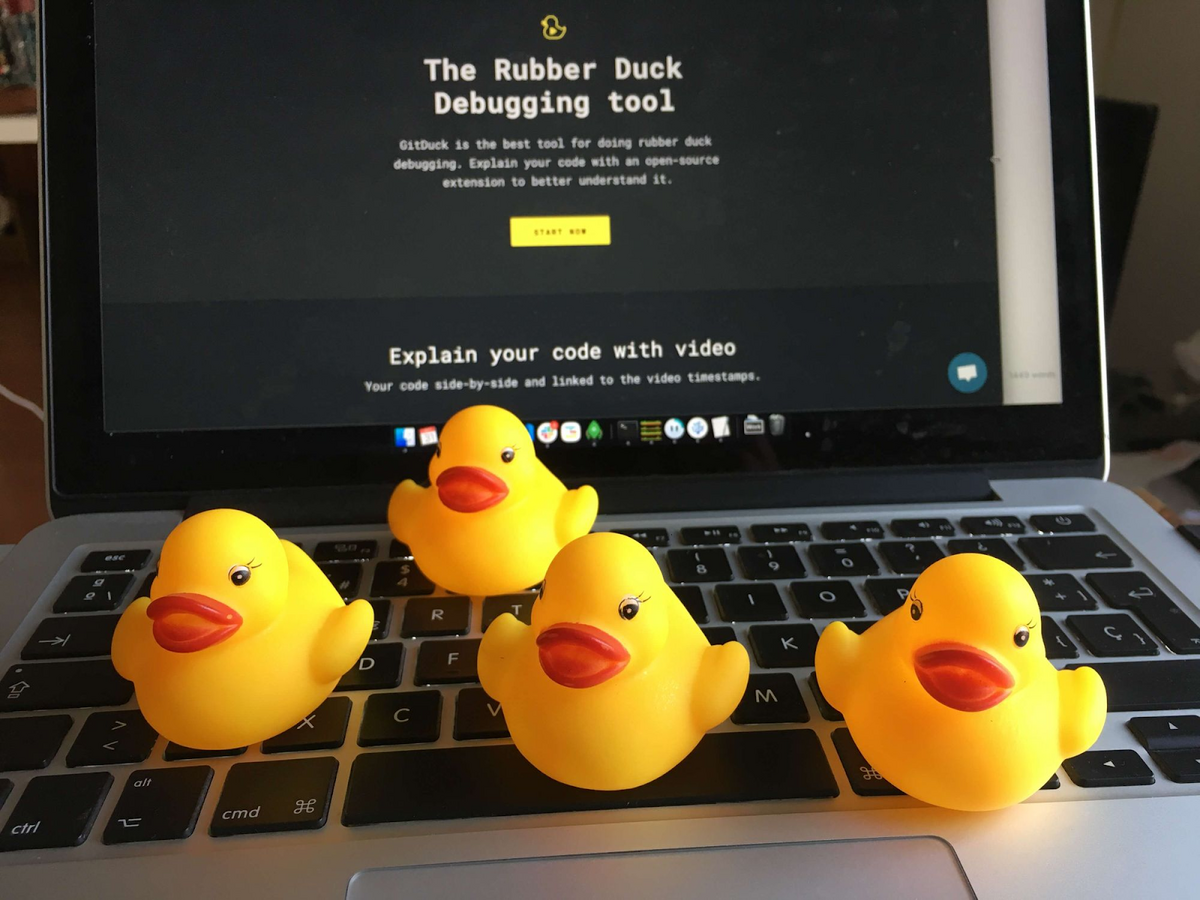
The idea is that when you talk about your problem out loud, it becomes easier for your mind to process the information and come up with solutions.
Still, if you find it difficult to relate to an inanimate object, consider a similar strategy known as pair debugging.
In this approach, developers take turns explaining code to each other line-by-line.
This can be really effective, especially if one of the developers is an expert in the field and can help guide the other through the problem.
As you can see, all these strategies are designed to walk you through the bugs in the code and help you find a solution.
While some of them may not work in every situation, they can still be very helpful in getting you out of a coding jam.
If you want your debugging process to be truly successful and time-efficient, you’ll want to have the right debugging tools in your toolbox.
For instance, Low-Level Debugger (LLDB) is a powerful debugger that lets you inspect the state of your code at any point in time.
It’s built into the Xcode IDE and allows you to see inside the app while it’s running, helping you track down errors and find out what’s happening in your code during runtime.
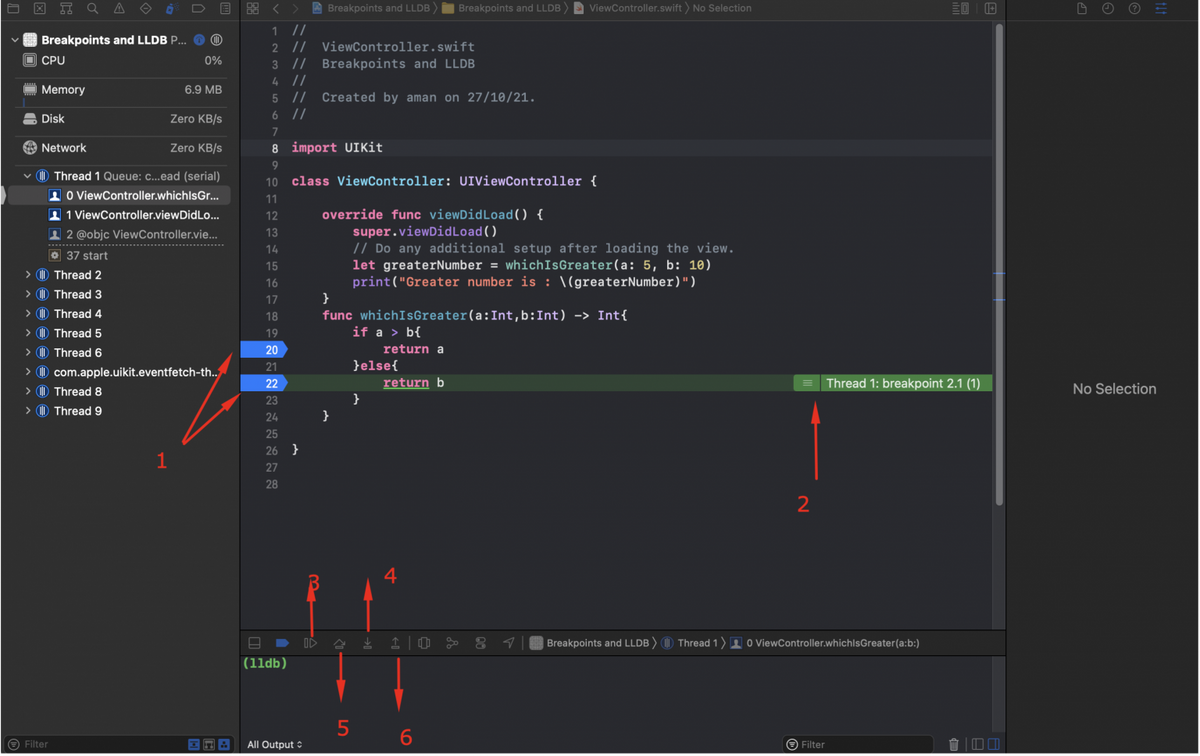
As the picture above shows, it also offers some neat features like breakpoints that let you pause your debug session at specific lines of code so you can examine variables, change them on the fly and watch how they affect the app.
GDB (The GNU Project Debugger) is another great tool that is worth having in your debugging arsenal.
It’s a command line debugger, which means you have to type commands into a terminal window to use it.
It’s got some pretty powerful features for advanced users, but it might not be the best choice for beginners.
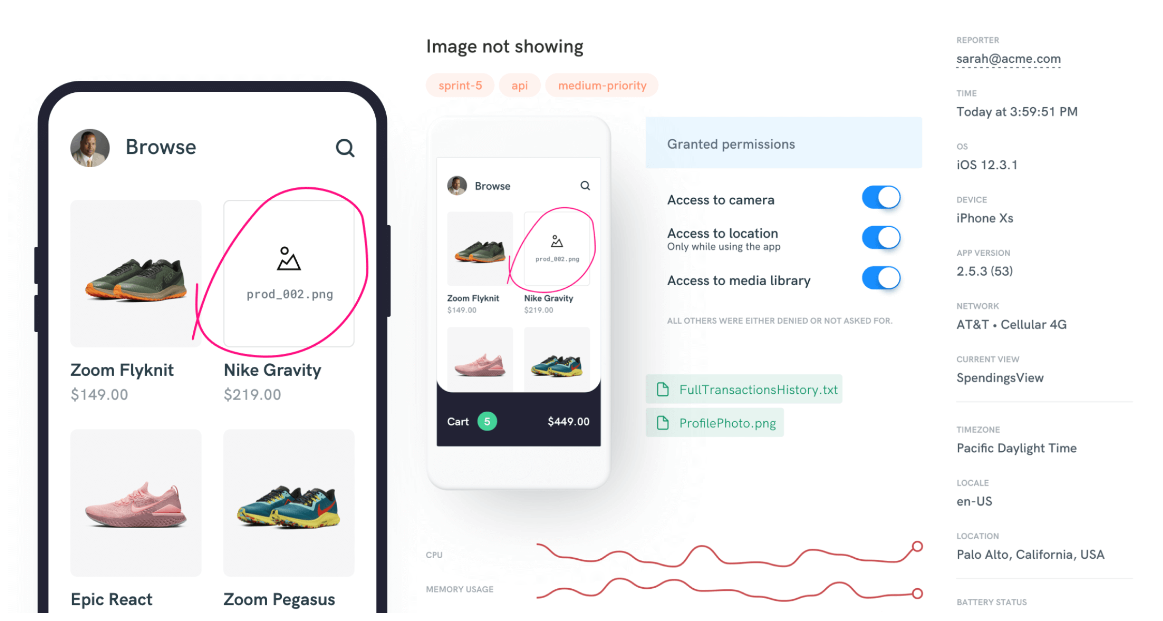
Another excellent option for your debugging efforts is our very own tool, Shake.
In a nutshell, it’s an SDK for iOS and Android that comes with a dashboard to track app performance, record screen activity, report bugs and crashes, and generate reports.
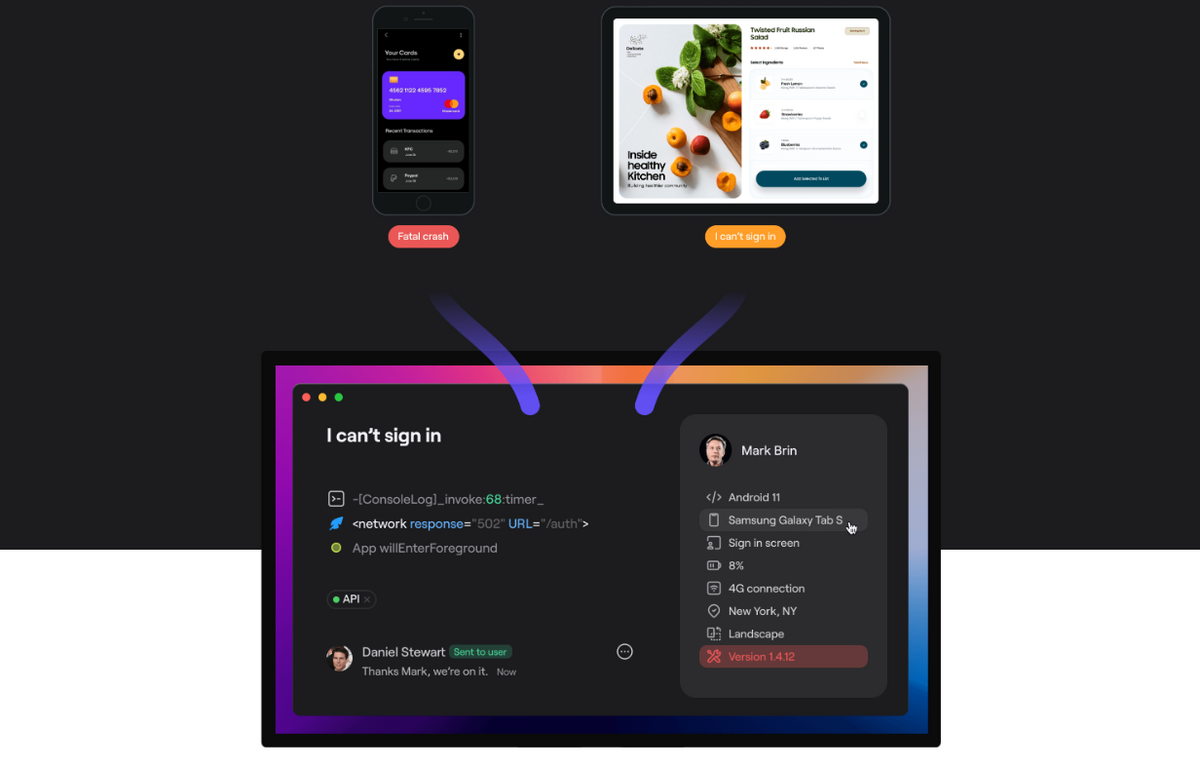
When users or testers spot the bug, all they have to do is shake the phone, and the tool will automatically detect it and report it to the dashboard along with all the relevant information.
Although Shake is not a debugger per se, the detailed reports it generates can come in handy when you’re looking for issues that are hard to find.
There are many other tools on the market that you can use to debug your mobile application.
Some of them are free, while others require a subscription.
The common thread among them, however, is that they make debugging far easier and more efficient, which means you can spend less time debugging and more time developing.
Debugging is often thought of as a last resort when you can’t figure out what’s wrong with the code, but it’s actually an essential part of any development process.
It not only allows you to take an in-depth look at your code and find the cause of errors, but it’s also a great method to improve the quality of your app and make sure it works as you intended.
In this article, we laid out the basic principles of debugging, showed you some of the most common debugging strategies, and highlighted some tools that can make the whole process a lot easier.
Hopefully, you were able to glean a few nuggets of wisdom from it that you can use in your next debugging session.
From internal bug reporting to production and customer support, our all-in-one SDK gets you all the right clues to fix issues in your mobile app and website.
We love to think it makes CTOs life easier, QA tester’s reports better and dev’s coding faster. If you agree that user feedback is key – Shake is your door lock.
Read more about us here.

Add to app in minutes

Doesn’t affect app speed

GDPR & CCPA compliant

Unexpected things pop up
Just like bugs in your app or web 🐛 Fix them now with just one reporting tool.