
Bug reporting takes time. Here’s how AI helps teams work more efficiently
Bugs are an inevitable part of software development.
They can range from mildly annoying to severe enough to make your software product virtually unusable.
Wherever they land on that spectrum, fixing them is a big part of a software developer’s responsibilities.
In this article, we’ll examine what debugging is, how to do it, and what methods you can use to end up with clean and working code.
Let’s get started!
Table of Contents
Debugging is so ingrained in the software development process that it’s basically unthinkable to construct a productive workflow without it.
For such an important concept, it’s essential that we first understand what it is.
Here’s how Rocío Belfiore, Chief Innovation Officer at BairesDev, defines it:
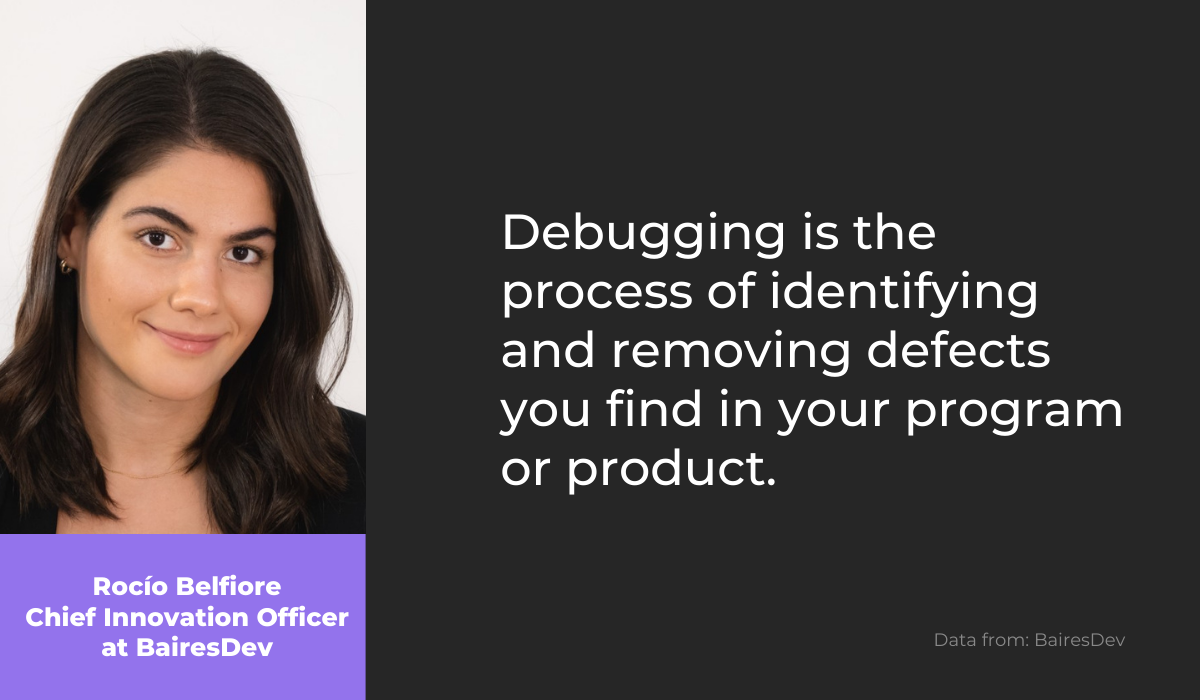
In other words, debugging can fix errors in your code, making it a vital process if you want to succeed in creating a high-quality product.
The definition above implies another reason why debugging is crucial.

Get unreal data to fix real issues in your app & web.
Even the simplest software product contains so many lines of code that it’s essentially impossible to ensure that every one of them is perfect, regardless of the developer’s level of skill.
And in light of those potential errors, it can also be difficult to predict how those lines will interact with one another.
For instance, in his book Code Complete, Steve McConnell writes that the industry average is 15 to 50 errors per 1000 lines of code.
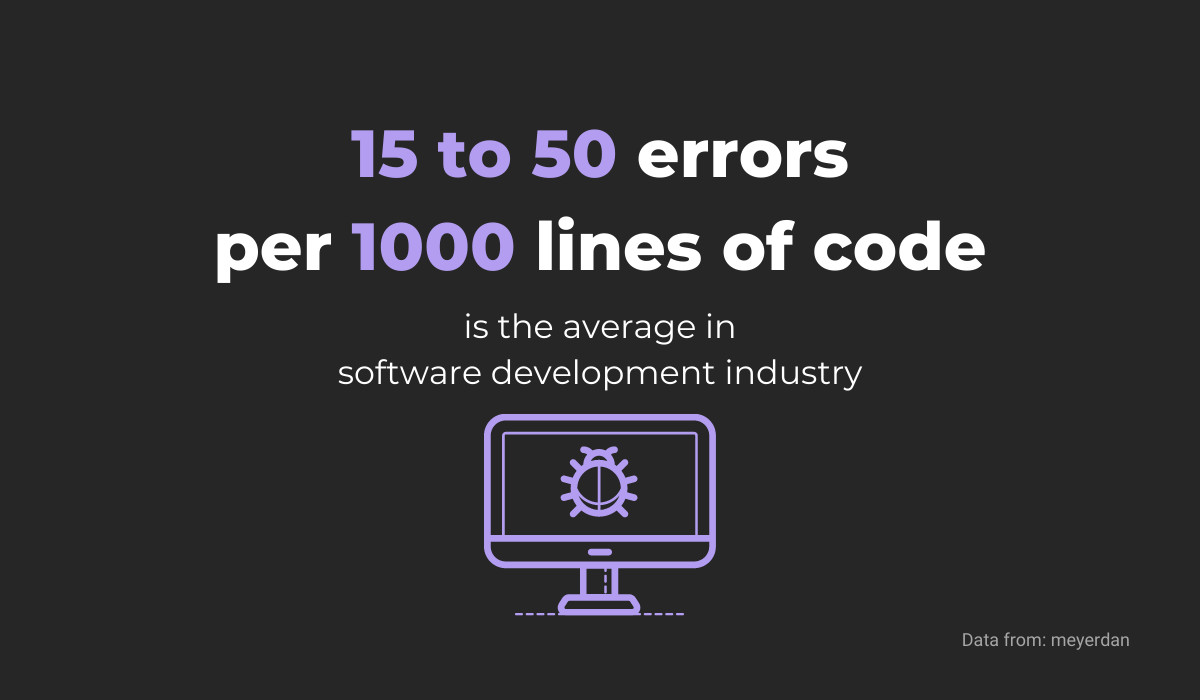
In short, the point is that defects and bugs in the code are inevitable.
And since bugs are inevitable, debugging is essential if you want to find and resolve problems that can compromise your software product, impact its quality, and affect user satisfaction.
To sum up, producing error-free software isn’t a realistic prospect, but there are ways to minimize bug occurrences.
Debugging is a key piece of the puzzle that needs to fit right into your work process if you want to achieve success.
After we’ve established what debugging is, it’s time to see what strategies you can use to conduct it successfully.
There are a lot of methods available, and your choice will depend on various factors, including the tools you have, the skills you possess, or simply your personal preference, to name a few.
Let’s explore some of the most common ones.
This method of debugging is frequently used, despite being rather inefficient.
It’s a straightforward strategy where developers go through each possibility manually until they find a solution.
For instance, take a look at the example below:
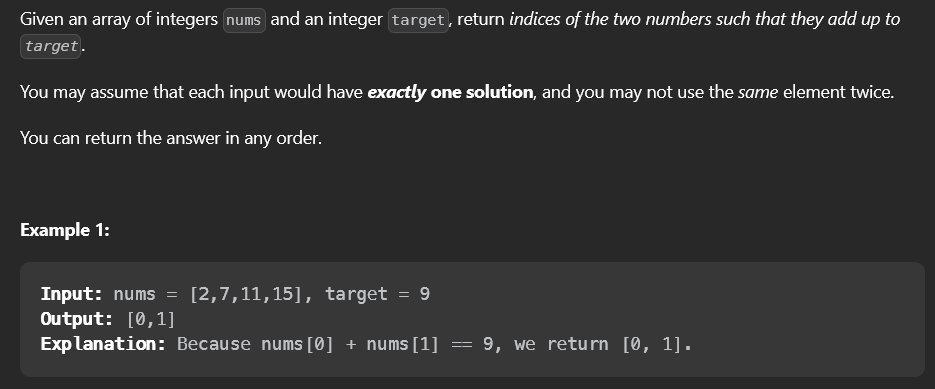
A developer needs to find two numbers that add up to the target.
The brute force method can be useful here because it would allow you to go through the elements one by one until you find the solution. It’s also the least mentally taxing strategy.
On the other hand, the most glaring problem with this method is that it could take a long time to find a bug if there are many lines of code to go through.
Shotgun debugging is another debugging strategy that isn’t known for being methodical and specific.
It involves making changes in the code at random, in the hopes of hitting on the solution and eliminating the problem.
It’s a trial-and-error approach to debugging, which can be successful, but it can just as easily take a lot of time without producing desired results.
However, as software developer John Spacey points out, even skilled programmers sometimes resort to shotgun debugging.
It is often faster to redesign and reimplement a section of code than to fix a difficult-to-reproduce bug.
In other words, it can be useful in situations where you know approximately where the bug is in the code, and the more precise methods would take too much effort and resources.
Have you ever tried to explain a problem to someone who knows nothing about it, and suddenly saw the solution that has been there all along? That’s what rubber duck debugging is all about.
With this strategy, developers explain the problem in the code either to an inanimate object like a rubber duck, or simply to a person willing to listen.
The idea is that articulating the issue out loud helps developers look at it from a fresh perspective, which often leads to a breakthrough.
For example, Simon Høiberg, an experienced senior engineer, is a big fan of rubber duck debugging.
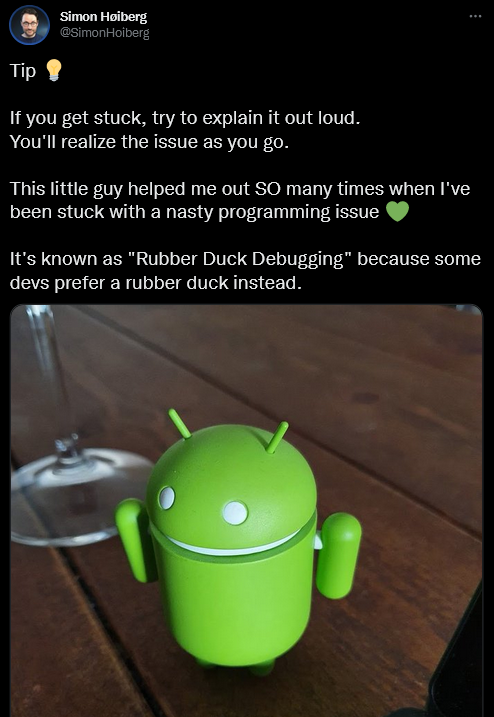
As you can see, you don’t need an actual rubber duck for this strategy.
Anything or anyone can act as a listener and encourage you to break the problem into simple terms—and get out of your own head.
This debugging strategy is much more systematic and structured than brute force or shotgun methods.
Cause elimination encourages you to think about the code you have and the problems you’re facing, so that you know what to look for before you start.
If you do that process as intended, you’ll have some ideas and hypotheses about what might be causing the defects you’re dealing with.
Then, you can use tests to eliminate or confirm the possible causes of the problems in the code.
The whole process looks something like this:
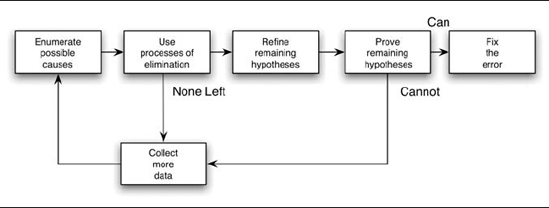
As you can see, when you have your possible causes, you can use the process of elimination to narrow them down, then refine the remaining hypotheses (if they are any).
Finally, proving those hypotheses confirms what the issue is, so that you can fix it.
If you can’t prove any of them, you collect more data and start over.
Backtracking is another common debugging strategy that can produce beneficial results.
The concept is simple.
A developer should pinpoint where the software started to behave as it shouldn’t have—in other words, where the problems became apparent.
Then, they go back through the code until they find the exact point where the problem originated.
In essence, backtracking is going in reverse through the code until you find a point at which something has started to go wrong.
Here’s how the authors of The Art of Software Testing explain it:
With this process, you’re looking for the location in the program between the point where the state of the program was what was expected and the first point where the state of the program was what was not expected.
When you backtrack to that location, you can identify the exact issue more easily.
This debugging strategy aims to find the bug in the least amount of time and spare developers from wasting time combing through the code.
How does it work? By determining the area in the code where the bug should be and narrowing the search down until a developer can find it.
For example, take a look at the array below.
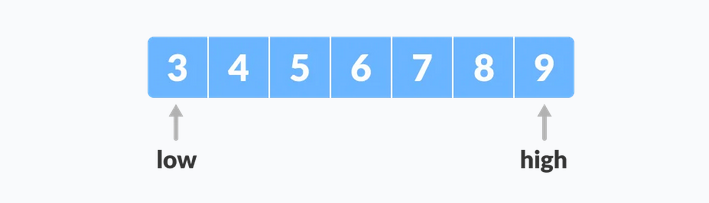
It represents the section of the code where the problem occurs.
With binary searching, you should find the middle point and then, for example, segment the code lines on the right. If the problem is still there, you know it’s somewhere on the left.
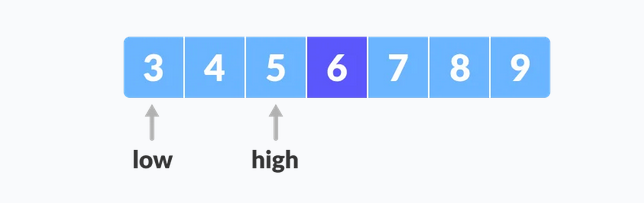
When you determine that, you segment the code further and further until you zero in on the bug.
The last strategy we’ll examine here is static code analysis.
This method is different from most other popular debugging practices because it checks the code for errors at a different point in the process.
What do we mean by that?
As Richard Bellairs, a product marketing specialist and software engineer, explains it:
Static analysis identifies defects before you run a program (e.g., between coding and unit testing).
So, with static code analysis, you don’t have to wait for the software to crash to start looking for bugs.
You can apply a specific set of rules that help you evaluate the code (if you’re doing this manually), or use automatic tools that analyze the code without running it.
Either way, static code analysis helps detect the issues early in the development process, saving time, effort, and resources down the line.
Debugging your code is a process that you should approach systematically to ensure the best results.
As we mentioned, you can use an array of strategies for debugging, but there are also some common steps in the debugging process that you shouldn’t overlook.
Let’s discuss what those are.
The first step you should take in debugging your code is to ensure that the bug is actually a bug.
What does that mean? Well, a bug most likely won’t manifest only once.
It’s a fault, a defect in the code, and every time a program runs a part of the code the bug is in, the same unwanted result will manifest.
Therefore, you should be able to reproduce the bug to find out the nature of the problem and debug it efficiently.
As John Sonmez, founder of Simple Programmer and a developer in his own right, puts it, if you can’t reproduce a bug, you can’t debug it.
To reproduce the bug, a developer should have as much data as possible about the issue that occurred.
That’s why Shake is a great tool. Shake automatically creates detailed reports about the bugs and crashes, containing everything a developer needs to replicate a bug.
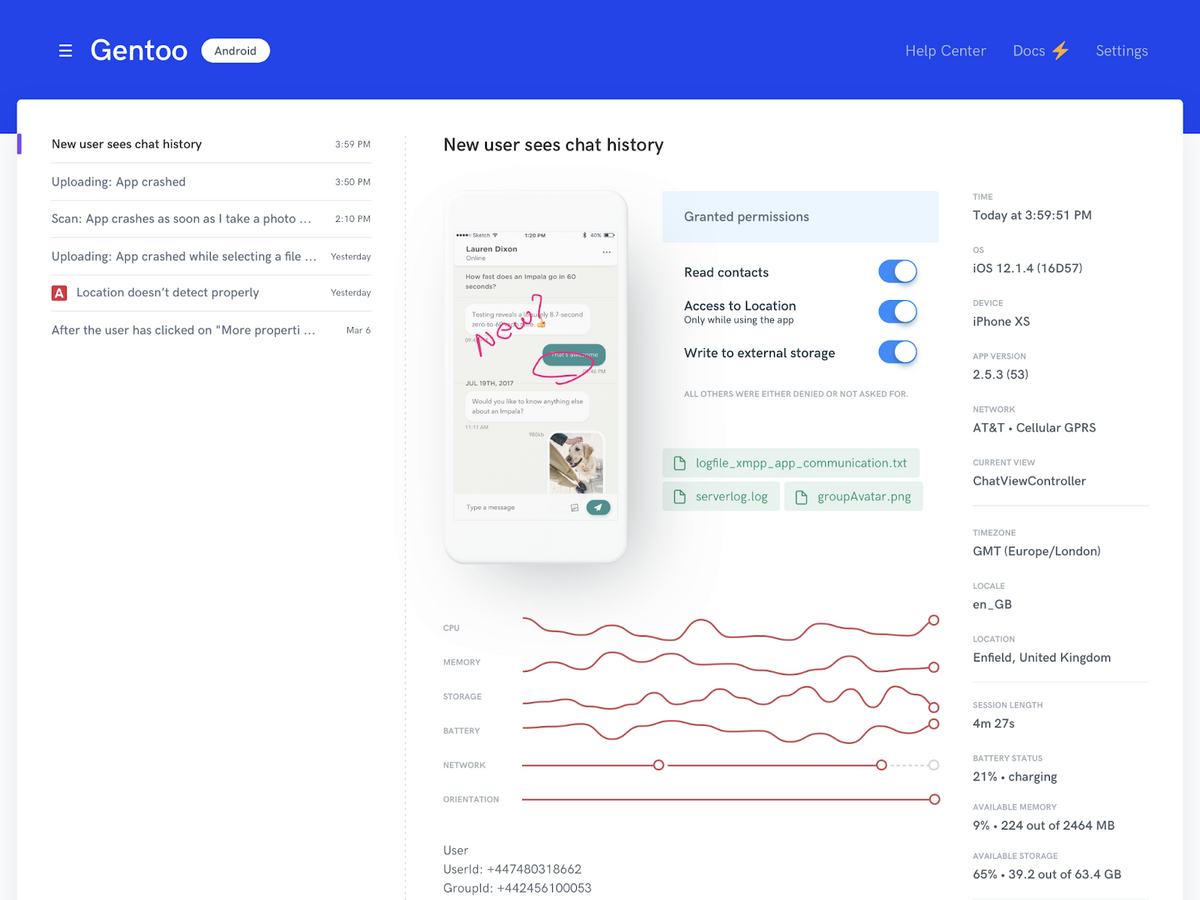
That way, a developer can see how the bug occurred and everything that led to it, which is crucial for fixing it efficiently.
Software development is a challenging process that requires a lot of skill, creativity, and mental acuity. All of that is also needed when things don’t go as planned.
So, when a developer establishes there’s a bug in the code, they should think about what causes it and how to resolve it.
A very helpful practice is coming up with some hypotheses or ideas and testing them to see if they are on the right track.
For testing your hypotheses, it’s best to use unit tests. They are used on small pieces of code to determine if those code snippets are causing problems.
You can use various tools to help you write and execute unit tests, depending on your needs, your programming language, etc.
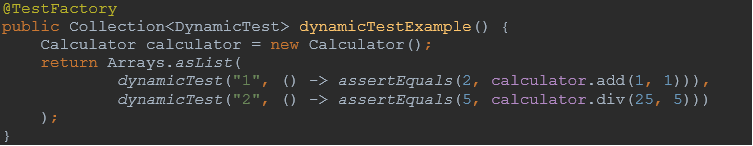
For instance, JUnit is frequently used for testing code in Java. It has many features, including dynamic testing they added in the latest version.
To sum up, developing and testing your hypotheses can get you closer to resolving the bug, and consequently increasing the quality of your code and your final product.
When you know there’s a bug in your code, you know that it causes problems. What is not often apparent is which segment or line of code is problematic.
Isolating it can be a time-consuming process. However, segmenting your code into smaller pieces and analyzing it is an effective way to locate the issue.
We’ve already mentioned binary searching as one of the strategies suited specifically for pinpointing the place in the code where the problem is.
If you opt for that method, you can remove or comment out code line by line when you get to the smaller pieces of code.
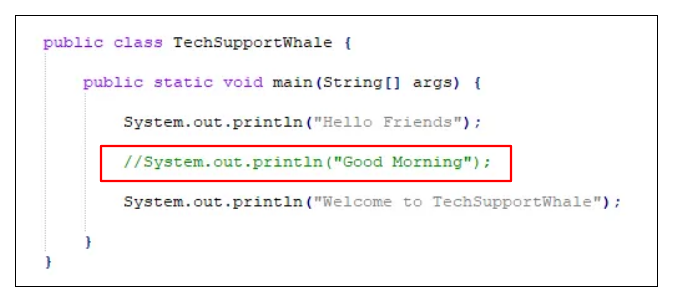
As you can see above, in Java, for example, you can put two slashes in front of the line, and it won’t run.
That way, you can eliminate code lines one by one and eventually find and fix the bug.
If none of the strategies and practices we’ve mentioned so far produce results you’re satisfied with, you have another ace up your sleeve—a debugger.
Debuggers are tools usually built into IDEs (integrated development environment) where developers write the code, but they also come as separate software tools.
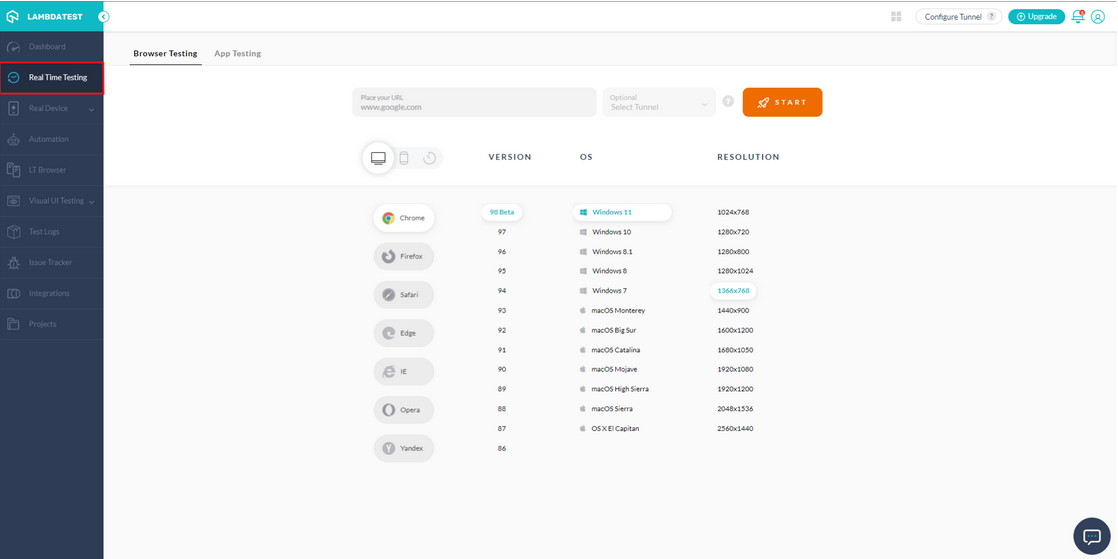
For example, LambdaTest developed a popular debugger that you can use for debugging in real time, inside various web browsers.
Debuggers have a particularly useful feature of inserting breakpoints in the code.
When a debugger reaches a breakpoint, it stops running the code, so a developer can then examine the code between breakpoints line by line to see where the problem is.
In other words, you can pause a program to examine the issues and review the code in detail.
That makes debuggers powerful and valuable tools for developers, especially when in-depth code examination is required.
Debugging is one of those tasks which very few software developers look forward to.
It’s easy to see why. Developers work tirelessly on writing code to make a high-quality software product, just to see the execution crumbling down because of some error that can be anywhere.
However, there are strategies and efficient ways of debugging, as we’ve shown you in this article.
We hope that by implementing them, debugging will become less of a chore.
From internal bug reporting to production and customer support, our all-in-one SDK gets you all the right clues to fix issues in your mobile app and website.
We love to think it makes CTOs life easier, QA tester’s reports better and dev’s coding faster. If you agree that user feedback is key – Shake is your door lock.
Read more about us here.

Add to app in minutes

Doesn’t affect app speed

GDPR & CCPA compliant

Unexpected things pop up
Just like bugs in your app or web 🐛 Fix them now with just one reporting tool.