Recommended
A full guide to app logging

App logging has always been the cornerstone of successful debugging, troubleshooting, and optimizing apps.
Let’s say you receive a ticket from a user who has encountered difficulty with your application.
In this case, log entries become your trusted accomplice, providing you with a trail of breadcrumbs that lead you straight to the heart of the problem.
Yet, as applications become more intricate and the log history expands to a great extent, the need arises for adopting robust strategies that will facilitate the logging process.
That is precisely why we’ve set our sights on four tried and true practices that will help you unlock the true potential of your logging even when dealing with complex apps.
Table of Contents
In software development, events are the key to your application’s analytics, so it’s essential to be aware of which ones you should log in order to obtain the most meaningful data.
But before we roll up our sleeves and dive into the nitty-gritty of event logging, let’s establish some fundamental definitions to better clarify the matter at hand.
Let’s kick things off by pinning down the notion of an event.
An event, in its simplest form, denotes any significant action, occurrence, or change in the state of the software system.
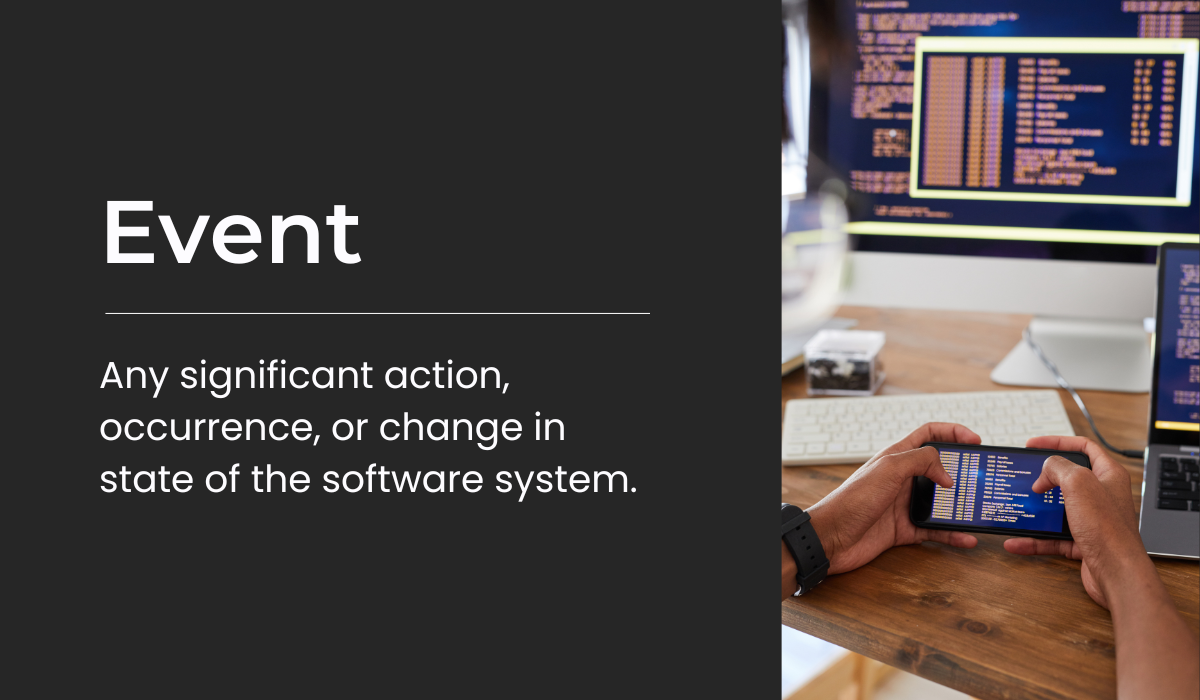
To put it in plain English, events are anything that happens in your app that is worth tracking.
For instance, when a user signs up for your app, that’s an event worth noting.
Likewise, when a user makes a purchase, that too falls into the event category.
While these latter examples are propelled by user actions, events can also take the form of internal occurrences like a database update or an HTTP request that returns a 404 status code.
Here is an overview of log events in action:
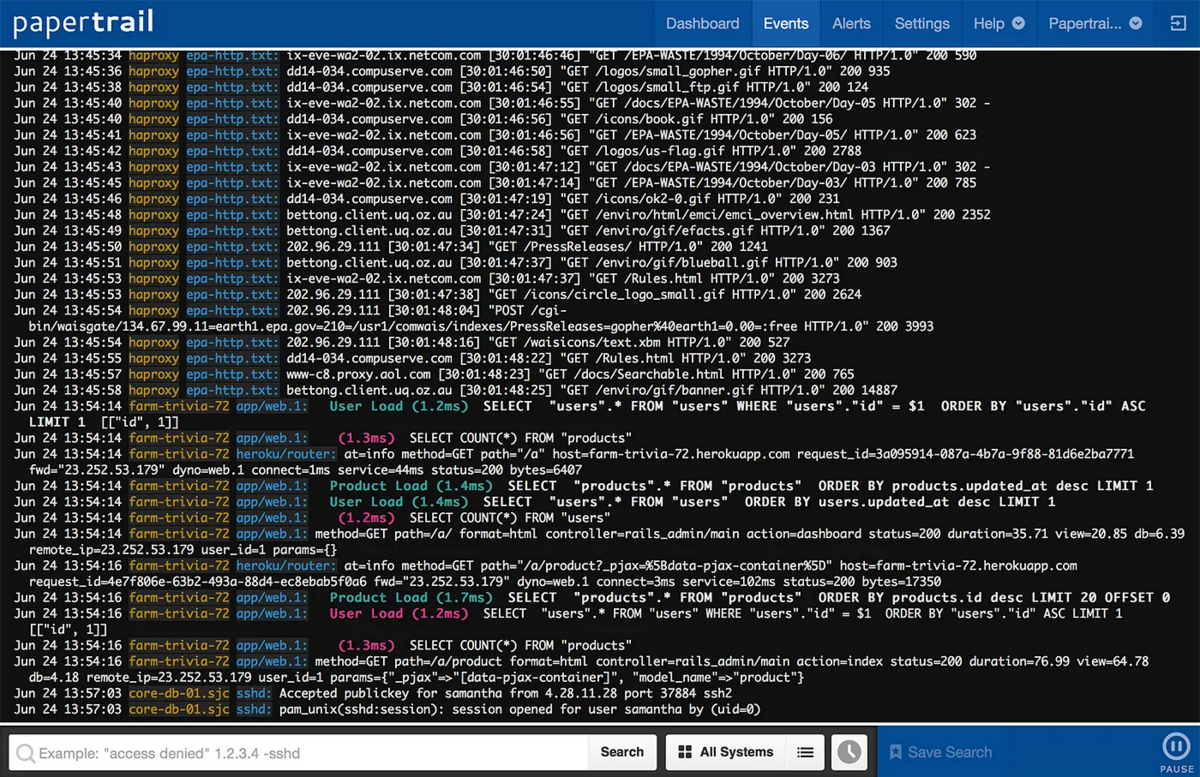
However, an event by itself holds little value for developers and system administrators unless it’s appropriately logged.
Logging events is paramount because it allows you to record activities that occurred, keep tabs on how your application is being used, and uncover areas in need of refinement.
You may already have a few events swirling in your mind that you wish to log.
But let’s delve into the five most common categories of events that deserve your attention:
At the top of the list, we have authentication, authorization, and access events.
In this category, you can log events that occur, for instance, whenever users attempt to log in or out of the app, as well as when they access different parts of the app (e.g., create an account).
The goal here is to capture any events linked to users accessing the application, irrespective of whether they’re successful or not, as shown below.
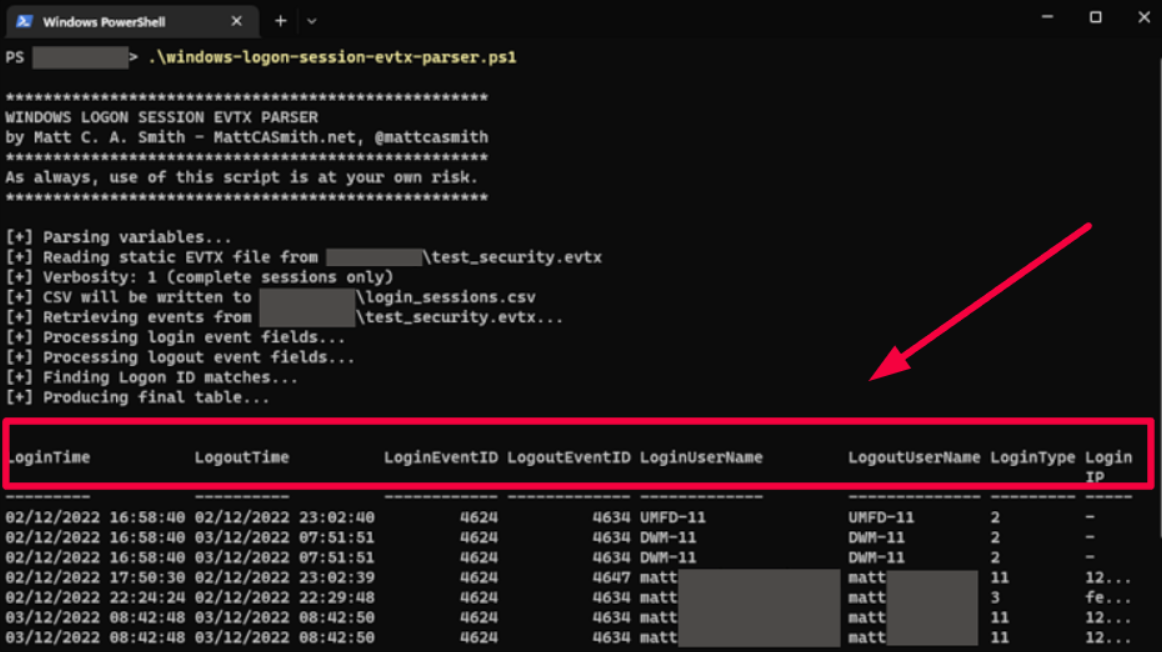
This information can prove invaluable when debugging specific user accounts or analyzing authentication processes.
Next up is the change events category. This one entails both changes made to users’ accounts and to the app itself.
This encompasses not only creating, modifying, updating, or deleting data but also making configuration changes to the software, such as adding new features or tweaking existing ones.
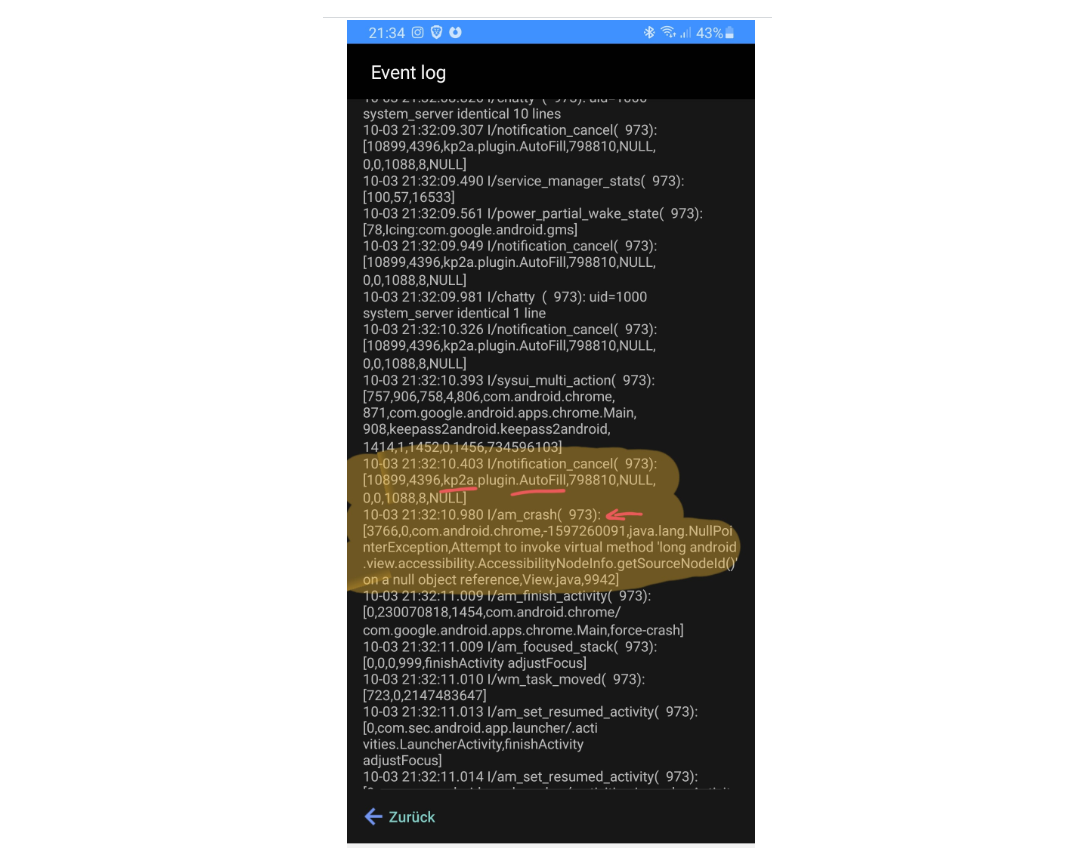
Moving on, availability events grant you a window into the health of your application.
By logging them, you can glean insights into how frequently your application experiences downtime and what triggers those disruptions.
These events also help identify persistent issues, such as server crashes or memory leaks, while also enabling an assessment of the impact on users.
In the image below, you can see what an event log of a crash might look like, provided by a Stack Overflow user.
Resource events include resource exhaustion, capacity limitations, and connectivity problems.
By logging these events, you gain visibility into the utilization of your resources and the potential bottlenecks that may arise.
Lastly, let’s not forget the most pressing category of events—threats.
They can include attacks, hacks, or any other event that poses a threat to the security of an application.
By logging these events, you can swiftly detect and respond to security breaches, fortifying your application against potential vulnerabilities.
As you can see, events may be tracked for a multitude of reasons, but you should discern and track only those events that are relevant to your business objectives.
How would you feel if, when faced with the urgent task of eliminating pesky bugs from your app, you delved into the labyrinthine depths of your event logs, only to find a chaotic mess?
Each log entry is recorded differently, and you are clueless about where the issue occurred, when, or how.
To decipher this tangled web of data and get to the bottom of an issue, you should possess advanced detective skills.
Undoubtedly, this situation sounds annoying, doesn’t it?
But there is a smart way to sidestep this quagmire–create a standardized structure that harmonizes all entries in your logs.
There are certain fields that have become golden standards when it comes to logging entries, and they include:
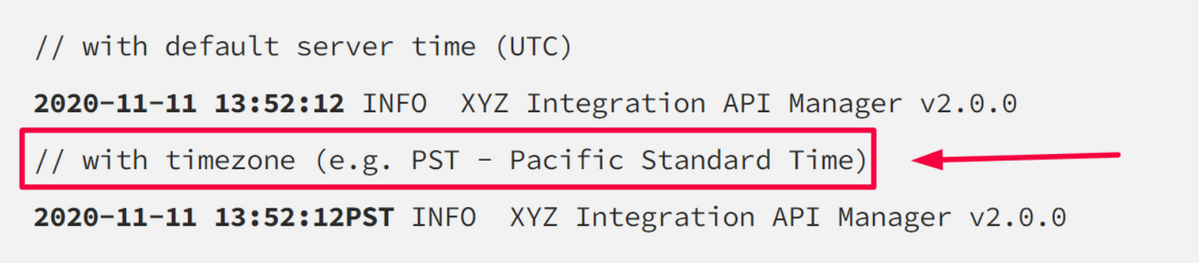
Considering the current circumstances, where many developers work remotely or in hybrid work arrangements, make sure your timestamp format includes information about time zones too.
Other important values you can add to your log entries can relate to the environment in which the event occurred, such as the application version, deployment name, etc.
But if you truly want a structure that is intuitive, universally comprehensible, and functional, don’t forget to assign a unique ID to each entry.
This will be of great help when you need to use the search function to hunt down specific logs.
Now, you might be wondering, why go through all this hassle?
The main objective is to have logs that can be effortlessly parsed and understood by a wide array of developers.
After all, an enigmatic and cryptic log will yield little benefit, as it can only be deciphered and grasped by a select few.
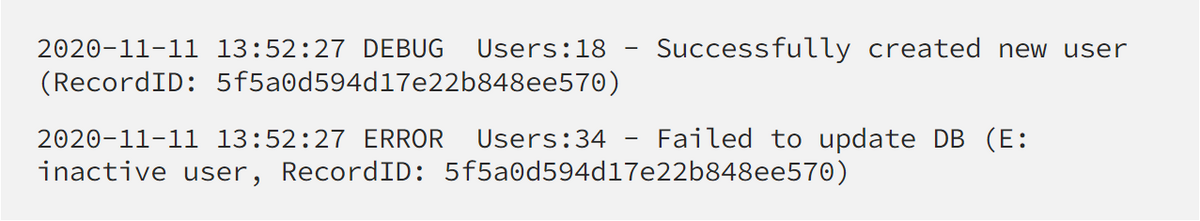
Consider the following two examples for comparison:
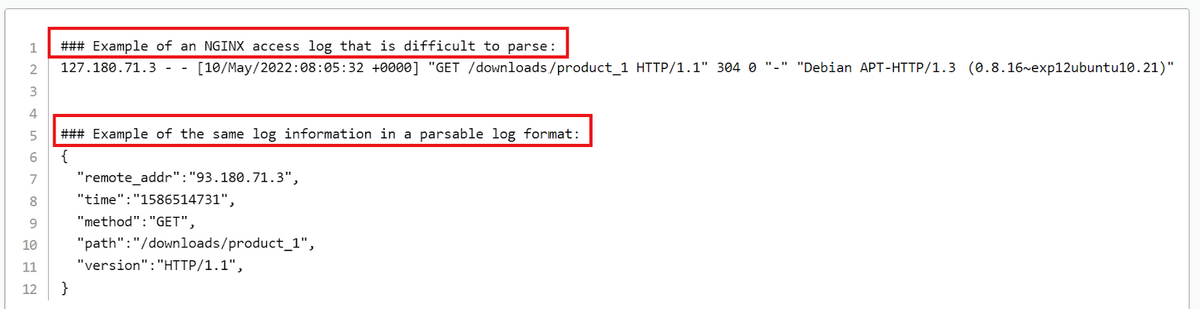
The first example is difficult to break down into components and understand what it’s about.
In stark contrast, the second example is much more understandable, it has an excellent structure, and scanning it is enough to understand the message.
Although both examples convey almost the same information, the second one accomplishes it with more clarity and visibility.
Of course, to establish a consistent log structure across the board, you can also harness the power of automation and specialized tools.
Shake, our bug and crash reporting tool, could be of great use to you here.
First of all, it automatically collects data related to individual events in the application, be they bugs causing app hiccups or crashes.
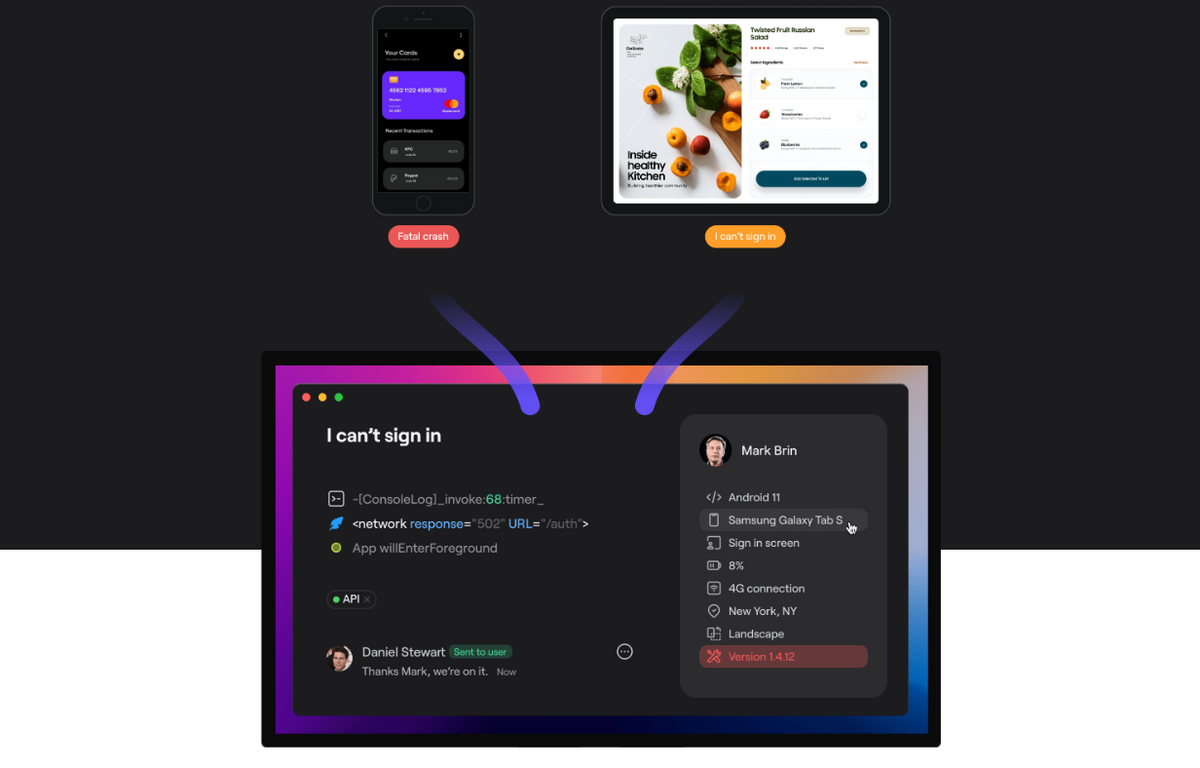
When QA specialists or users stumble upon a bug, they just need to shake their mobile device, and Shake will automatically generate a comprehensive event report with over 70 invaluable data points.
Some of them can be seen in the image below.
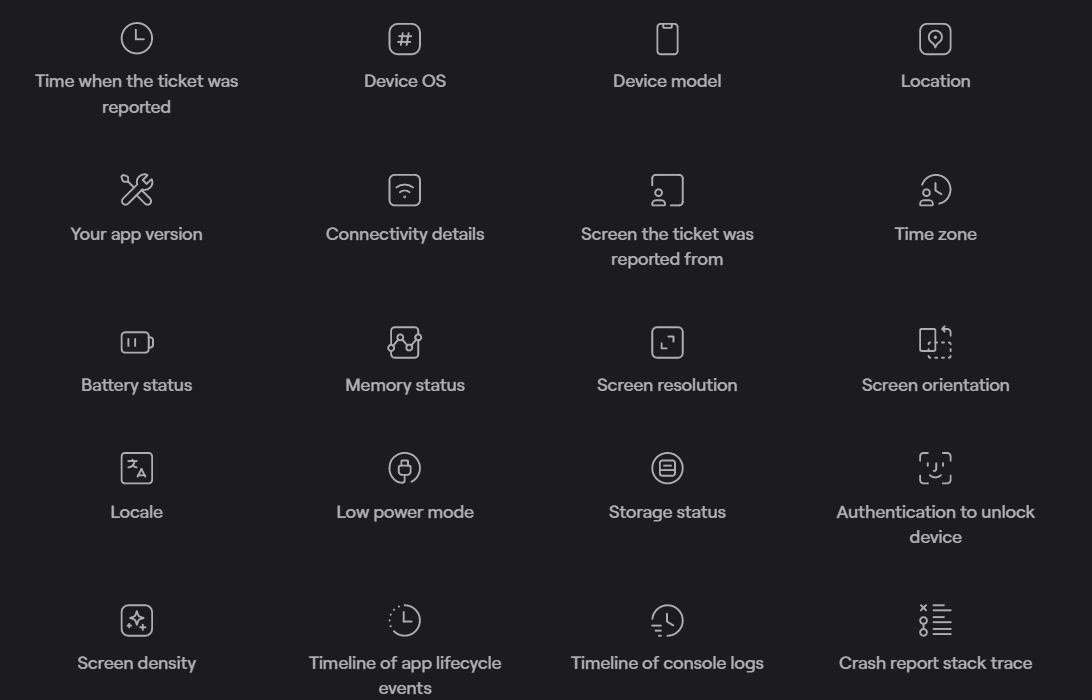
Not only that, but Shake also records activity history, enabling you to peruse network logs, console logs, system events, the chronology of user taps, screen changes, and other essential details.
In addition to the logs created automatically by Shake, you have the freedom to craft your very own custom logs and customize the tool according to your needs.
In other words, Shake will do all the heavy lifting and make all your log entries consistent.
Whether you opt for automated solutions or prefer to manually construct your log entries, one thing is pivotal–stick to a well-defined structure.
This is the best way to make your logs helpful for debugging and troubleshooting, and for all developers to understand them.
Just as it’s important to maintain consistency across all log entries, it’s equally crucial to assign them levels to sort them according to the severity of each event.
Within most logging frameworks, you’ll find the following log levels: trace, debug, info, warn, error, and fatal, as depicted in the image below.
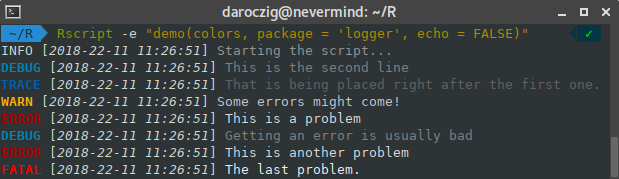
From their names alone, you can easily figure out what each log level brings to the table.
Nevertheless, let’s dive into a more elaborate description to help you understand them better.
Trace entails the most intricate and granular tidbits about the code’s execution.
It comes in handy when you need full insight into the inner workings of the app and the third-party libraries you are using.
Therefore, you can think of it as an informative level that doesn’t require any further action and is exceptionally verbose.
According to a Stack Overflow user, it’s reserved for rare cases:
We don’t use this often, but this would be for extremely detailed and potentially high volume logs that you don’t typically want enabled even during normal development.
Debug is less detailed than Trace, although it still provides more information than is typically needed.
Commonly employed when specific details are required to debug, troubleshoot, or test the application in a testing environment, it’s also seldom used, because it gathers an excessive amount of information.
This makes it hard to filter important information from irrelevant ones.
With the Info level, you can attain valuable data that you’ll need more frequently compared to Debug and Trace, but too much of it could clog log history.
It collects significant information about events that have occurred but don’t impede the functioning of the app.
In other words, it indicates that something normal but significant has happened, such as the system starting or stopping, so it is often used to create metrics and performance indicators.
Warn level is used to indicate that something has occurred that deviates from normal operation and has the potential to disrupt one or more processes.
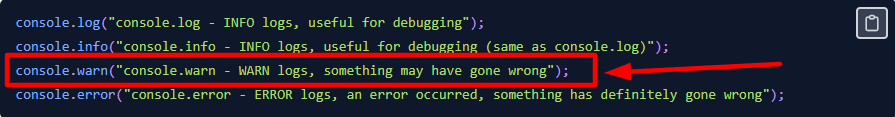
This doesn’t automatically indicate a failure of the application.
Rather, it highlights an unexpected situation, even though the code continues to function as usual, which may prompt a further investigation to prevent major complications in the future.
On the contrary, Error level demands immediate attention.
It signifies that an error has occurred in the system that, despite continuing to function, has limited certain settings or capabilities, rendering them inoperable.
Fatal level, on the other hand, indicates that at least one component has stopped working entirely, thus hindering the operation of the whole system.
In other words, it denotes a highly severe error that will eventually cause the app to crash or stop running.
Now, keep in mind that you don’t have to use all the log levels we discussed here. Instead, you can choose only the ones that bring the most value to you and your developers.
For example, in our tool, Shake, we embrace the four most common levels: debug, info, warn, and error, along with the addition of verbose, which represents the level with the most granularity.
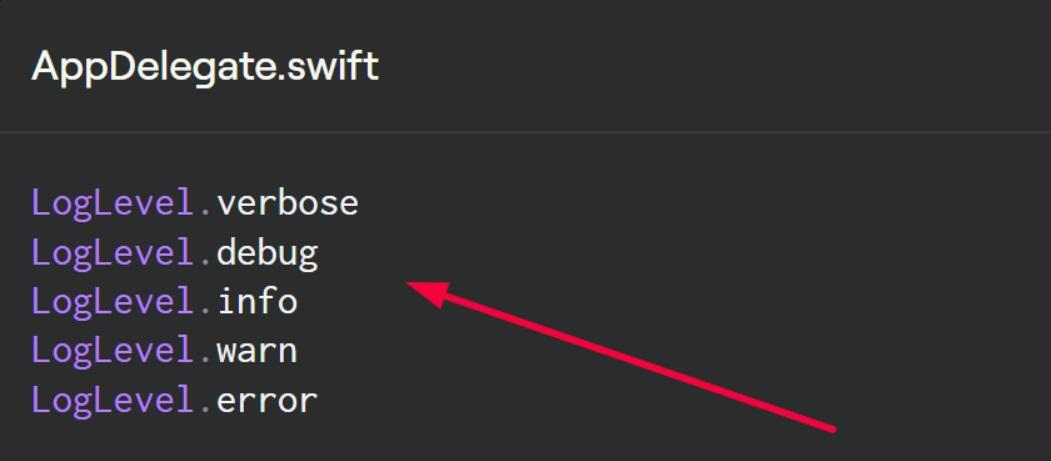
As you can see, how you structure your levels is entirely up to you.
The most important thing is that there is a level structure that you can use to search, and address log events based on their severity.
Considering the sheer volume of log messages that the app’s systems produce, being able to filter and find the right information during debugging, troubleshooting, and just checking them may prove indispensable.
For app log messages to be truly valuable, they must speak volumes to developers and system administrators with a single line of code.
In other words, they should be concise, yet be able to convey all the important details of the log event.
For example, Emil Stenqvist, a developer at Unomaly, suggests keeping it simple, breaking it down into multiple smaller events, and limiting the size of log messages to between 100 and 1000 characters.

Capture, Annotate & Share in Seconds with our Free Chrome Extension!
He explains it as follows:
Instead of describing a large process happening in your program as single large events with tons of data, try to break it up into a number of smaller events, each describing the bigger process as a number of steps.
In essence, every log message should describe a single event or action and provide enough context to understand what is happening or where to find additional information.
A well-designed log message could look something like this.
This brings us to the next golden rule in writing concise app log messages – always provide enough relevant contextual information to streamline the process of identifying the event being logged.
Take, for instance, these two log messages:
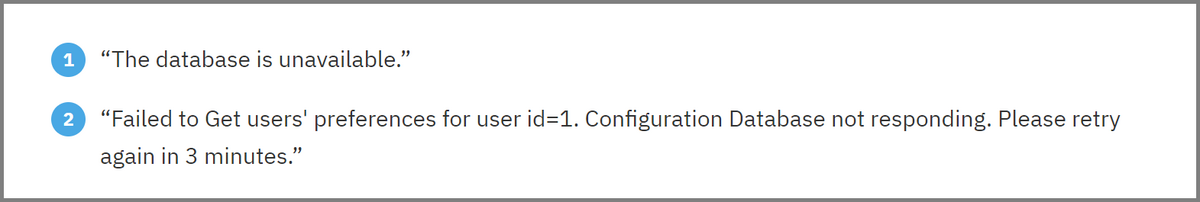
It’s clear from the first example that it lacks context, and it’s almost impossible to determine the root cause of the issue.
The second example, however, is more complex in terms of contextual information, allowing us to immediately understand what the program was trying to achieve and pinpoint in which component the error occurred.
Therefore, in addition to insisting on brevity and conciseness, a good rule of thumb is to include relevant context.
Another aspect to consider when creating log messages is the use of the English language.
Not only has English evolved into the lingua franca of international software development, but it also includes Unicode characters that are supported by probably every tool and console under the sun.
Therefore, it’s advisable to stick to the plain English language and widely accepted character sets for writing log messages.
Remember, every redundancy in the logging process contributes to higher disk storage, which can lead to performance issues.
So, keep your log messages relevant, short, and sweet.
Through this article, we described the best practices in the field of app logging, providing four essential tips that not only offer essential insights into the behavior of the application but also pave the way for identifying and rectifying issues.
By helping you decide which app events to keep an eye on, outlining different log levels, and explaining how to craft consistent and concise log entries, we tried to encourage you to boldly conquer the challenges of logging.
Hopefully, this article has shed more than some light on this exciting topic and given you a basic understanding of how you can implement these practices in your own logging ventures.
From internal bug reporting to production and customer support, our all-in-one SDK gets you all the right clues to fix issues in your mobile app and website.
We love to think it makes CTOs life easier, QA tester’s reports better and dev’s coding faster. If you agree that user feedback is key – Shake is your door lock.
Read more about us here.

Add to app in minutes

Doesn’t affect app speed

GDPR & CCPA compliant

Unexpected things pop up
Just like bugs in your app or web 🐛 Fix them now with just one reporting tool.