Recommended
Tips for improving your mobile app testing skills

Software is complex. Made up of thousands of lines of code that all interconnect and depend on one another, it can be challenging to build, troubleshoot and maintain applications.
Therefore, to make the process more manageable, developers use multiple different resources to understand their applications better. One such widely-adopted strategy is app logging.
A method to record all relevant events inside an application, app logging is a comprehensive, thorough way to ensure you don’t miss anything happening with your software.
This article will walk you through the entire process, explaining everything you need to know about app logging.
Table of Contents
Software is intelligent. If anything affects or happens within an application, your program will record these events, noting down all relevant information.
This process is known as app logging.
However, it won’t occur automatically—developers choose which events to log depending on the software’s behavior and configuration.
Since every software is unique, there’s no defined list of logged events.
That being said, there are certain events that are so important they’re almost always logged.
You can see them in the graph below:
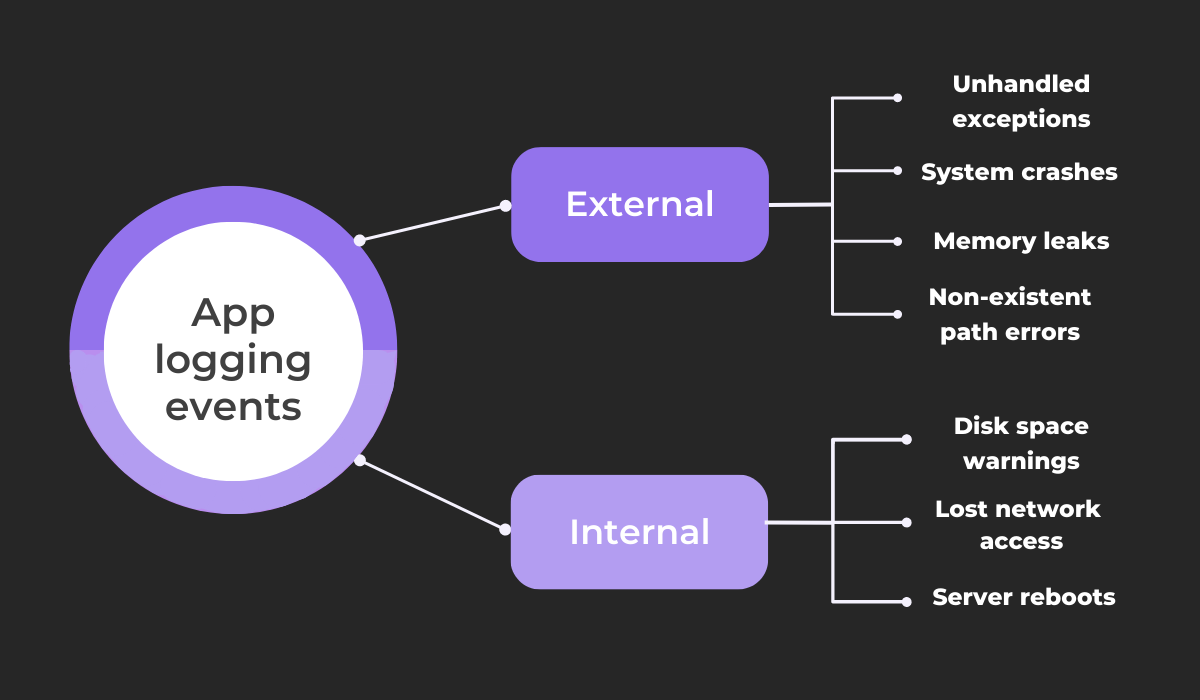
All these events refer to conditions that can endanger the application, so it’s important to monitor them.
If any of these situations occur, you’ll want to know about it, and you’ll want as many details as possible.
As such, they’re among the most common app logs.
For a real-world example, take a look at this crash log:
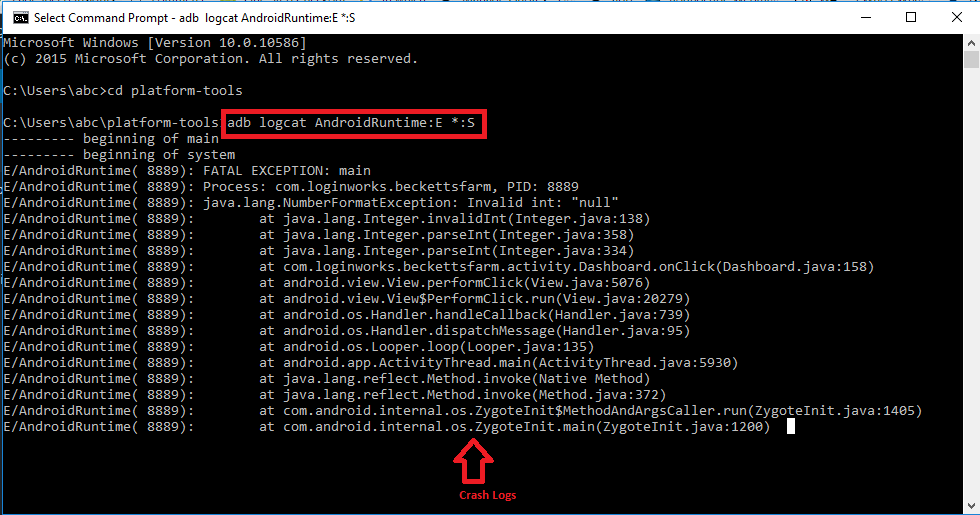
As you can see, these logs are highly technical and dense.
Although they might seem intimidating, they are worth diving into, as they often contain invaluable information on your application’s performance.
Furthermore, you can easily increase your logs’ readability with structured logging. Such logs are usually structured in a format like JSON or XML and contain well-defined information.
Consequently, they’re much more digestible,
To see what we mean, look at this unstructured log:

The data is arbitrarily arranged in one continuous string, which makes taking in all the information difficult.
However, structuring your logs should make them much easier to read.
Here’s proof:
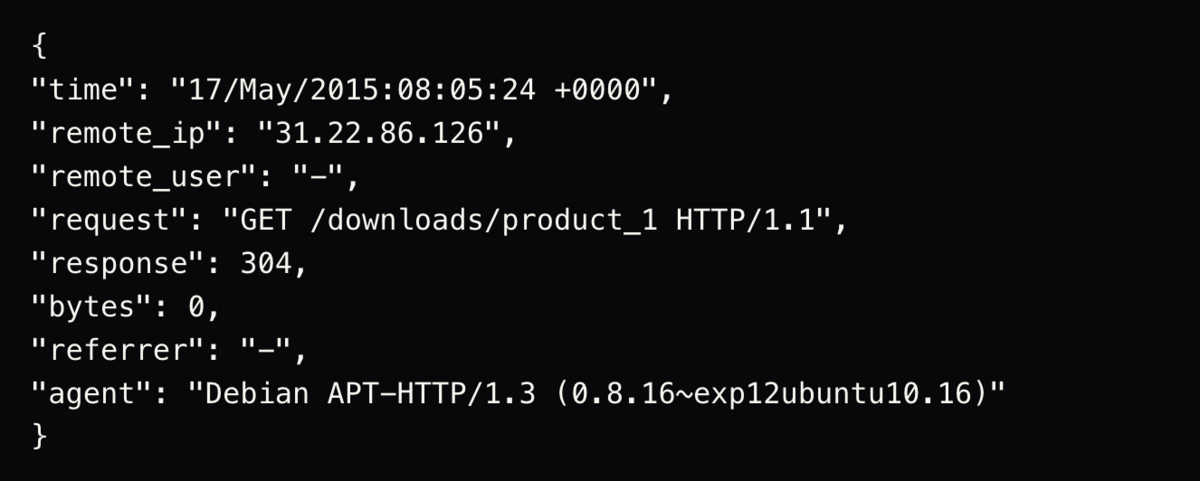
This structured, organized log is significantly easier to understand, as everything is presented in key-value pairs.
Consequently, you’ll be able to read your app logs more quickly and better examine your application’s behavior.
App logging provides an in-depth, detailed look at your software’s inner workings. You won’t wonder how your program is behaving, as the app logs will provide all the data for you.
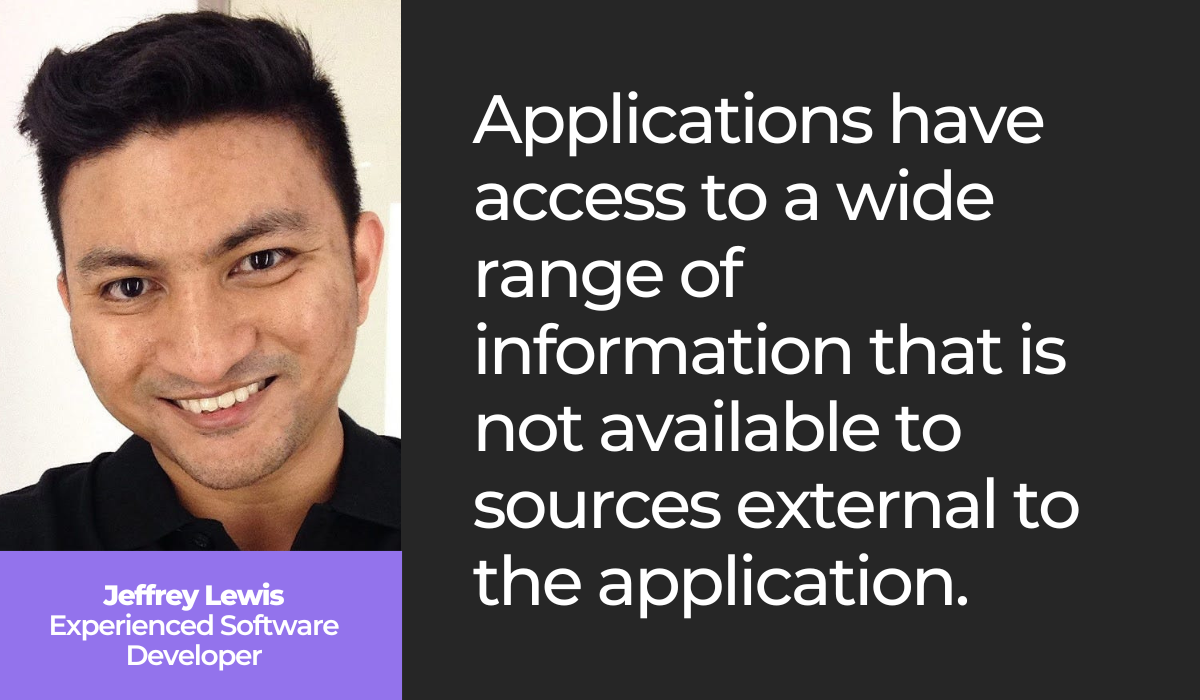
Furthermore, you’d have a hard time locating this information anywhere else. Or, as experienced software engineer Jeffrey Lewis put it:
In other words, app logs reveal valuable information available only to the application.
These records contain insight you won’t find elsewhere, making them crucial for debugging and problem-solving.
As such, app logs are often used as a debugging crutch.
Developers frequently consult these logs when their software is behaving unusually, using them to help pinpoint the exact issue and devise possible bug reasons.
One Reddit contributor gave a few great examples of how app logging can assist in debugging.
Take a look:
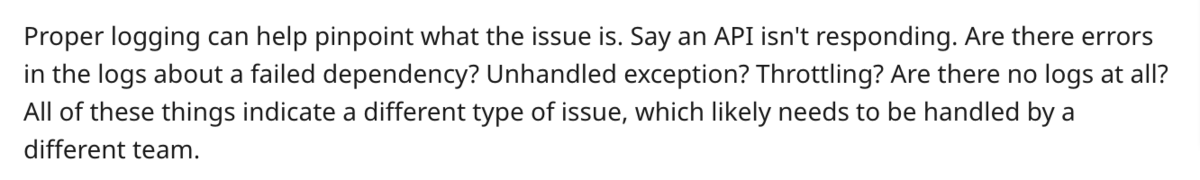
App logs are excellent indicators of why an application isn’t working.
By examining these records, developers will receive multiple clues as to the nature of a bug and will therefore resolve the problem more quickly.
Besides debugging, app logs are also great for analyzing application health generally.
These records reveal insights regarding many performance metrics, helping developers assess their software’s overall execution.
Generally speaking, logs contain data on the following metrics:
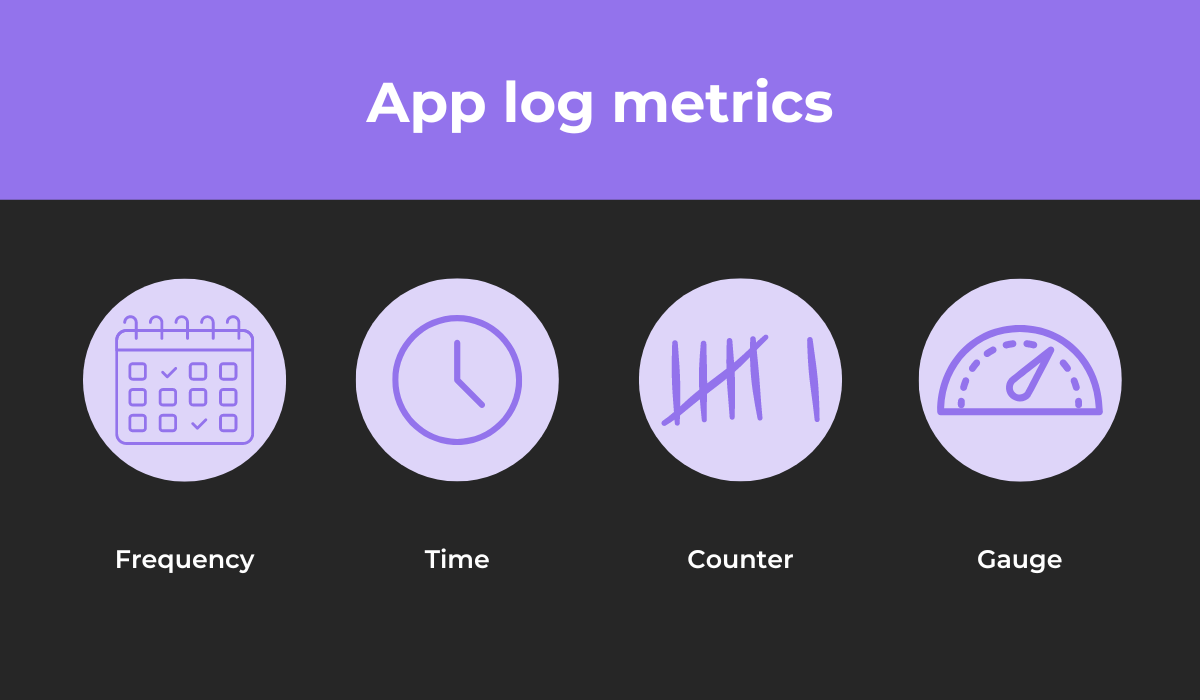
App logs will reveal how frequently certain events occur and also record how long it takes for procedures to be completed.
In addition to this, integer values are incremented and decremented. For example, you’ll see how many users are signed on.
Finally, there are also custom metrics you yourself gauge, such as CPU usage.
As you can see, app logs can reveal a treasure trove of analytical information.
With these measurements, you can easily assess your software’s performance and verify everything is functioning correctly.
Developers choose which events their application logs—there’s no predefined list that the application logs independently. Instead, developers need to configure their own events.
However, generally speaking, there are five types of event logs:
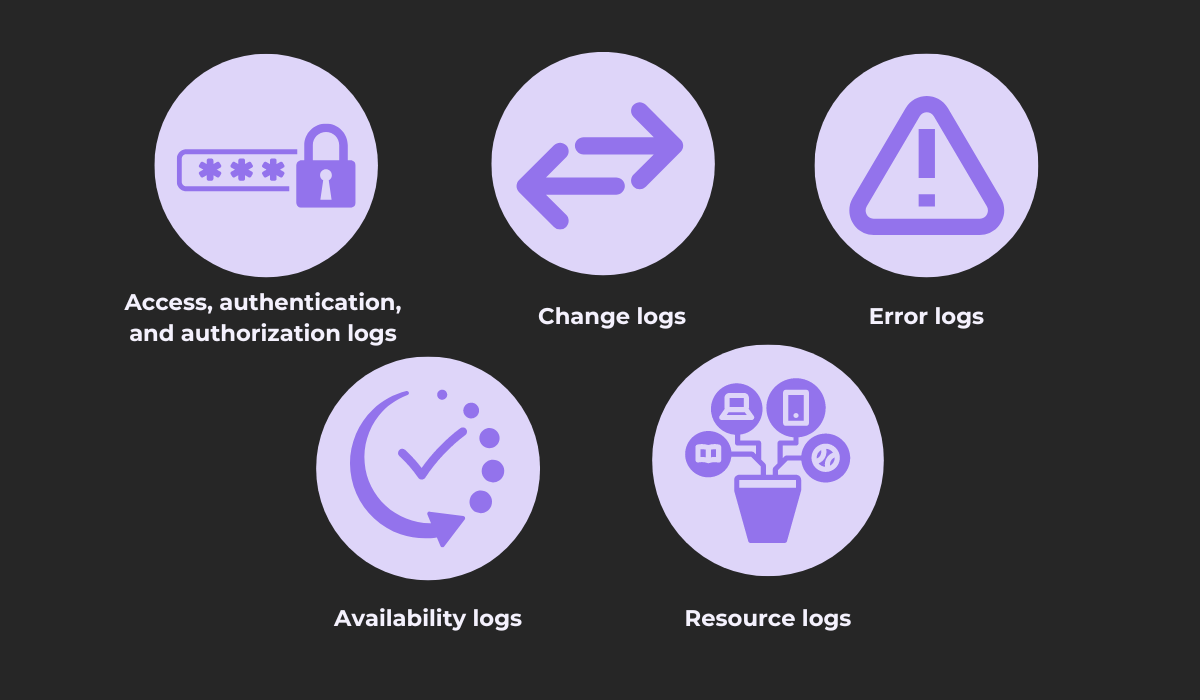
Each log type provides a different dataset, revealing unique insights into your application’s performance.
For starters, access, authentication, and authorization logs indicate events such as logins, logouts, data, resource requests, etc. These logs show all access instances.
Here’s a sample access log:
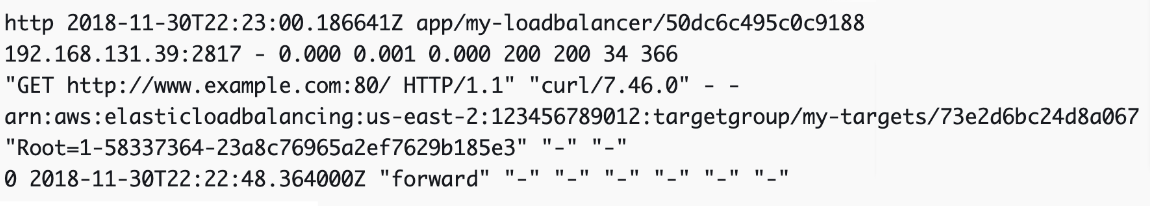
This log shows a successful request to a Lambda function, courtesy of Amazon AWS.
Slightly more varied than this are the change logs. These indicate all application changes, including changing permissions, whitelisting IP addresses, upgrading software versions, etc.
Here’s an example:
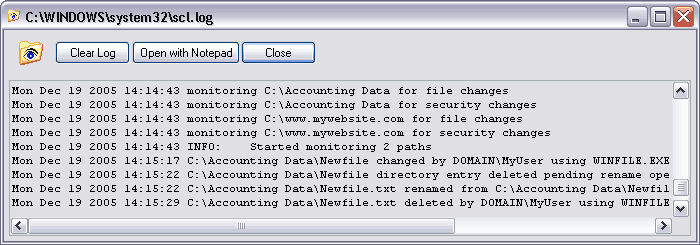
You can clearly see all the changes made, as users delete directory entries, rename files, and other similar actions.
Although highly useful, another app log type is perhaps more helpful than change logs. Error logs provide details about software malfunctions and are invaluable when debugging.
Here’s a case in point:
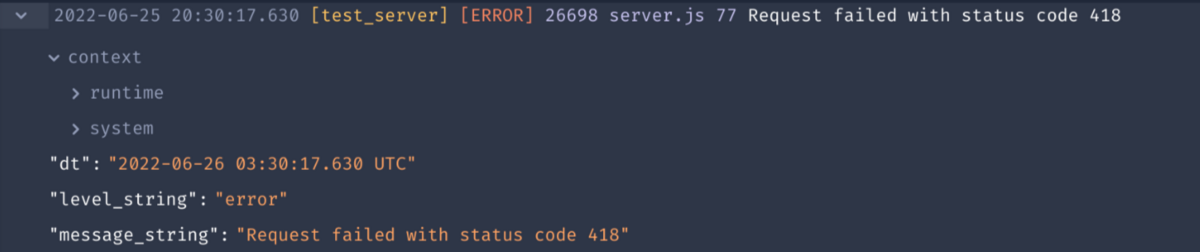
Usually characterized by an ERROR marker, this log type reveals all of the details of a software issue. Consequently, developers frequently consult them when solving bugs.
Another crucial app log type is availability logs. These records indicate events like successful data backups, shutdowns, reboots, etc.
Take a look at this example:
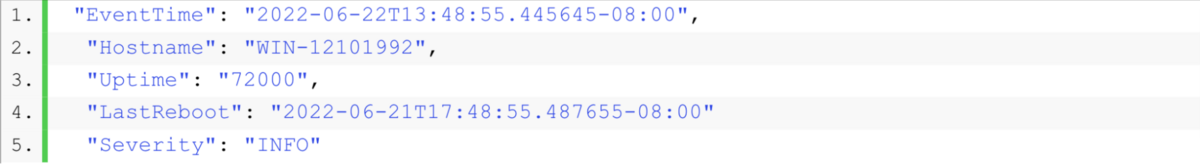
This particular log entry contains details regarding a system reboot, including the time and hostname.
Lastly, our final app log type is resource logs—records that note exhausted resources, exceeded capacities, and connectivity issues.
Here’s one sample loh:

The application is having trouble utilizing its memory, hence this app log describing the exhausted resource.
By monitoring all these app log types, you’ll have in-depth insight into your application’s behavior and will always stay on top of its performance.
For an app log to be helpful, it must contain helpful data. Vague, unspecific logs don’t really assist developers, so if yours are like that, you might as well not have bothered logging.
Therefore, to take full advantage of app logs, ensure they record relevant data. Just as developers choose the events to log, they also select the data included in logs.
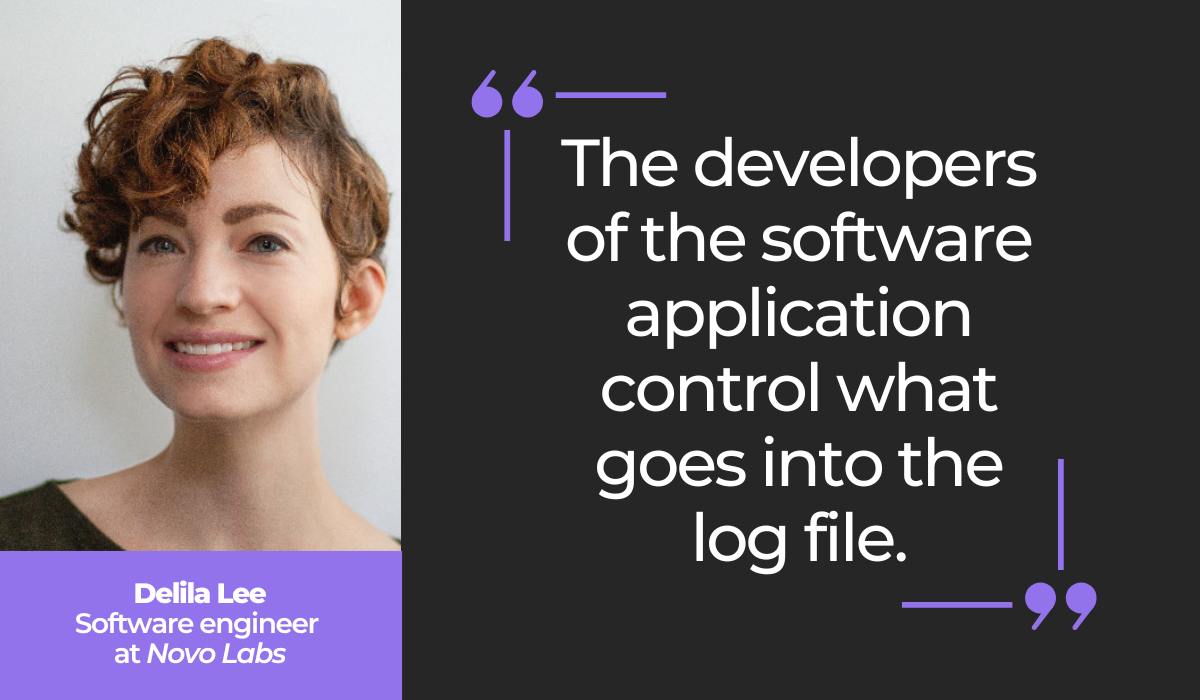
Delila Lee, an experienced software developer, summarized this well:
Your developers control what intelligence is contained in the app logs, including and excluding data as they deem necessary.
When choosing such data, the easiest place to start is perhaps choosing what to exclude, as certain information is simply too sensitive to be mentioned in logs.
The graph below shows all such datasets:
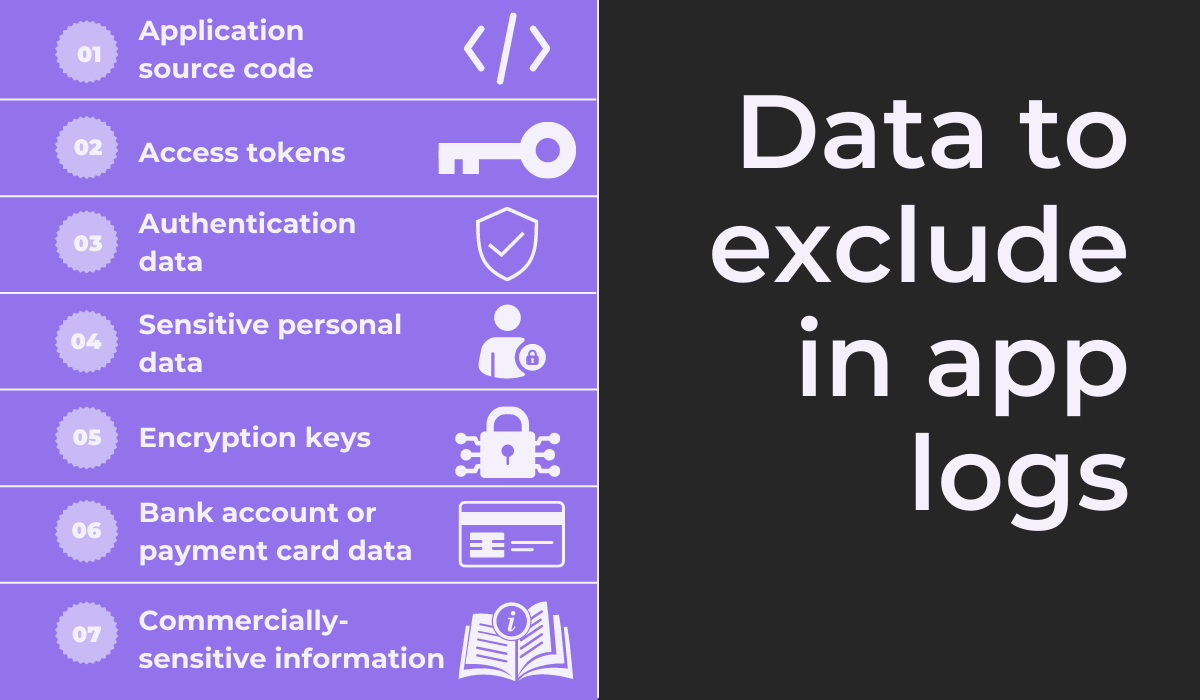
The above-listed information should never be present in app logs, as they’re all confidential, private datasets. This type of intelligence should always be masked or removed from the logs.
Conversely, there are also certain essential data points that should always be present in app logs. You can view this information in the graph below:
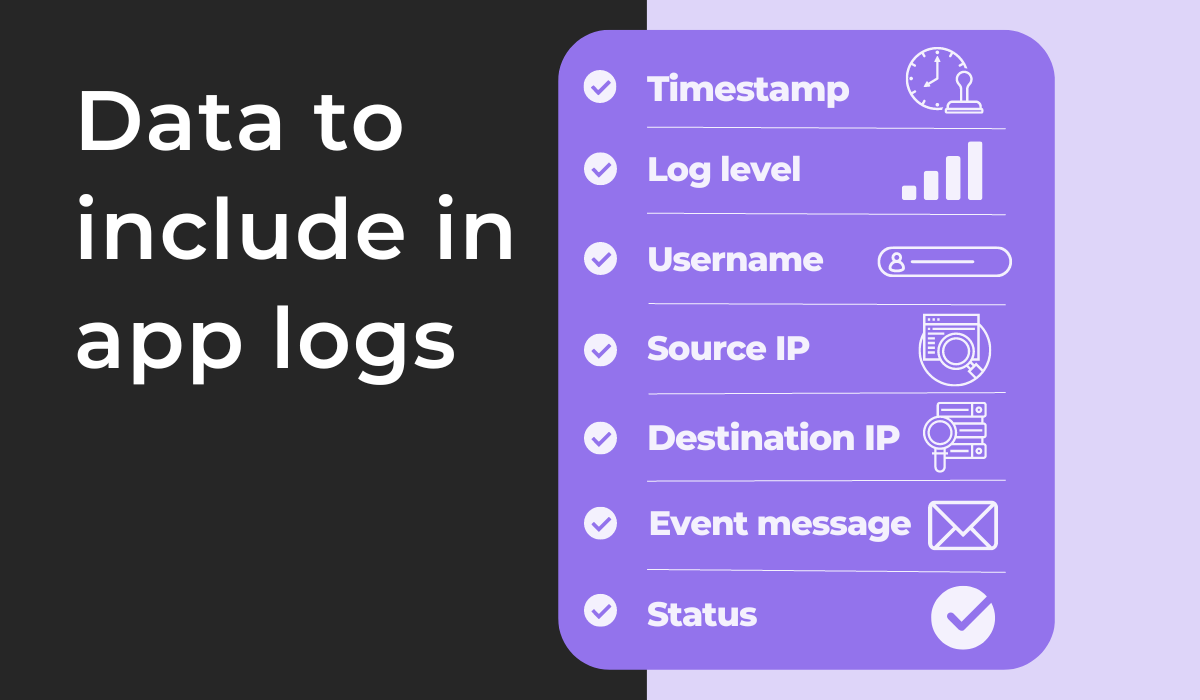
The timestamp indicates the event time, whereas the source and destination IP specify the location.
The former refers to the client’s IP address, whereas the latter describes the local server’s IP address. For local events, the source IP can sometimes be empty.
Another invaluable dataset is the username, which shows the network (or logged-in user) responsible for the event.
This field can also occasionally be empty during some system-related events.
In addition to this, there should always be a message briefly describing the event in question. It’s also worth attaching a status to this message (usually succeeded or failed).
Finally, every app log should be marked with a log level, which will be discussed in the next section of this article.
Your application will generate countless app logs, creating a mass of records that isn’t easily navigable. Therefore, it’s worth employing logging levels—markers to prioritize your logs.
With these tags, you can easily filter your logs and find the exact information you require.
For an overview of the common logging levels, look at the graph below:
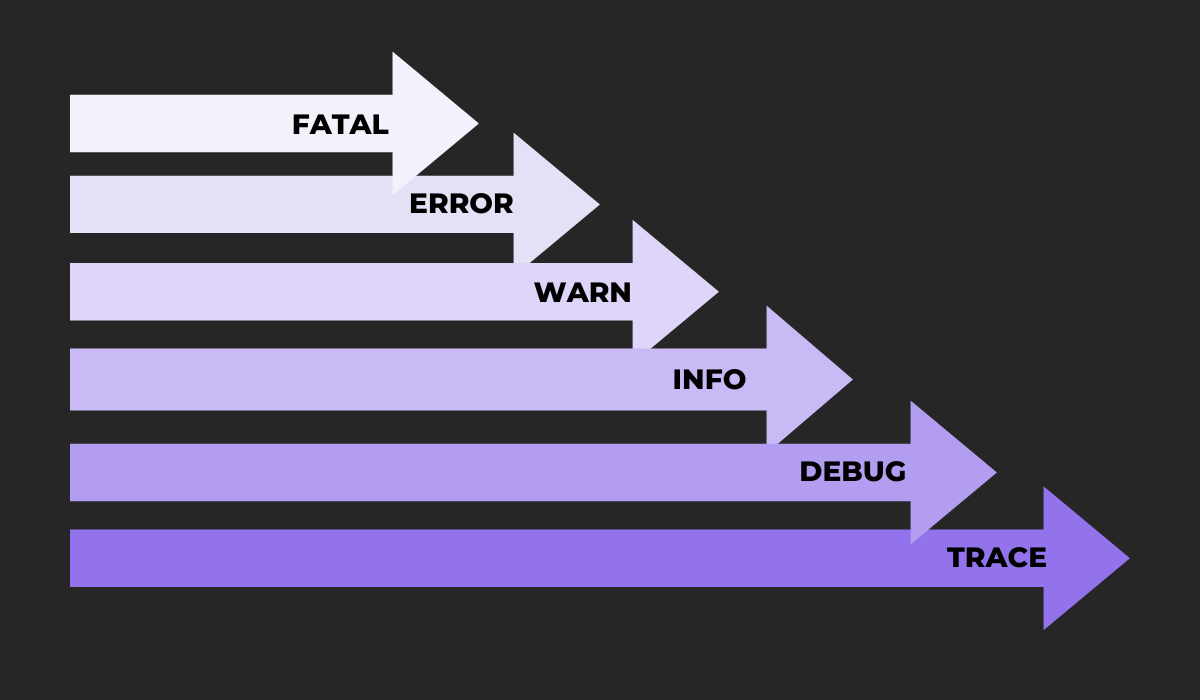
The most severe logging level is FATAL, used only when something catastrophic happens with your software.
Less intense is ERROR, which simply indicates some software malfunction. It’s followed by WARN, referring to an unusual situation that might or might not be a bug.
After the problem-related log levels come informational layers.
INFO captures all standard software operations, whereas DEBUG records more granular, diagnostic intelligence that helps with debugging.
Finally, the last logging level is TRACE: noting information finer than DEBUG, capturing every possible application detail.
In addition to these standard levels, some systems also include OFF and ALL. OFF doesn’t log anything, whereas ALL will encompass all logging levels.
The visual below illustrates more clearly what is included in each level:
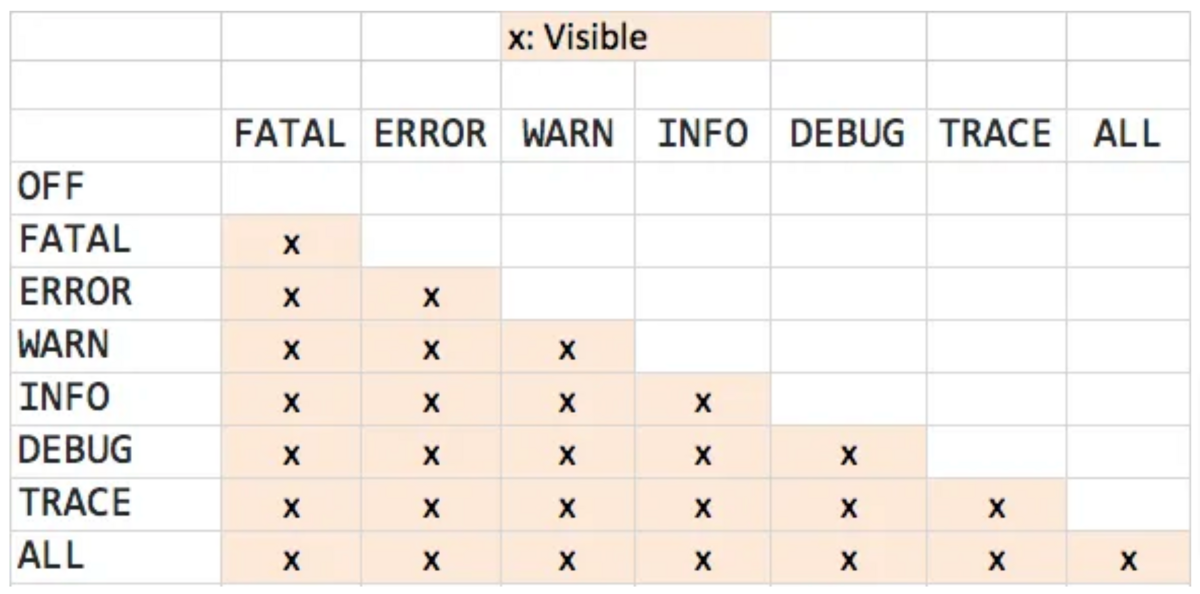
As you move down to more general logging levels, more logs become available. For example, if you’re looking at the FATAL level, you’ll only see FATAL logs.
However, if you’re examining INFO logs, you’ll see all three error-orientated log levels along with INFO.
Furthermore, some tools also allow custom log levels in addition to these standard levels.
For example, you can define your own unique log levels with Shake.
Just use the following code:
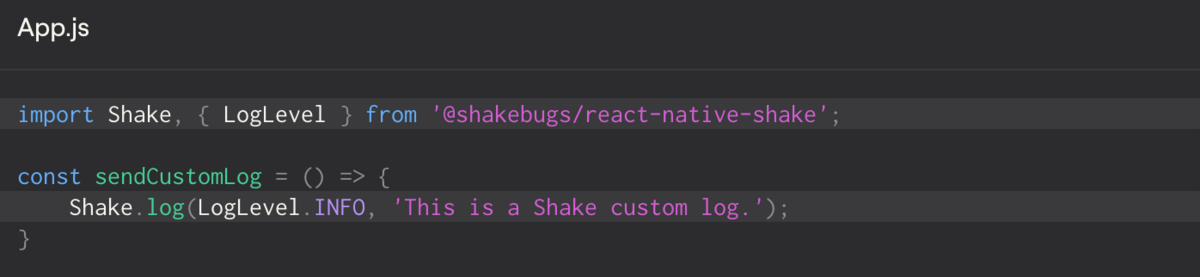
If there’s a particular event you want to single out, you can easily create a custom log level with Shake.
Instead of lumping together important events in the common logging levels, you can easily isolate them with custom log levels.
The information app logs provide is often a fantastic clutch for troubleshooting and debugging software.
However, this is only if you know how to use these logs. All that data won’t be much help unless you can leverage it.
Consequently, efficiently using your app logs is just as crucial as configuring them.
A good first step to efficiently utilizing app logs is to limit their amount.
Although you might be tempted to record every possible application event to ensure complete coverage, you’ll likely get lost in such a swamp of log messages.
Shubham Gupta, a principal engineer at Ula, has also pointed this out:
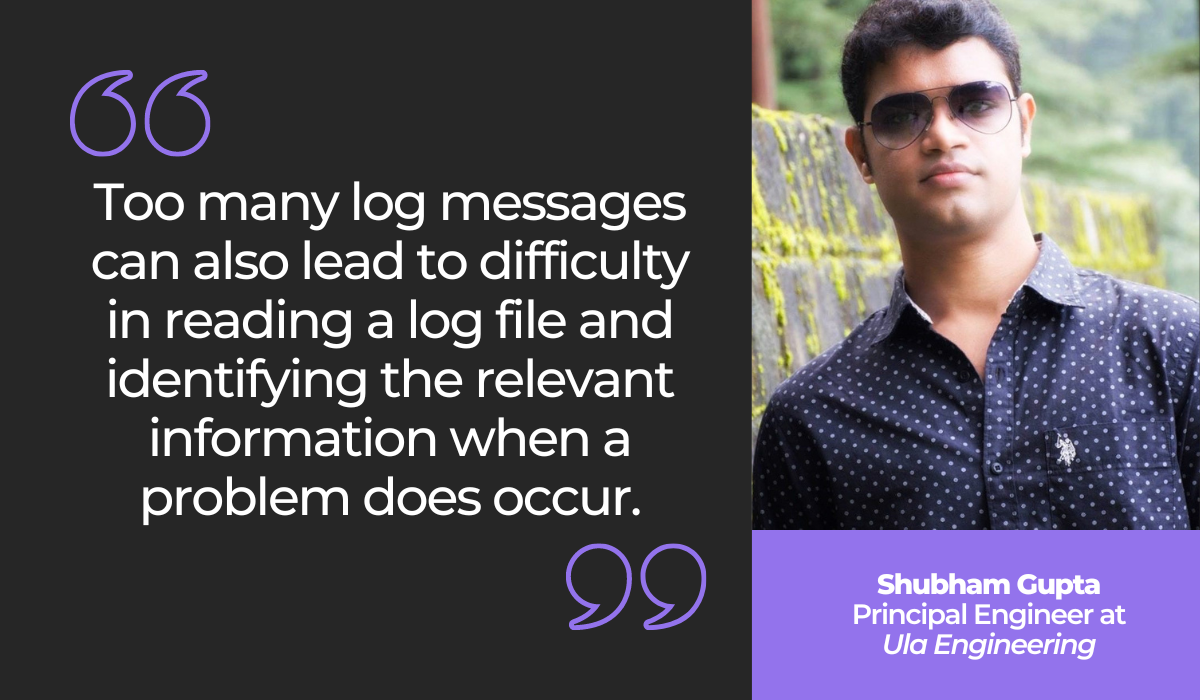
If you’re bogged down with too many app logs, it’ll be like trying to find a needle in a haystack when locating information.
Therefore, it’s best to perform app logging intelligently but sparingly, only when necessary.

Capture, Annotate & Share in Seconds with our Free Chrome Extension!
One easy strategy to accomplish this is by logging moderately but examining your app logs at three different layers.
This is because the log visibility will change with each architectural layer, revealing new insights at each level.
The graph below provides a great example of this:
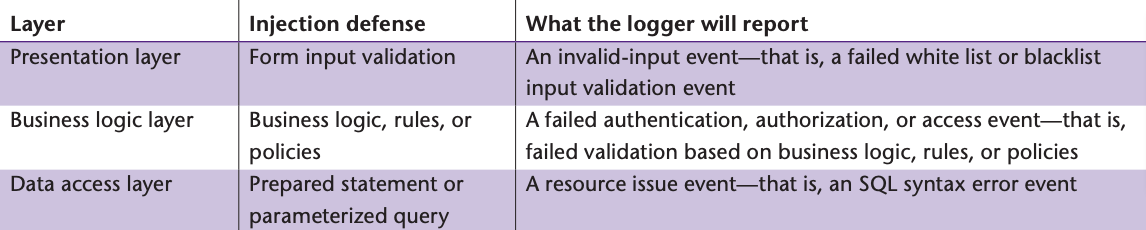
As you can see, the logs report different datasets at each architectural level.
If you omit even one layer, you might miss out on vital information that could help uncover unusual behavior in your application.
An easy method to stay on top of such intricacies is to invest in a log management tool.
For example, the logging tool Sematext allows you to easily assign log levels and then filter your search results based on the tags you’ve used for them.
Here’s how it looks:
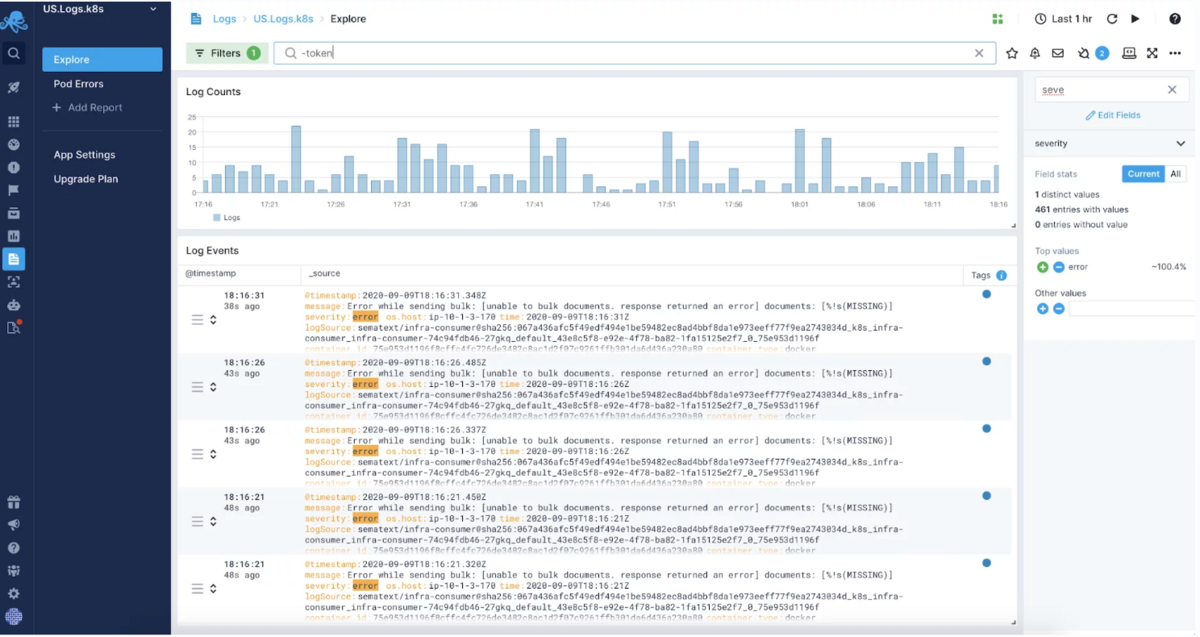
Sematext has filtered all of the defects that have been assigned the level of ERROR.
With this advanced search capability, developers can immediately locate bugs, all thanks to the efficient use of app logs.
If you want to find out what’s going on inside your application, try turning to your app logs.
These records are a detailed, thorough file of every relevant application event, including errors, access information, changes made, and similar.
Examining the log gives you a top-down view of everything occurring with your software.
With this knowledge, debugging and software diagnostics should then be significantly facilitated.
Developers will have a treasure trove of information on their hands, making such troubleshooting and analysis processes much more straightforward.
If you haven’t yet started app logging, consider implementing it—your developers will thank you.
From internal bug reporting to production and customer support, our all-in-one SDK gets you all the right clues to fix issues in your mobile app and website.
We love to think it makes CTOs life easier, QA tester’s reports better and dev’s coding faster. If you agree that user feedback is key – Shake is your door lock.
Read more about us here.

Add to app in minutes

Doesn’t affect app speed

GDPR & CCPA compliant

Unexpected things pop up
Just like bugs in your app or web 🐛 Fix them now with just one reporting tool.