
Recommended
A guide to debugging your code

Debugging is seldom fun. You’ve finally finished coding, and you think you’re done for the day—but then QA bombards you with bug reports.
It turns out you’re nowhere near done, as you still need to debug your software and resolve all the defects.
Solving such issues can sometimes take hours, depending on the bug’s nature. Furthermore, you’re seldom in a good mood after discovering your software’s errors.
That being said, there are a few methods that will aid the debugging process and should help you solve defects easier. To find out what they are, keep on reading!
Table of Contents
Generally speaking, you want as few software bugs as possible—after all, they are nothing but problems in the program.
However, before starting the debugging process, it’s essential to define the exact problem. How precisely is the software malfunctioning? Why is it so disruptive?
In other words, you need to ask yourself the right questions.
By conducting this inquiry and examining the bug from all possible angles, you’ll understand the defect better and be able to easily determine the exact issue.
For starters, try out these sample questions:
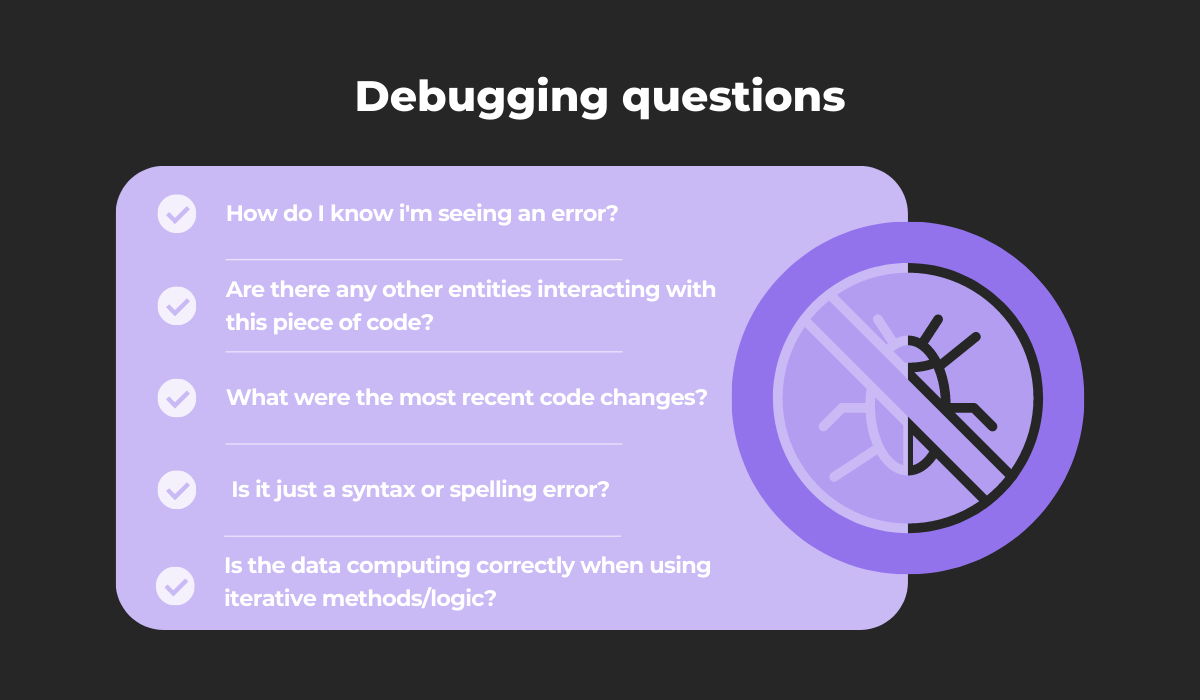
The first three questions consider the bug’s nature and are a push in the right direction for developing a hypothesis.
From there, you’re already well on your way to finding the defect’s root cause.
The latter two questions, on the other hand, are more technically-minded and a great starting point for deliberating all the possible technical causes.

Get unreal data to fix real issues in your app & web.
If this seems like a lot to take in, don’t panic.
There’s no need to tackle all these questions immediately. Instead, try the following method:
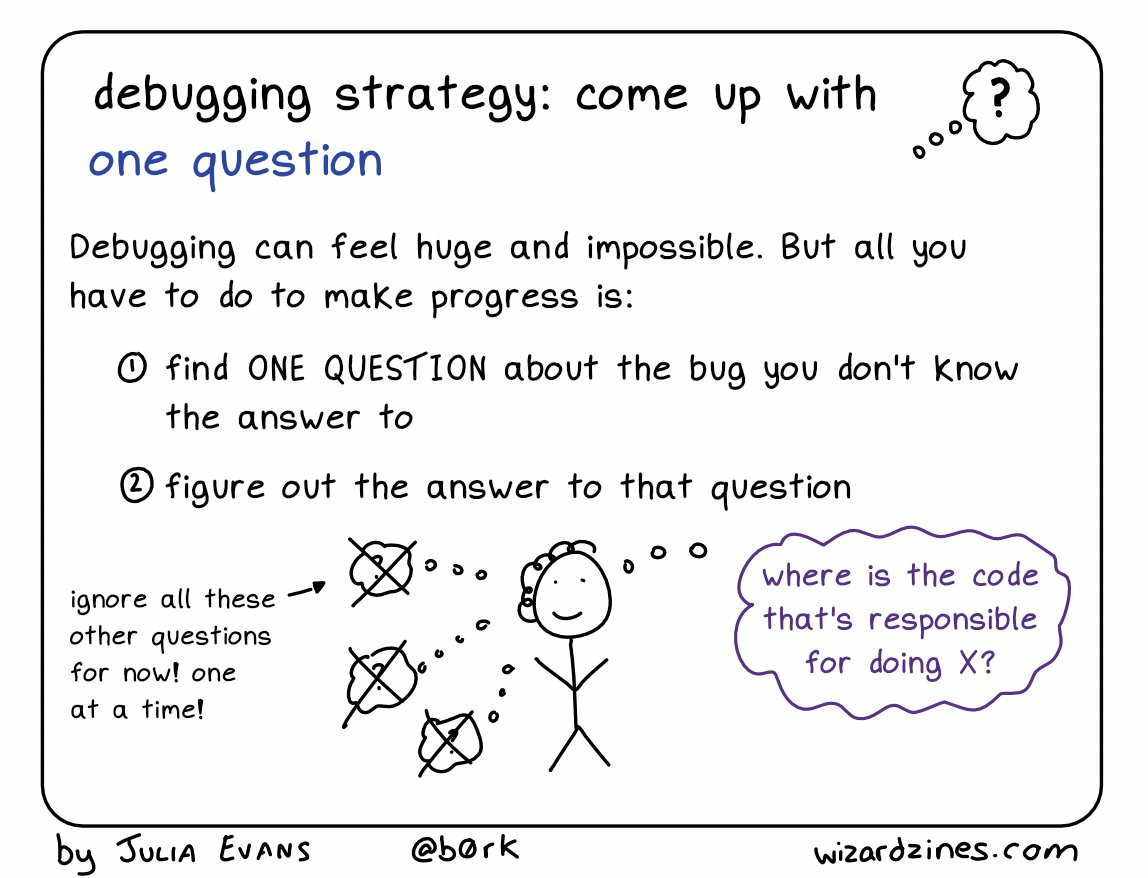
It’s best to take these questions one at a time and focus on one isolated inquiry. That way, you’ll devote all energy to obtaining that answer and can ensure a high-quality response.
With each new answered question, you’ll get closer to resolving the bug—each response forms a piece of the puzzle.
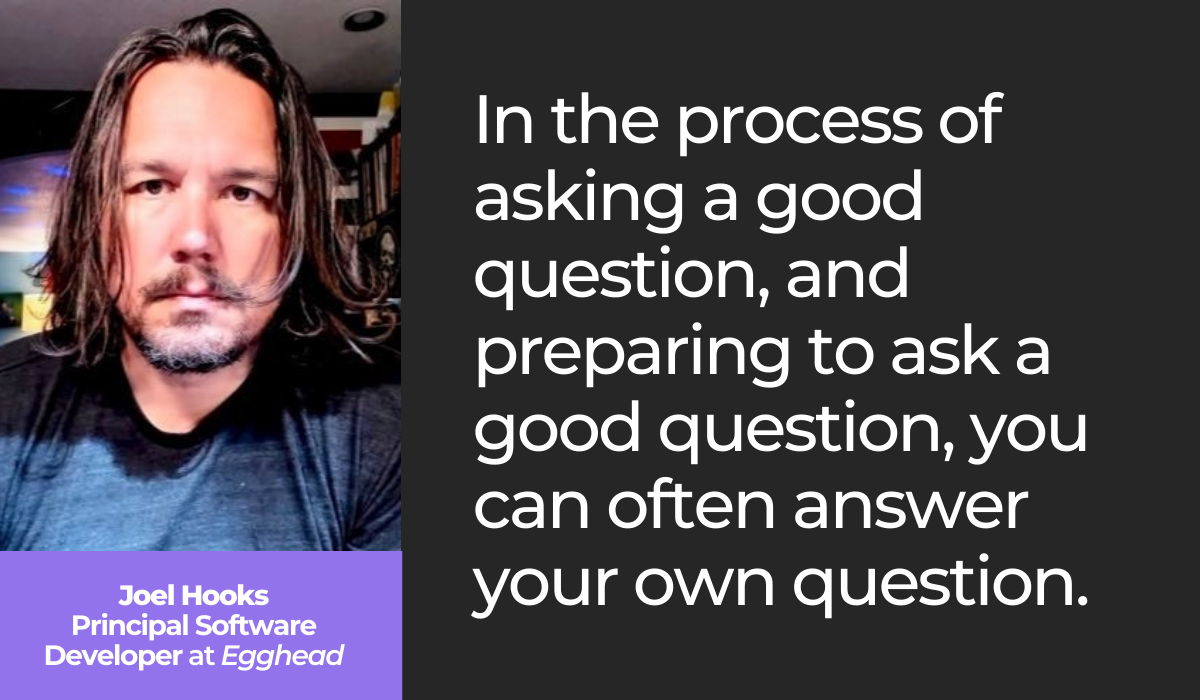
In fact, Joel Hooks, Egghead’s Principal Software Developer, says that a well-composed question can sometimes be an answer unto itself.
Here’s his take:
If your question is thoughtfully constructed, you might even uncover its answer—and solve the bug—while composing the inquiry or immediately after defining the question.
As such, an intelligent question is worth its weight in gold. It’s evidently much better to critically examine the bug than haphazardly try arbitrary fixes.
However, if your debugging goes on for too long, there is one other important question you should ask yourself.
This Quora user put it well:
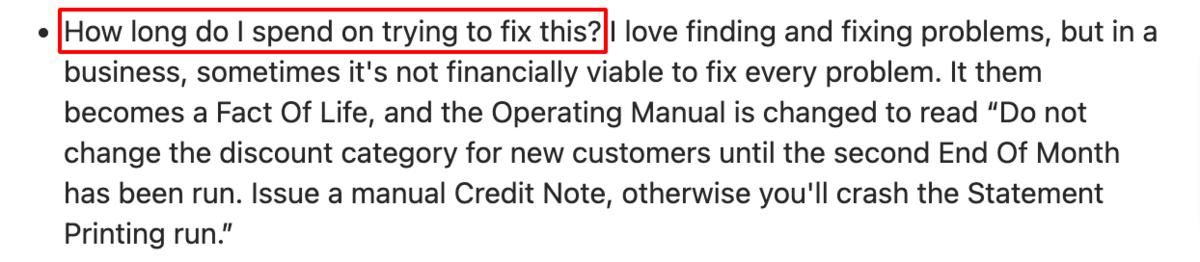
You’ve probably got other tasks besides debugging and can’t spend two entire days on one bug. If you hit a roadblock, there comes a point where you have to postpone the fix to a later date.
Consequently, it’s imperative to consider how long you can spend on the bug fix.
With this inquiry, you’ll help prioritize tasks and juggle your workload more easily, making it a crucial question to ask yourself.
There are various debugging techniques. For example, employing print statements, reading console logs, and commenting out code sections are all tried-and-true debugging methods.
However, these approaches can be time-consuming and typically require intense concentration. That’s why, nowadays, most developers have switched strategies and started using debuggers.
Debuggers are sophisticated resources that allow developers to monitor code execution in real time under controlled conditions, therefore aiding the bug-fixing process.
This topic was also discussed on a Reddit thread, where debuggers received universal praise:
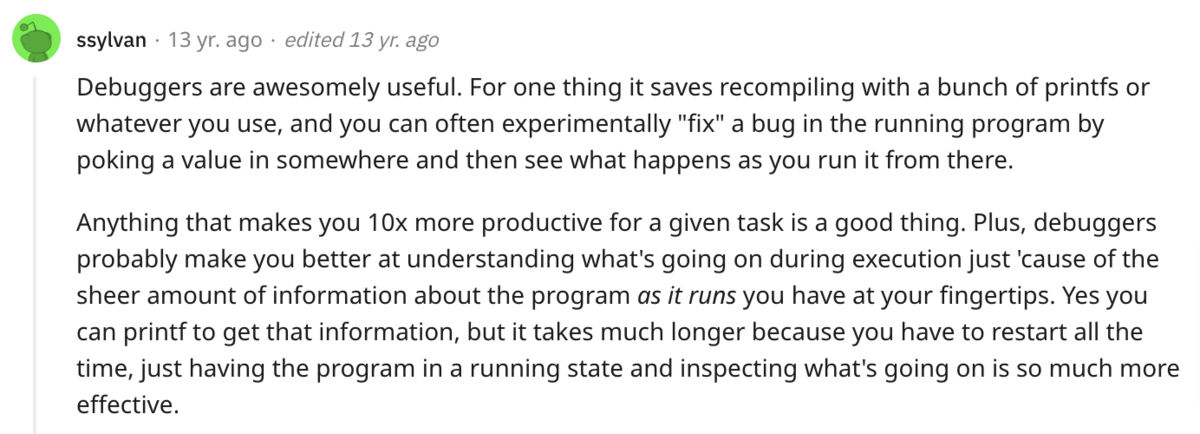
Debuggers are typically faster than traditional debugging methods.
Furthermore, they provide massive amounts of information as the program runs, making it much easier to understand how the software operates.
Consider GDB. This debugger offers a feature called Text User Interface, which splits your screen into two sections.
Here’s a preview:
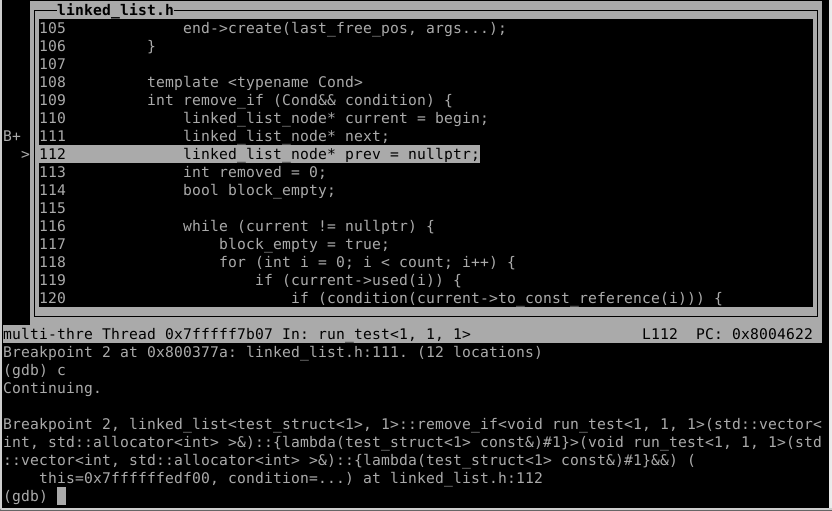
The upper screen shows the code, whereas you type GDB commands in the lower textbox. This setup makes it much easier to dissect the code.
Here’s a GDB command example:
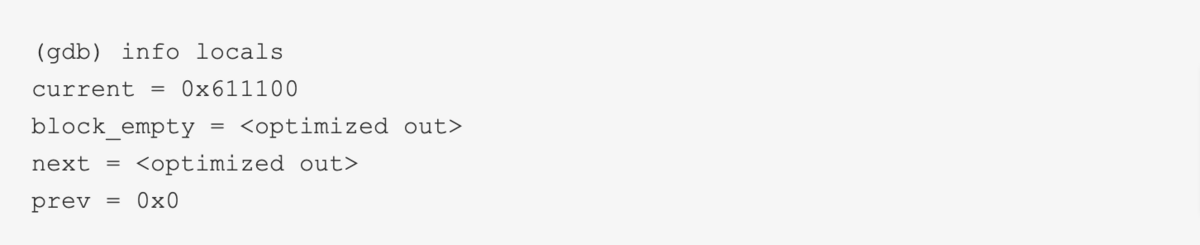
This command prints the value of all local variables in the current thread.
Such an operation is most useful when run side-by-side with the source code, as you can then more easily identify the variable’s value.
GDB is an open-source debugger that runs in the command line. However, there are also multiple debuggers built directly into an IDE or a browser.
The Chrome Debugger is a great example. Here’s a screenshot:
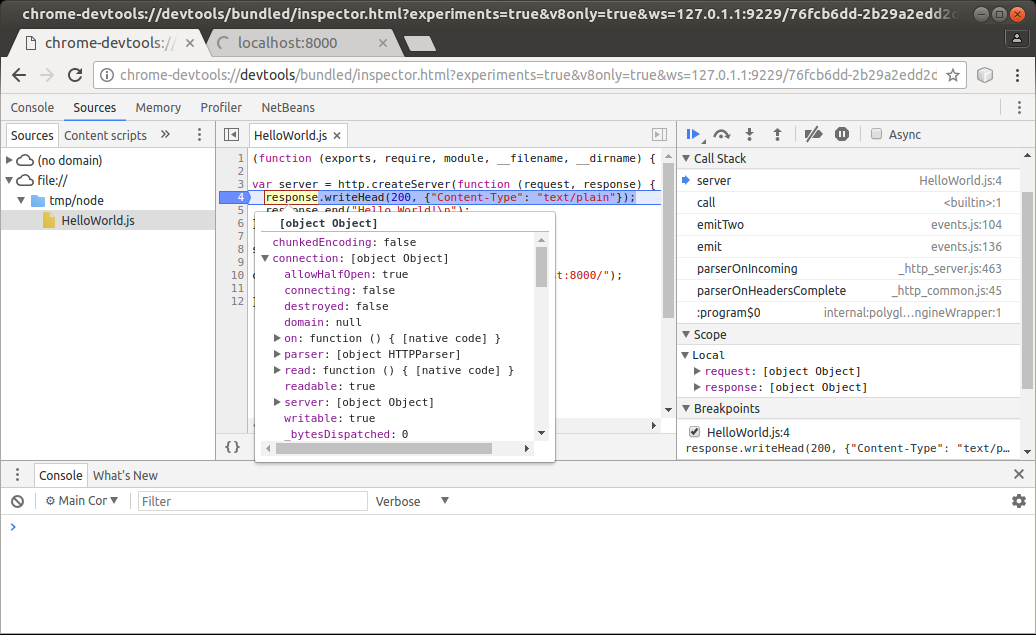
The leftmost column shows your app’s files, whereas the middle column displays the code itself.
By hovering over the elements there, you can inspect their properties, as shown above with the response variable.
Finally, the column on the right provides even more code details, including the call stack, the code’s scope, and more.
With such an informative tool, debugging should already be significantly facilitated. However, to really empower your developers, it’s worth pairing the debugging tool with a bug reporting tool.
After all, the first step to solving a bug is a high-quality bug report, which is easily achieved via bug reporting tools.
For example, with Shake, simply shake your device, and a comprehensive bug report will be automatically delivered to your developers.
Here’s a preview:
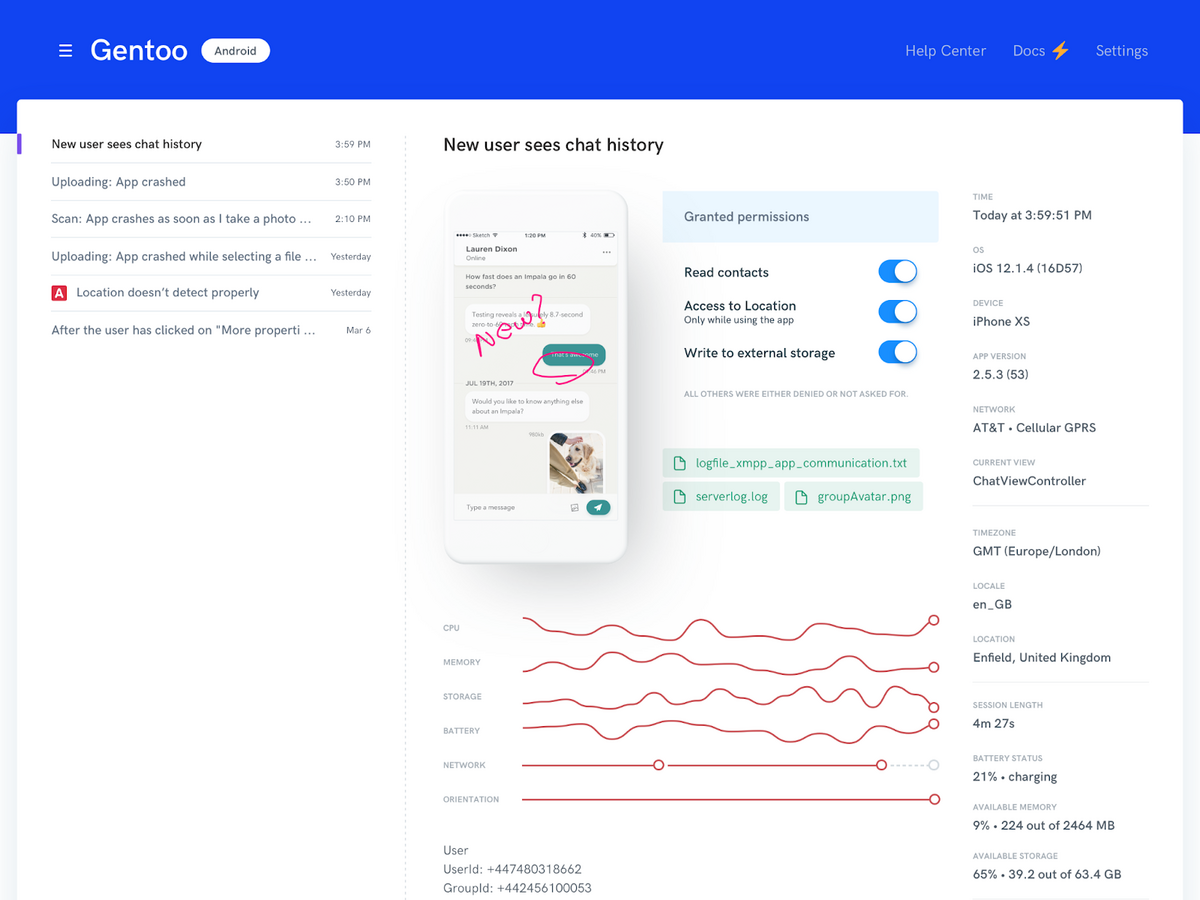
The bug report contains everything your developers require: screenshots, screen recordings, steps to reproduce, environment details, logs, and more.
When using a bug reporting tool with a debugger, your employees will have all the information they need to resolve software bugs quickly.
Debugging requires considerable code interaction—more than during typical application performance.
Normally when executing software, it runs independently, without any additional input.
However, while debugging, a developer can interact with the software during its runtime and even control the flow of code execution.
These interactive options open up countless possibilities and are a key debugging method.
The graph below shows the most common commands for controlling the code’s execution flow:
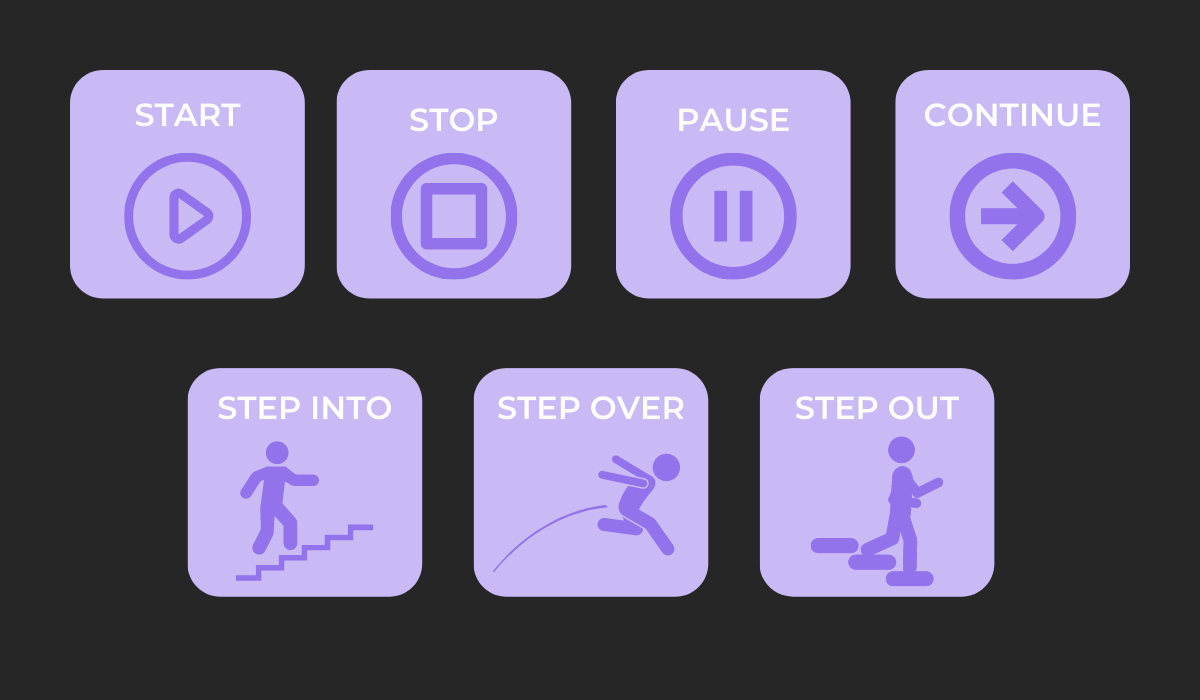
The first four commands are relatively self-explanatory. Developers start and stop the code execution and pause and continue it whenever they want.
However, the step commands are more sophisticated.
Step Into runs the code line by line, displaying every single executed line. If you call a function, you’ll also move into that function, and only continue to the next line once the function returns.
However, with Step Over, you only move within your current scope.
If there is a function call, the code returns its value, but it won’t move into the lines inside that function. Instead, you’ll simply proceed to the following line in the source code.
Finally, Step Out essentially jumps forward until the next return statement, stepping out of the current stack frame. With this command, you can easily exit functions.
Here’s a great example of how these commands work in practice:
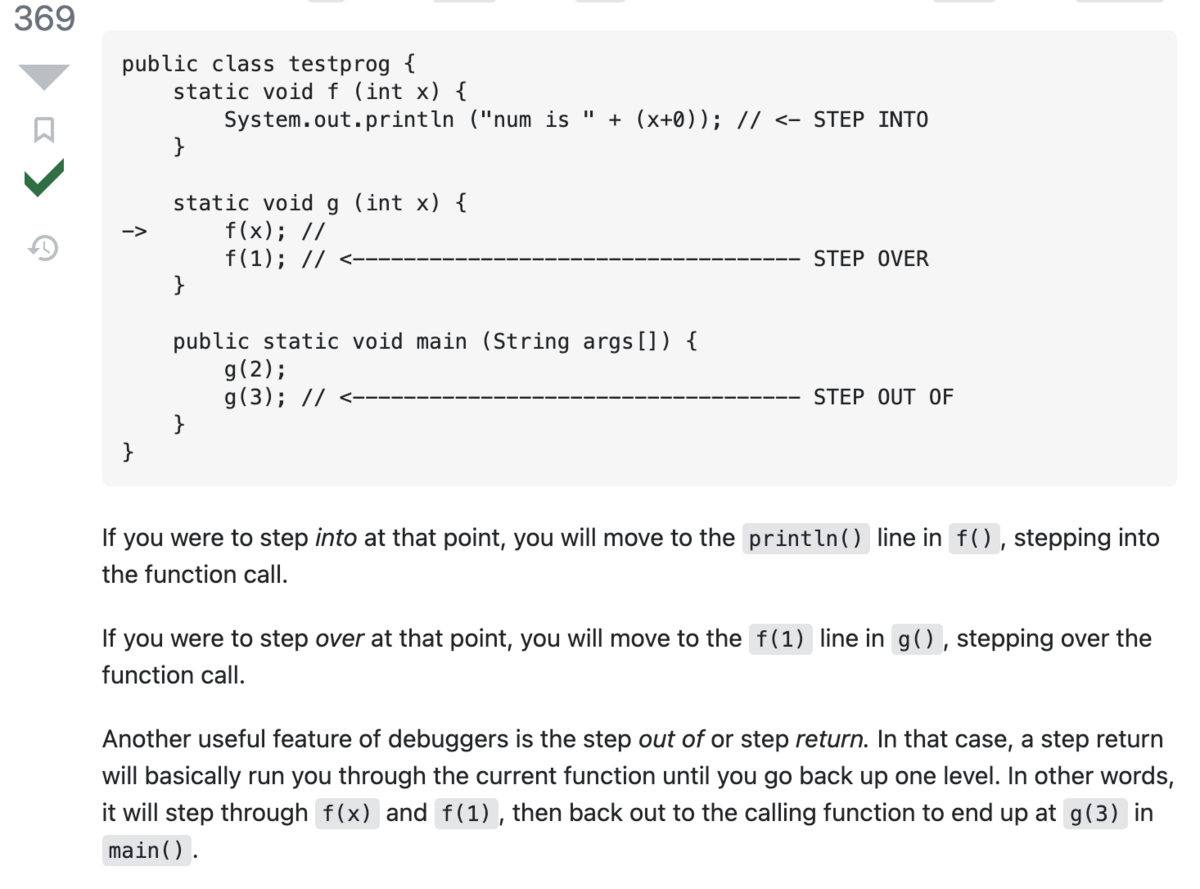
This code snippet illustrates well how stepping through the code works inside a codebase and why it’s such an invaluable debugging technique.
These stepping commands are available in most debuggers and are usually marked with the following symbols:
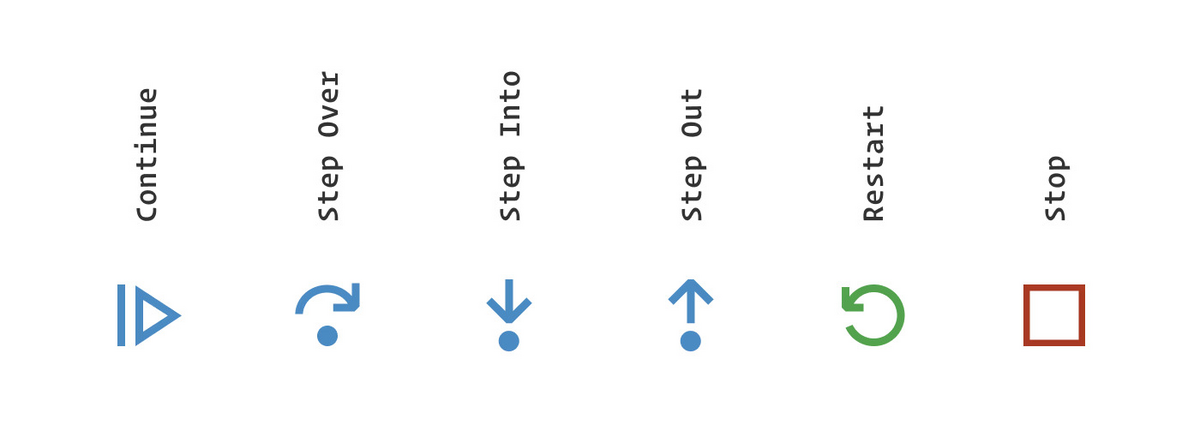
These symbols are typically located at the top of the debugger for easy access. For instance, here’s the layout in the Visual Studio Code debugger:
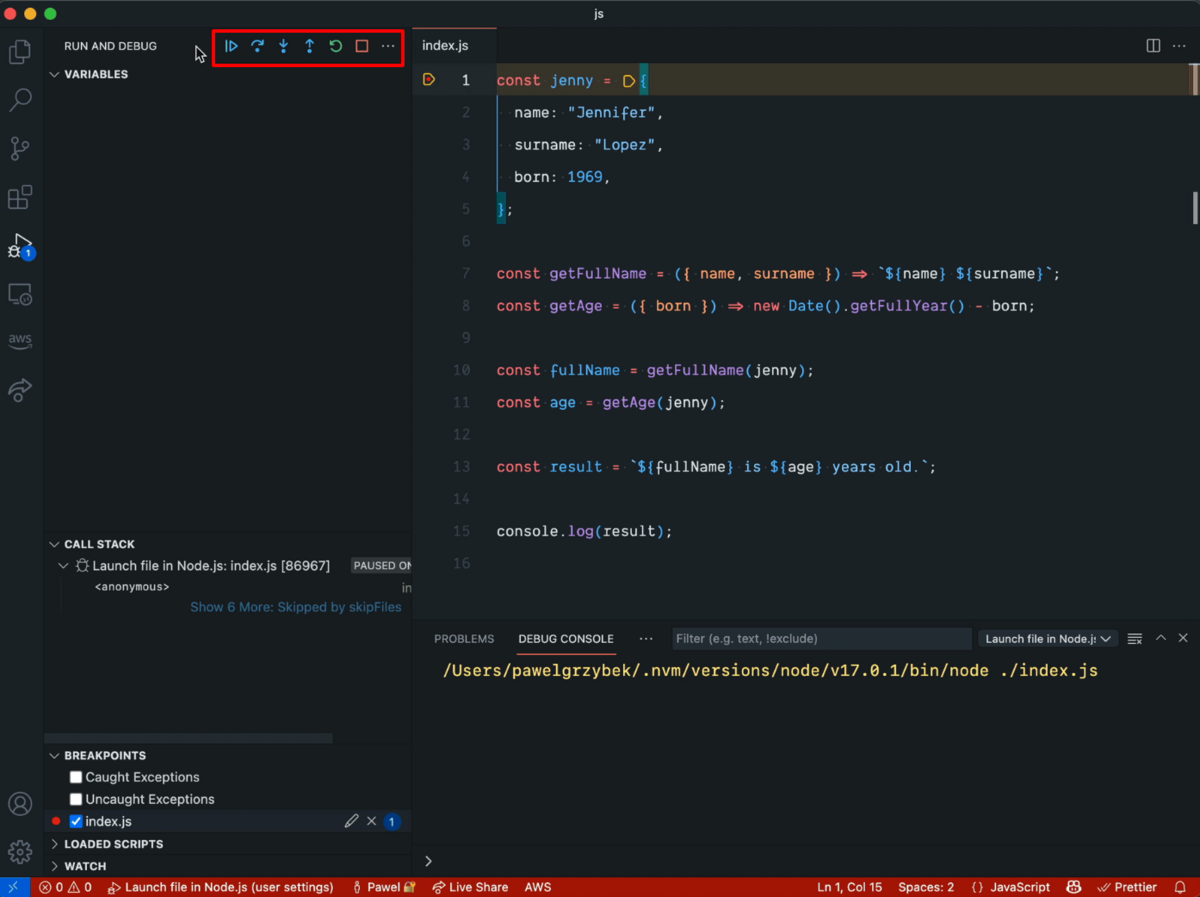
With this topmost positioning, developers will easily spot the step commands and have them readily available to step through the code.
However, stepping through the code and halting its run at certain spots becomes difficult as the codebase grows. To combat this issue, it’s worth employing breakpoints.
A breakpoint is a marker instructing the debugger to halt software execution at that particular line of code.
The symbol for a breakpoint is usually a red dot, as shown below:
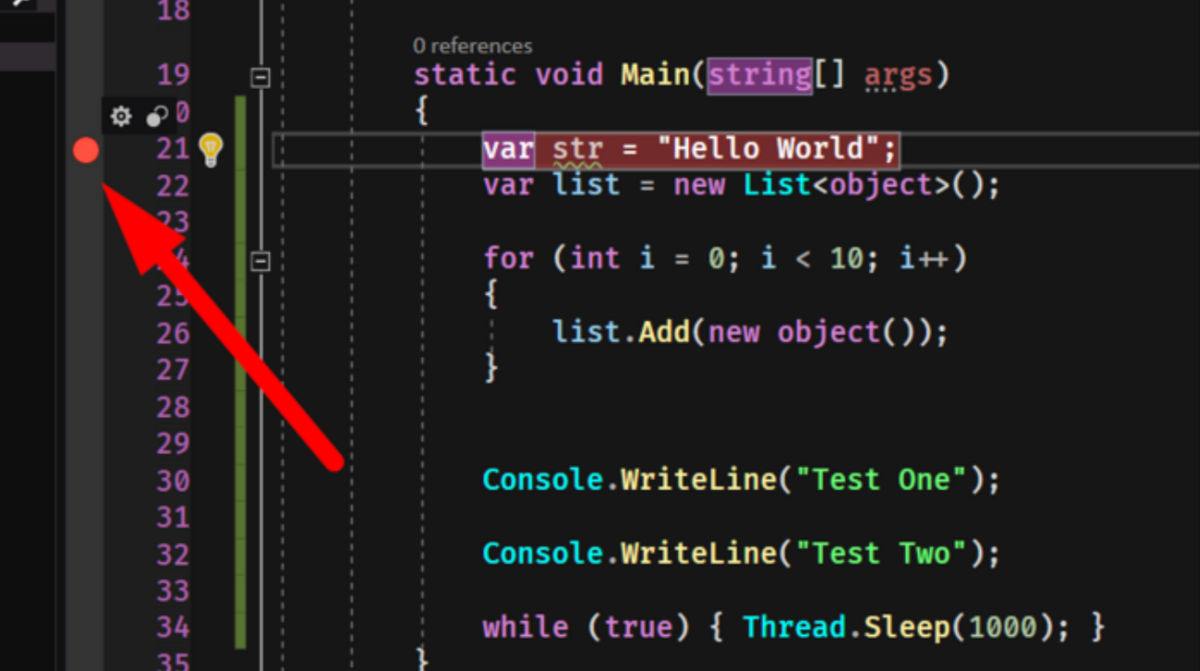
With breakpoints, you can easily divide your codebase into smaller sections, ensuring you only step through the relevant areas you need instead of traversing the entire application.
When assigned a bug and faced with a massive codebase, solving it can seem impossible. However, you have to start somewhere.
The easiest way to begin is narrowing down the problem and searching for the issue in the most likely code sections.
Consider the following snippet:
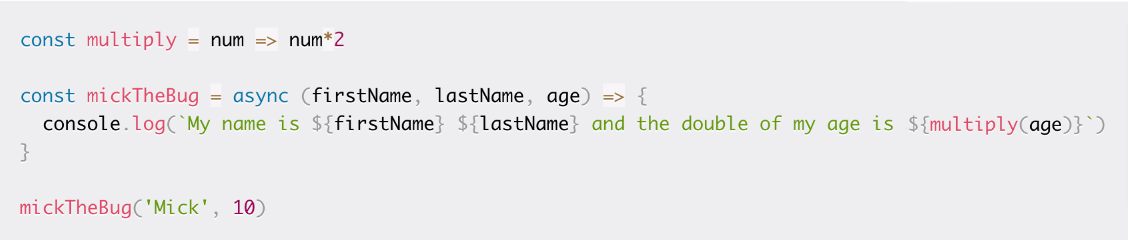
The first function multiplies a number by two, and the second prints a firstName, lastName, and the previous function’s result.
However, this result is printing where the lastName should be. To resolve this, it’s then necessary to examine the called function’s specifics.
After inspecting the function, you’ll see it expects three parameters. However, when calling it, only two were passed. That’s the entire issue—all it took was some attention to detail.
Although this is a simple example, it illustrates the principles of deducing bug origins well. Indeed, the same approach is also applied in huge codebases.
This Quora user explains how:
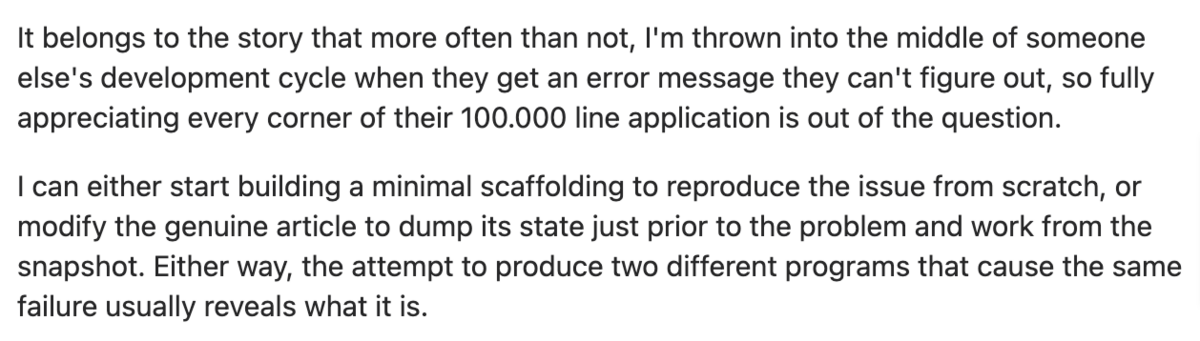
These two methods are handy for narrowing down the issue.
This developer either recreates the bug with the least necessary lines of code or examines the codebase from just before the problem appears.
Both approaches are minimalistic yet hyper-focused on the bug and likely to produce results.
However, if you’re struggling during such processes, you might benefit from talking to a rubber duck—a tried-and-tested debugging technique.
To perform rubber duck debugging, place a rubber duck next to your computer and slowly explain the bug line-by-line in plain language.
Alternatively, you can ask a very patient friend with very little knowledge of the code to stand in for the duck.
By articulating the issue in natural language, you’ll walk through all your code particulars and, hopefully, narrow down the problem.
This process usually looks like this:
With an audience so interested in your bug, you should be able to clearly explain the issue and eventually discover its resolution.
However, if the ducks can’t assist you, one last simple yet effective technique is available: reading the error messages.
Look at this example:
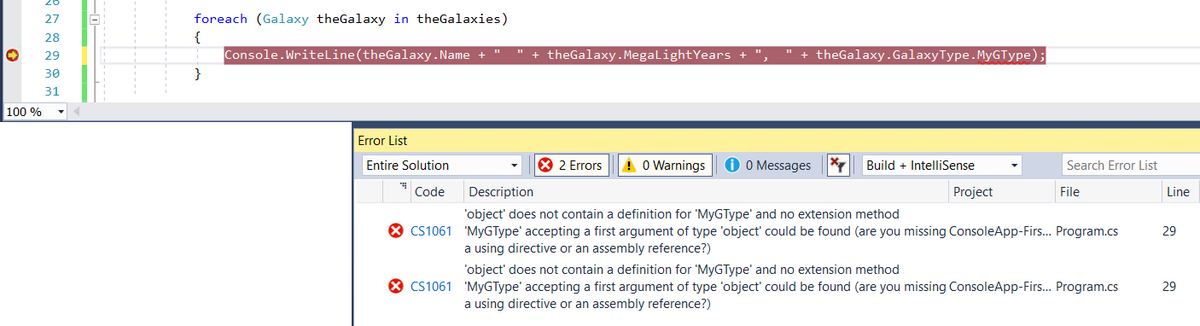
The note states the object doesn’t contain a definition for MyGType, but that the type MyGType could accept an argument for the type object.
Furthermore, the debugger doesn’t recognize theGalaxy object as an object of type GType (which has the MyGType property).
This information is a huge clue, as it reveals the type is considered an object of type object instead of type GType.
The GalaxyType property of the Galaxy class is specified as object instead of GType.
By carefully reading such error messages, you’ll discover invaluable insight regarding software operations.
This should help you narrow down the problem and, ultimately, identify the exact bug reason.
Coding is collaborative work. Developers build software as a group, with each team member assigned a particular task. The end result is a single application with countless authors.
Since writing code requires cooperation, why shouldn’t debugging be the same?
After all, you and your colleagues are working on the same project, so they also want to deliver a high-quality product.
This topic was also discussed on a Reddit thread:

Asking an employee for help often brings in a fresh perspective and new ideas you hadn’t thought of.
Your team members’ comments might even solve the bug, as per this developer’s testimony.
However, you’re not restricted to your employees for debugging advice. If all your team members are busy, there’s also a whole online community to approach.
Think of Stack Overflow. This website is a vast repository of coding assistance, and you will surely find debugging help.
Here’s a good example:
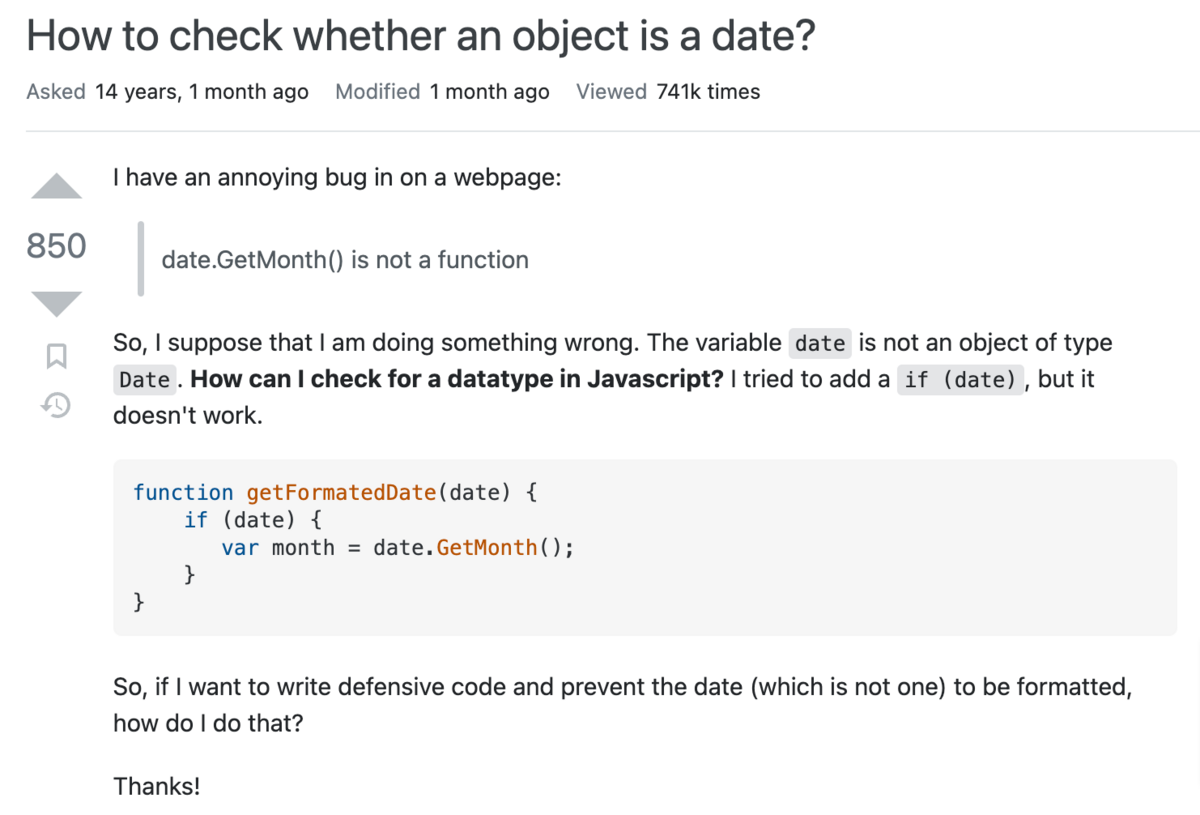
This question received 27 answers. One of these solutions is bound to help, and the user who posted the original inquiry definitely resolved the defect.
Stack Overflow is a general website where anyone can ask anything software-related.
However, if you have a debugging question related to a particular software or project, GitHub might be the better choice.

Capture, Annotate & Share in Seconds with our Free Chrome Extension!
A hosting service for open-source software, GitHub houses countless projects. If users have a problem with the software, they’re encouraged to open an issue and report a bug.
Here’s one such example:
This user has a bug specific to the Monica project. For such inquiries, GitHub is the best resource, as there’ll be an active community continuously using the software.
Indeed, this issue received a thorough response containing step-by-step instructions on a possible bug fix. As such, it’s guaranteed the original poster benefited from their reply.
However, when asking for help in such online communities, it’s essential to ask the question well.
A one-line explanation stating something isn’t working isn’t informative enough for anyone to assist. To receive high-quality help, you have to ask a high-quality question.
Generally speaking, your debugging question should contain the following elements:
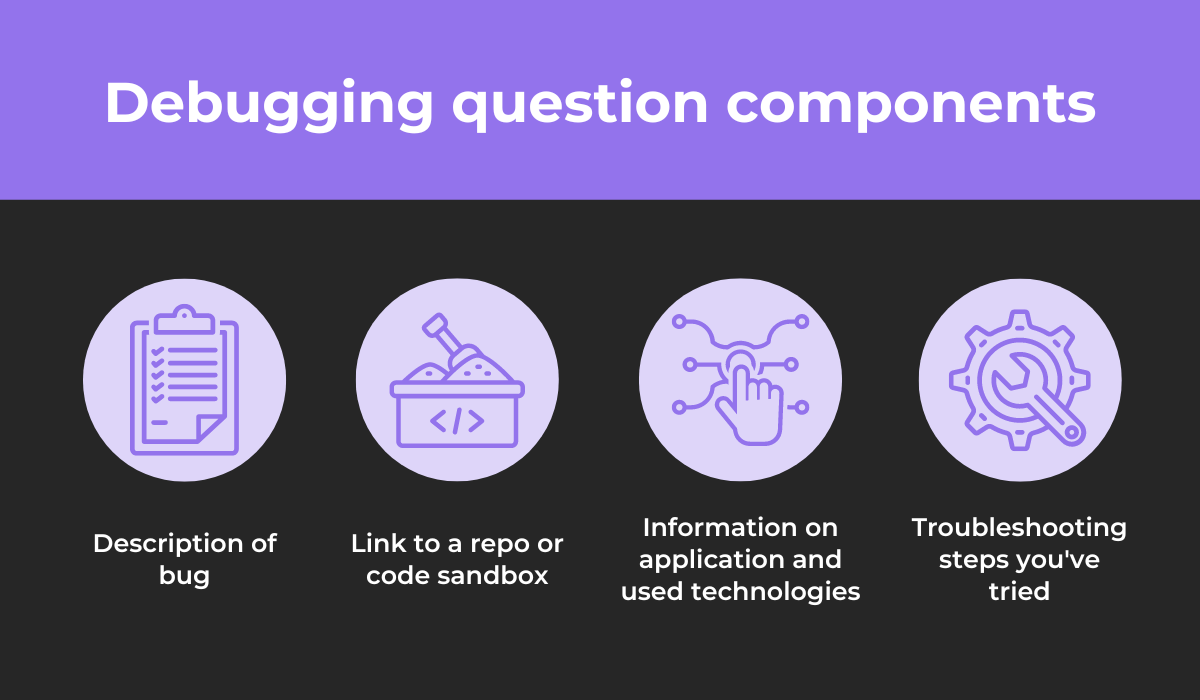
If your inquiry has these characteristics, you’re providing your fellow developers with all the resources they need to solve your problem.
However, without them, they won’t be able to help much.
Consequently, make your debugging questions as thorough as possible, and you’re much more likely to receive the assistance you need.
Compared to coding, app debugging can be long, arduous, and unfulfilling. After all, who wants to dissect their code and resolve their programming errors?
It’s much simpler—and more enjoyable—to build software instead.
Nevertheless, debugging is a prerequisite for functioning software. To make the process easier, it’s a good idea to employ several recommended practices.
These include using a debugger, stepping through the code, asking others for help, and similar.
By adopting these methods, your developers should be more efficient at debugging.
Consequently, your software will be released more quickly, and your product’s overall quality is guaranteed to rise.
From internal bug reporting to production and customer support, our all-in-one SDK gets you all the right clues to fix issues in your mobile app and website.
We love to think it makes CTOs life easier, QA tester’s reports better and dev’s coding faster. If you agree that user feedback is key – Shake is your door lock.
Read more about us here.

Add to app in minutes

Doesn’t affect app speed

GDPR & CCPA compliant

Unexpected things pop up
Just like bugs in your app or web 🐛 Fix them now with just one reporting tool.