
Recommended
9 helpful tips for effective app logging

Logging isn’t just about error messages and stack traces.
It plays a pivotal role in understanding the intricate workings of the application.
That is why we’ll delve into seven crucial types of logs that hold the key to unlocking a comprehensive understanding of the application’s behavior and performance.
By analyzing these logs, you’ll gain a broader perspective of how the application operates, uncloaking its hidden patterns, resolving issues, and optimizing its performance.
Stay tuned!
Table of Contents
We’ll start with request logs, which encompass records of all incoming requests initiated by users as well as the subsequent responses that the application sends back to the user.
You can think of them as a specialized subset of server logs because the transfer of information occurs via the server.
In simpler terms, whenever users interact with the app, whether it be through actions such as logging in or out or some other engagement, these logs archive a detailed account of their requests and how the app responds.
Consequently, request logs reveal a host of invaluable data.
For starters, they contain specifics about the HTTP method employed in each request, including GET or POST methods.
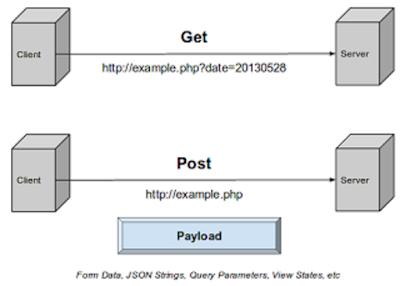
As depicted in the above diagram, GET requests are utilized for retrieving data from the server, while POST requests are employed for sending data from the user to the server.
The request log also evaluates the status of these requests, which allows you to ascertain whether the request was successful or not.

Get unreal data to fix real issues in your app & web.
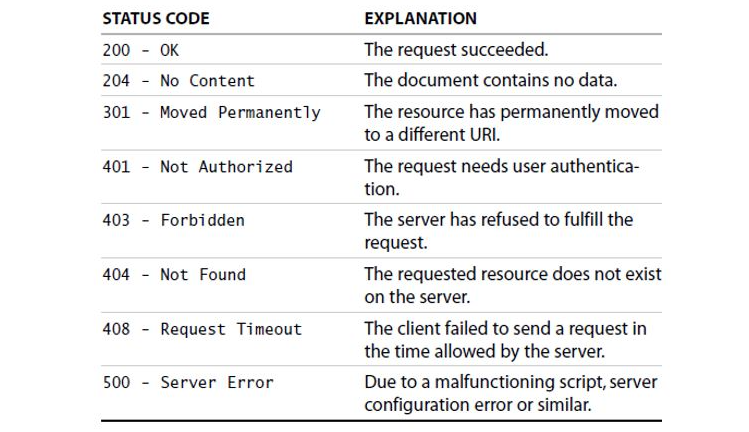
For instance, a status code of 200 indicates that everything is functioning correctly, while the notorious 404 is assigned to “not found” errors.
(Below is a list of other statuses you may encounter when dealing with request logs.)
Other types of valuable data, such as user ID, the URL that users requested, their IP address, the date and time of the request, and other server information, can likewise be incorporated into the request.
For instance, in the image below, you can see that the user “jbloggs” accessed the server on October 12, 2021, at 1:55 PM.

The user accessed the server’s status page, and the amount of data transferred was 2457 bytes in size. However, the page was not found, resulting in a 404 error.
This example shows that the information contained in request logs can provide a wealth of important data about the performance and behavior of the application and user interactions.
Ultimately, this makes request logs essential for monitoring, debugging, and troubleshooting activities.
While request logs may grant you an important glimpse into the interaction between the user and the server, change logs play an equally vital role because they capture the modifications made to the application.
In simpler terms, whenever changes are made to the data within the application, it’s the change logs that document and retain every single alteration that occurs.
These changes can encompass various activities, such as introducing a new feature, resolving a bug, launching a new version, or any other action that deviates from the previous iteration of the application.
For instance, the change could also involve adding the capability to display non-standard characters in the app, as depicted in the image below.
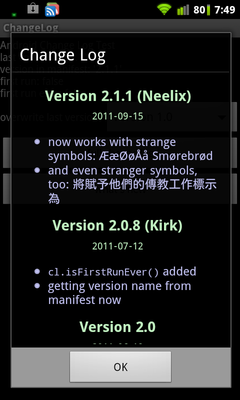
Change logs typically contain key information that facilitates understanding how and why the modification occurred, such as:
What is important to note here is that change logs are organized chronologically, so developers and system administrators can track the progress of the project and discern exactly what and when has been altered, fixed, or added.
As such, the data provided by these logs is invaluable because it keeps them informed about all of the modifications made to the app.
Next up on our list are availability logs, a special type of log designed to trace the app’s accessibility.
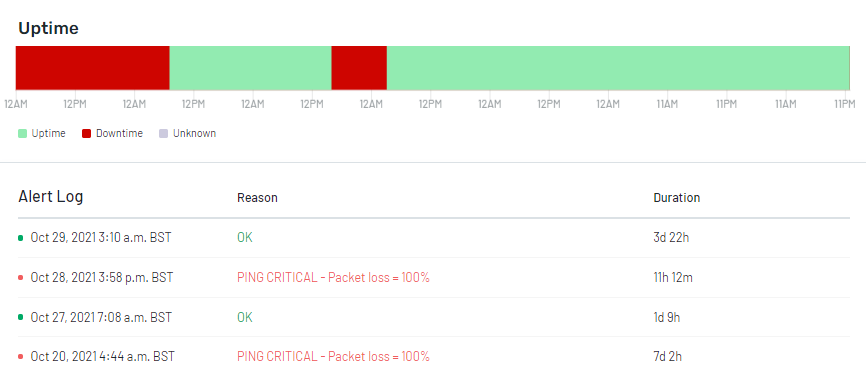
Each time the app encounters disruptions, downtime, or outages, this will be recorded in the availability logs.
Consequently, they provide specifics about how frequently and for how long the app is available or unavailable to users (as shown below), which helps developers and system administrators detect potential issues and areas for refinement.
For example, if the application consistently slows down, let’s say every Monday morning, thanks to availability logs, they can pinpoint the cause (the app may be in scheduled maintenance mode at that time) and take the required steps to address the issue.
Availability logs typically record data such as:
Due to the detailed record of events that they provide, developers and system administrators can quickly take a sneak peek at the logs, diagnose the problem, and decide the best direction to rectify it.
All in all, availability logs are a nice addition to request and change logs.
Together, they provide a broader picture of the weak points of the application and enable faster troubleshooting.
As the name suggests, resource logs provide a plethora of data about how an application utilizes its resources.
But what do app resources encompass, you may wonder?
Broadly speaking, they primarily refer to the following components:
That means that resource logs will jot down how much of these resources the application uses at any given time.
This way, developers and system administrators can discern patterns, identifying performance bottlenecks and other hindrances that demand attention.
For instance, the image below shows CPU usage in percentage during a certain period of time.
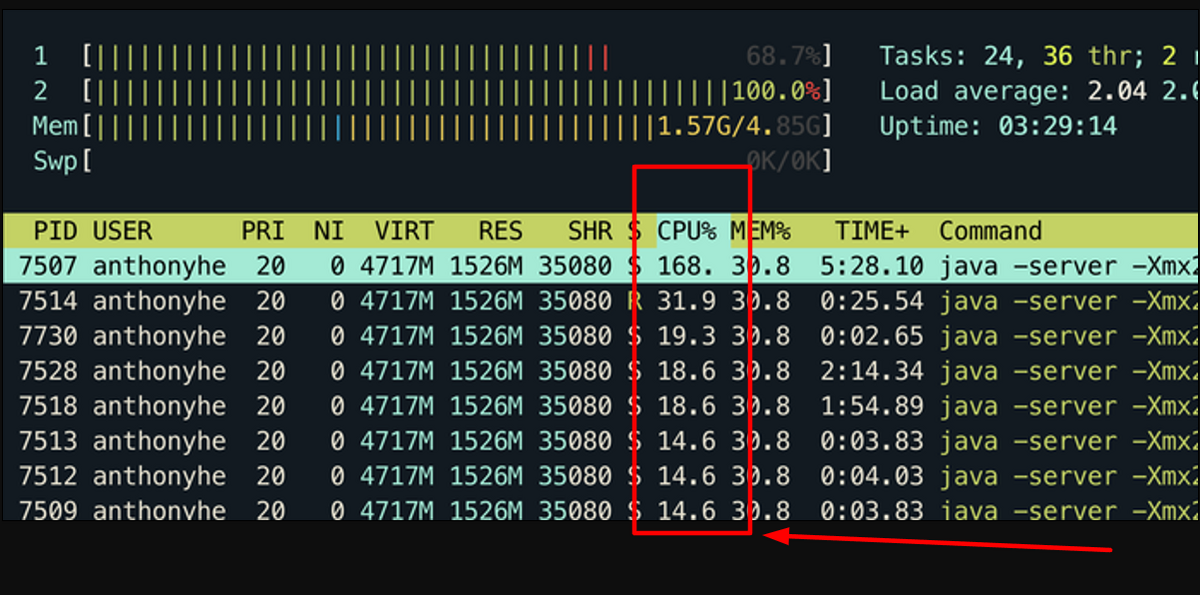
By inspecting the data outlined in the logs, developers can draw conclusions about whether the usage deviates from normal and take precautionary actions if necessary.
Yet, one of the key advantages of resource logs lies in their ability to uncover areas where resources are being underutilized or overutilized.
For instance, if an application consistently guzzles more memory than necessary, administrators can employ resource logs to detect the cause and implement measures to optimize the performance.
Resource logs also prove invaluable when troubleshooting issues related to resource usage.
In cases of sluggish performance or crashes, administrators can turn to resource logs to detect any memory leaks or other culprits that may be behind the problem.
Error logs represent a category of logs designed to trail errors, warnings, or exceptions that arise while an application is in operation.
They document the particulars of what went awry, precisely when it occurred, how critical the error was, and any pertinent context or details that assist developers or system administrators in remedying the issue.
Simply put, error logs will give you enough data to start troubleshooting.
The data contained in error logs can include elements such as:
For instance, if a user tries to submit a form with invalid data, the application might, in response, log an error indicating that the data was invalid and provide additional insights regarding the mishap.
Similarly, an error event may be generated when the disk lacks sufficient space to perform an action, as shown below.
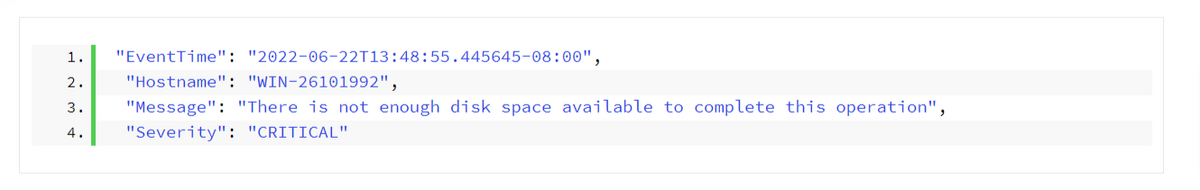
Besides the description of the error, the timestamp and hostname are displayed, as well as the critical severity level, indicating the seriousness of the issue.
In both cases, the error log will give developers and system administrators the necessary grounds to start deciphering and rectifying the issue.
Equally important, by analyzing error logs, they can discern trends that may indicate underlying issues that may require attention.
Protecting an application from threats goes beyond simply safeguarding sensitive user data. It also encompasses preserving the user’s trust and the company’s reputation.
That’s why system administrators pay special attention to threat logs.
These logs serve as a valuable resource for monitoring security attacks, detecting incidents, and enhancing overall security.
The data typically found in threat logs includes:
For instance, the image below illustrates that the system has encountered a spyware attack.
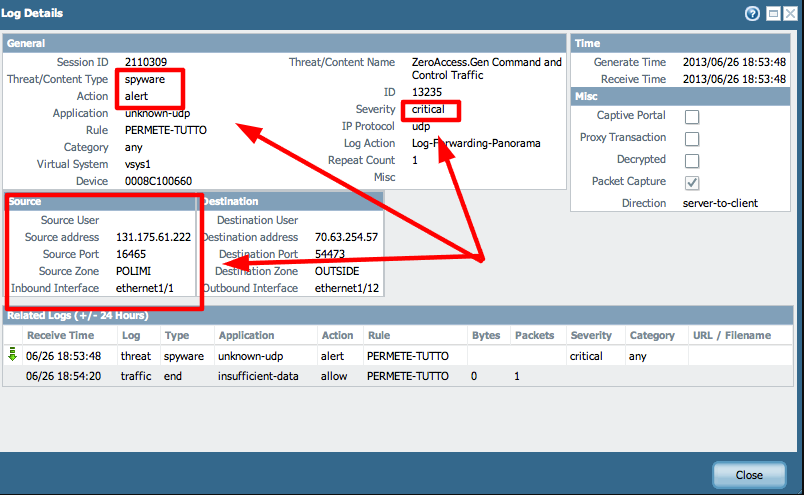
An alert has been generated to notify administrators about this severe attack, and technical details regarding the attacker have been provided as well.
One of the key benefits of threat logs is the capability to monitor potential threats in real time.
By tracking activity on the app’s system, administrators can identify threats as they occur and promptly respond to mitigate them.
For instance, if a threat log indicates that an attacker is trying to break into a system, administrators can employ countermeasures to prevent further harm—like blocking the attacker’s IP address, sending alerts to the administrators or disabling compromised user accounts.
By tracking and analyzing threat logs, administrators can recognize common attack vectors, identify vulnerabilities in the app, and take measures to prevent future attacks from occurring.
Developers strive to ensure that their applications run smoothly and flawlessly from a technical standpoint.
However, because human behavior is so inherently unpredictable, they can’t accurately anticipate how users will interact with the application, the actions they may undertake, or the hurdles they may encounter along the way.
To address this uncertainty, user activity logs play a pivotal role by tracking and recording the actions and behaviors of users within an application.
The specific data contained in user activity logs generally includes information such as:
In addition to these fundamental data points, user activity logs can also provide more detailed information about specific actions.
This could include specifics like the fields that were updated or the specific sections of the application that were accessed.

Capture, Annotate & Share in Seconds with our Free Chrome Extension!
As such, these logs serve as a critical tool for monitoring and auditing user activity within the application.
Furthermore, user activity logs can be utilized to track user behavior and enhance the user experience.
For example, if your app maintains user activity logs, you can identify which parts of the app users spend the most time on, which features are frequently utilized, and which parts or features are causing errors or difficulties for users.
This information can assist you in optimizing underutilized parts of your app and resolving any issues that may arise.
So, there you have it—seven categories of logs that hold significant value in terms of tracking and documenting, as they enable troubleshooting, monitoring, security safeguarding, debugging, and various other purposes.
Each of these logs acts as a chronological breadcrumb, leading developers and system administrators toward a deeper comprehension of the application’s behavior and performance.
These seven distinct logs represent merely a fraction of the possibilities available for your own logging endeavors.
Nevertheless, when combined and implemented diligently, they will provide you with more than enough data to address any issue that the app may encounter.
From internal bug reporting to production and customer support, our all-in-one SDK gets you all the right clues to fix issues in your mobile app and website.
We love to think it makes CTOs life easier, QA tester’s reports better and dev’s coding faster. If you agree that user feedback is key – Shake is your door lock.
Read more about us here.

Add to app in minutes

Doesn’t affect app speed

GDPR & CCPA compliant

Unexpected things pop up
Just like bugs in your app or web 🐛 Fix them now with just one reporting tool.