Recommended
A guide to debugging your code

App debugging, while essential, can be a daunting aspect of software development.
However, by improving their debugging ability and knowledge, developers can streamline the process and use their debugging skills to significantly improve the quality of the apps, delivering products that will satisfy end users.
Our article aims to provide actionable insights to help you optimize app debugging and aid teams in becoming more proficient in addressing software issues.
We will explore six valuable tips, from familiarizing yourself with common errors to leveraging debugging tools and techniques.
Let’s begin by delving into the importance of recognizing common errors and how this knowledge can aid in efficient debugging.
Table of Contents
To improve at debugging, developers must have a strong understanding of application errors.
Being effective at app debugging requires thorough knowledge.
Therefore team leads should encourage their developers to familiarize themselves with common app errors, so the developers can quickly and easily identify the issues and work at resolving them.
Some of the most commonly encountered types of errors are shown in the following image.
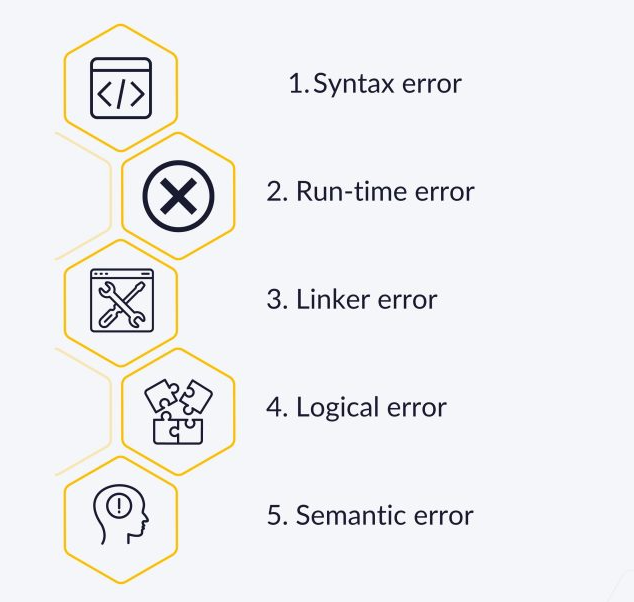
These errors can occur both at the compiling stage, such as syntax, semantic, and linker errors, and during program execution, where run-time and logical errors manifest.
When developers have an in-depth understanding of the contexts in which the errors arise, they are better equipped to tackle them effectively.
More specifically, this knowledge can enable developers to avoid making these errors while coding an app or detecting them more quickly during debugging, as they will know what to look for.

Get unreal data to fix real issues in your app & web.
In addition to possessing thorough general knowledge of error types, developers should be well-versed in the common error messages that can appear.
Each programming language has its own error messages, so teams should understand the ones for the language they use.
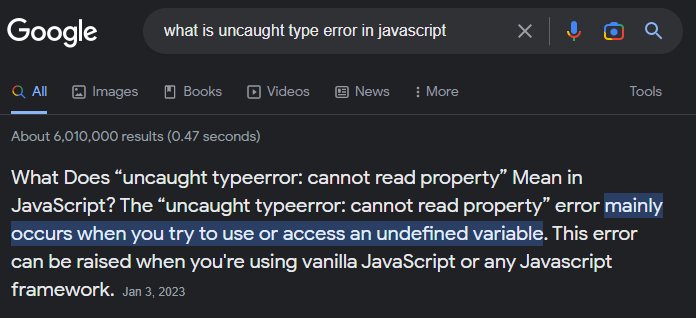
For example, these are some errors frequently encountered in JavaScript.
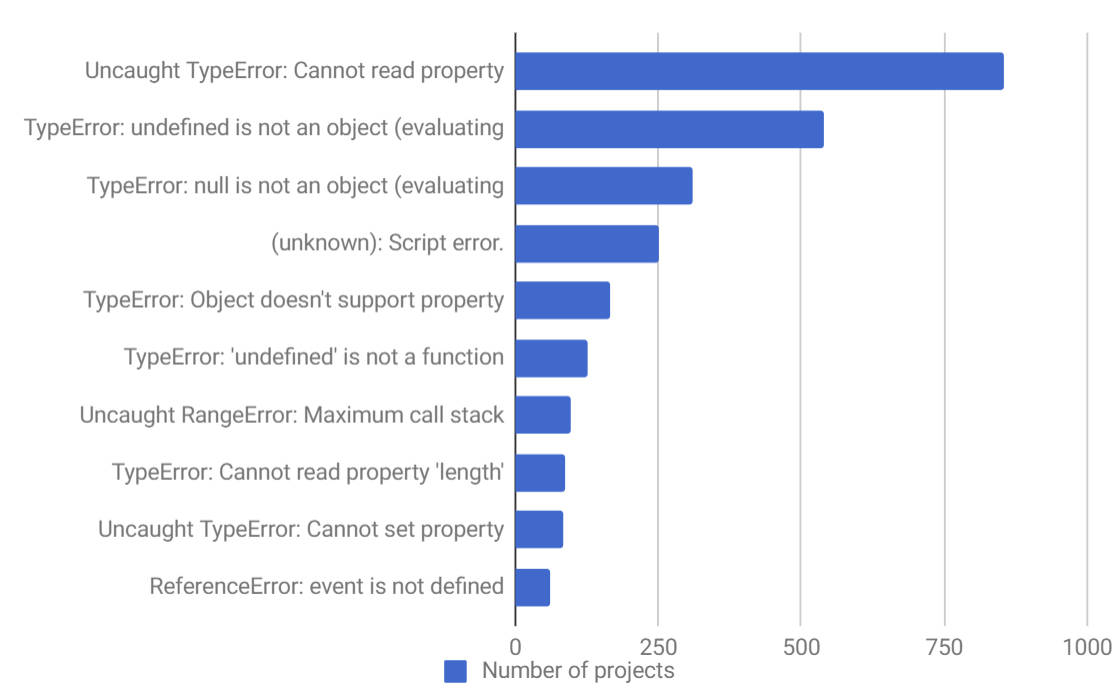
The above image indicates how often these errors occur, based on the number of projects they were detected in out of 1,000 real-world projects.
So, if your team codes in JavaScript, they will encounter the error depicted in the next screenshot most often.
Suppose the team is familiar with the Uncaught TypeError.
In that case, they can more quickly identify the source of the error and take steps to resolve it, such as modifying the code or implementing a workaround.
The same logic applies to other common errors, as recognizing them and understanding their causes will enable developers to be more efficient and effective at debugging their apps.
Sometimes, a new developer can be unfamiliar with some of the common error types or encounter a specific problem they need clarification on.
The first action they can take in this situation is to look up the problem online.
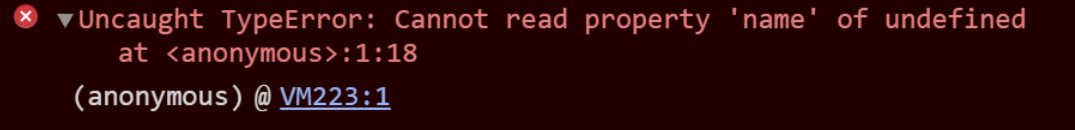
Say a junior developer wants to learn more about the error we mentioned earlier, Uncaught TypeError.
In this case, they can perform a simple Google search and quickly get helpful information that can give them an overview of the error.
The above image shows a Google Featured Snippet showing a brief description of the error we mentioned.
These snippets of content appear on the top of the results page and provide users with a quick answer to their query, giving a concise and direct answer from high-ranking and relevant websites.
If developers want to dive deeper into the error or encounter an issue that doesn’t have a simple answer, they can enter the full error message in the search bar and look at some of the search results.
It’s good practice to visit the links from trusted and reliable sources to get the most relevant debugging information.
Some of these websites include the following:
One of the most popular options for developers is Stack Overflow which its creator, Jeff Atwood, describes on his blog:
It is by programmers, for programmers, with the ultimate intent of collectively increasing the sum total of good programming knowledge in the world. No matter what programming language you use, or what operating system you call home.
Returning to the Uncaught TypeError, looking through the search results can take you to this Stack Overflow page where a user asked how to avoid cannot read property of undefined errors.
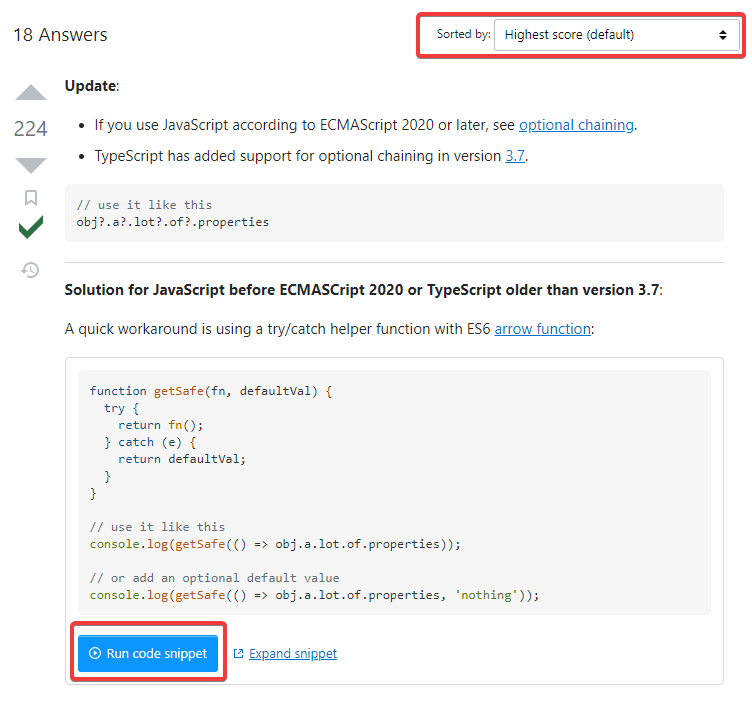
As depicted in the image, 18 people have responded to this user’s question, allowing a developer browsing the answers to sort them by the highest-ranking response and find the most helpful solution.
Moreover, any code shared on StackOverflow can be executed and verified on the spot, ensuring its effectiveness in addressing the issue at hand.
In conclusion, utilizing Google searches and various online resources like StackOverflow provides developers valuable insights and solutions to tackle their debugging challenges more effectively.
While searching for answers online can be helpful, developers often need more comprehensive techniques to tackle complex issues.
Mastering debugging techniques is essential for developers as it streamlines the bug-fixing process and enhances overall efficiency.
By employing a diverse range of proven techniques, developers can quickly identify and resolve issues, resulting in a more consistent and successful app debugging practice.
More specifically, developers should be familiar with some of the techniques illustrated in the following image.
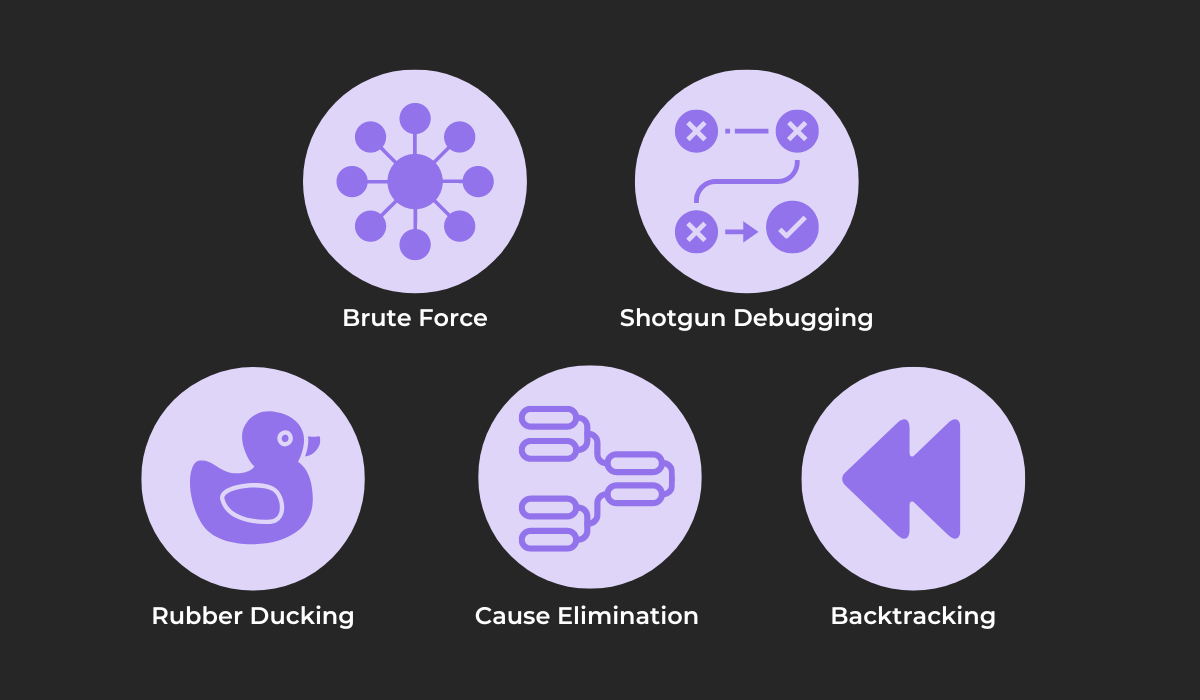
Brute force debugging is the simplest method on the list, and it involves systematically checking each line of code or testing every possible input combination to locate and fix a bug.
As you may guess, it’s a tedious and often ineffective process, but it’s useful for projects with a smaller codebase.
Closely related to this method is shotgun debugging, which Technopedia defines like so:
Shotgun debugging is the process of introducing undirected changes into any software to be tested in the hope of perturbing bugs out of existence.
This is a trial-and-error approach where developers make multiple code changes, hoping that one of them will fix the issue.
Similar to using brute force to come up with a solution, this is not a very effective technique as both methods can be time-consuming and less efficient compared to other techniques.
The next three techniques in the illustration above are significantly more effective and useful. Consider rubber ducking or rubber duck debugging.
The technique is so effective that one employee writes they received a rubber duck during onboarding.

A quite simple and straightforward technique, rubber ducking involves developers explaining their code to an inanimate object or another person.
This way, they are forced to break down their thought process and logic, which often helps them identify errors or inconsistencies they might have overlooked.
As describing all other useful debugging techniques is not within the scope of this article, you can read more about them in our debugging guide.
All in all, a complete knowledge of debugging techniques is necessary for developers to pinpoint and resolve issues, so it’s crucial for them to invest time in learning and mastering them.
Successful app debugging involves developers asking themselves various questions.
This process requires developers to be inquisitive and methodical, probing each aspect of their code and analyzing their debugging practices.
Some questions they can ask themselves are shown next.
Asking these questions can lead to a better understanding of their strengths and weaknesses during debugging, identify areas for improvement and adopt strategies to optimize their workflow.
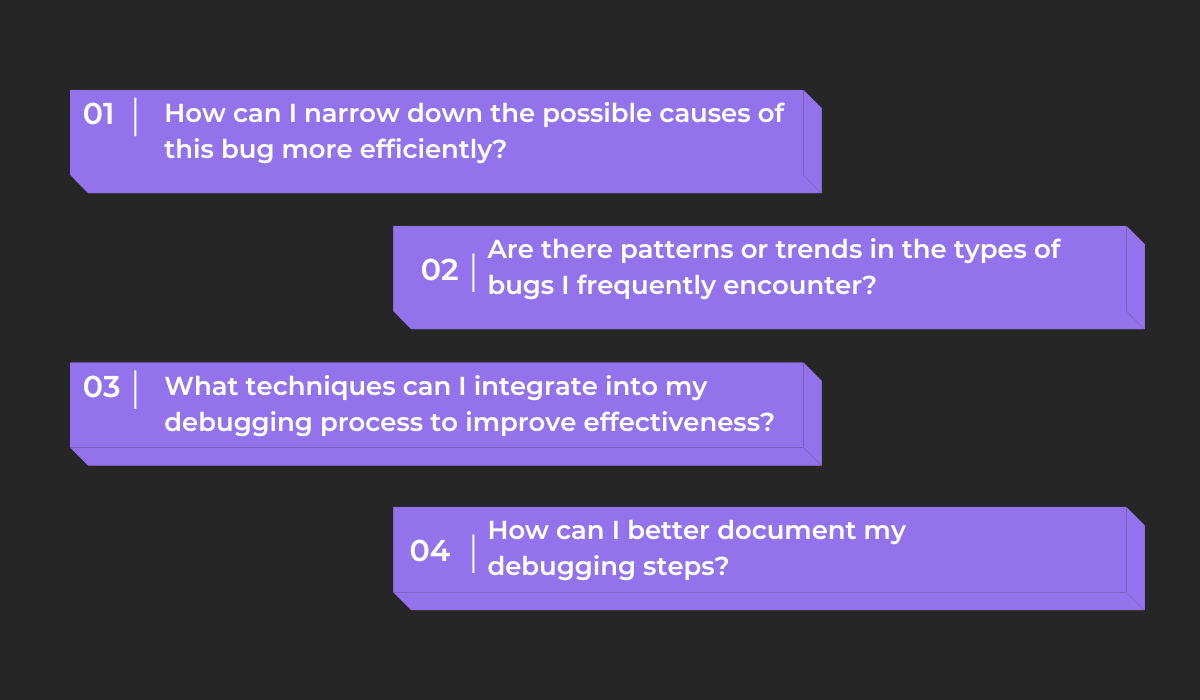
To get inspiration, take a look at the Twitter account of blogger Julia Evans, where they write various programming and debugging tips, some of which are made in a question-and-answer format.
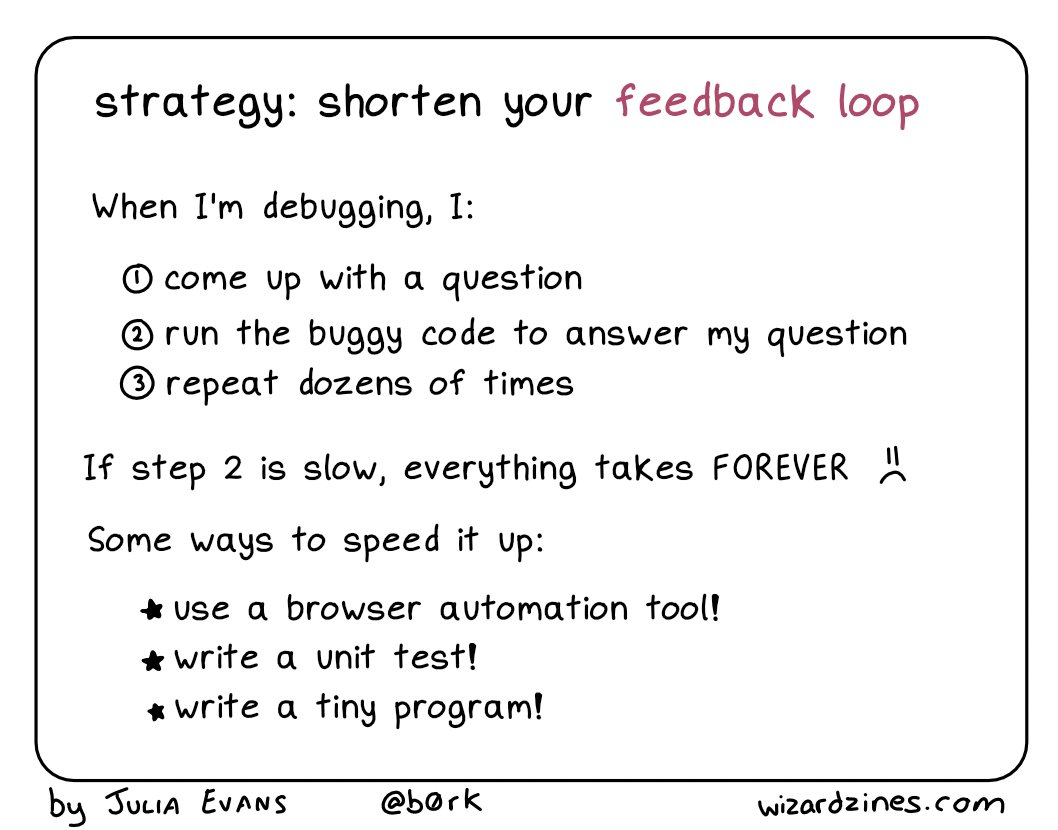
As you can see, Julia created the above debugging strategy when they assessed their debugging process and devised methods for speeding it up.
Developers can follow the same example and actively question their methods, fostering a more efficient and effective debugging process.
Besides these general questions a developer can ask to improve their debugging process, some more specific questions can be asked during certain debugging techniques.
Cause elimination, for instance, is a debugging technique that involves systematically eliminating potential causes of an issue until the actual cause is found.
Take a look at a visual representation of this process in the following image.
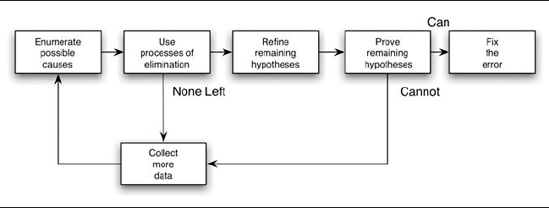
Also known as debugging by deduction, this process requires developers to ask themselves various questions to narrow down the list of possible causes of a bug until the actual cause is found.
The questions that can be asked include the ones listed below:
Overall, asking questions is a great practice for optimizing the debugging process and as a part of certain debugging techniques, so developers should consistently examine their own practices and put their debugging knowledge and skills to a test.
Asking oneself the right questions is necessary, but oftentimes a highly experienced coworker can be of better help to junior developers than anything else.
Experienced developers have already faced and resolved numerous app debugging challenges, and they can impart their accumulated knowledge and strategies to other developers.
A team lead can facilitate the exchange of knowledge by setting up a peer-to-peer learning environment and creating an effective learning loop, depicted below.
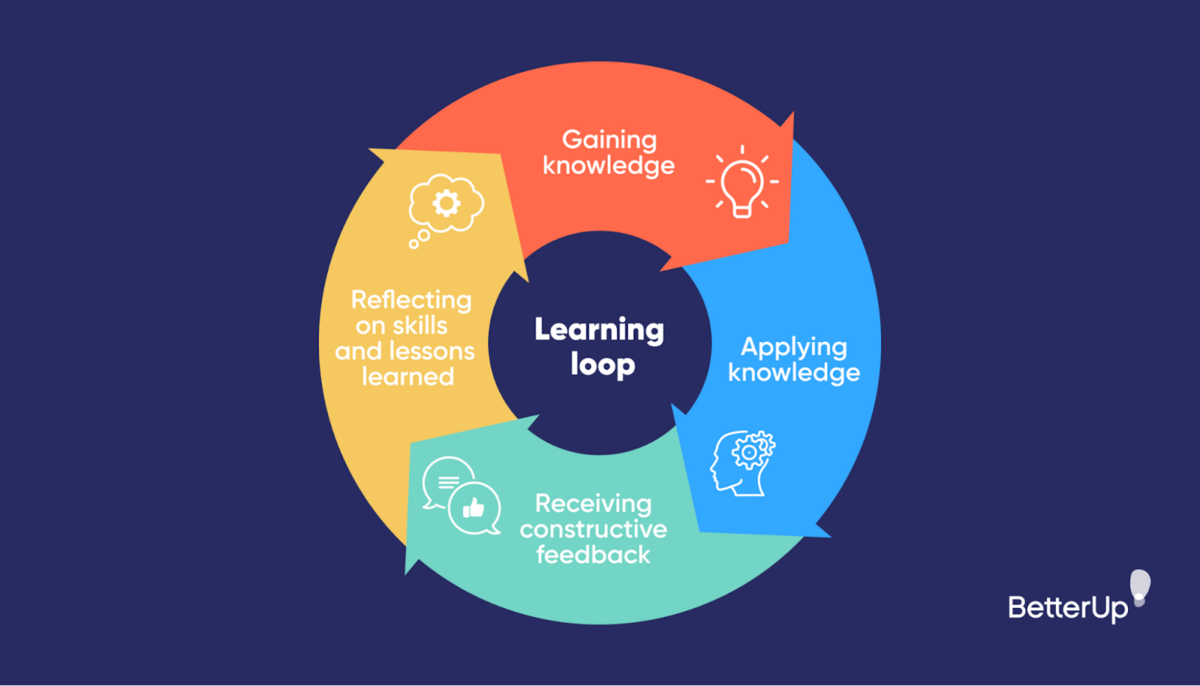
A more experienced colleague can teach junior developers the best practices and share their own debugging experiences.
The junior developers can then apply these insights to try and debug an application and explain their thought process as they do so.
The senior developer will then give feedback to the junior developer on their work, starting the learning process again.
These peer-to-peer learning sessions can be designed in any way you deem appropriate.
For example, you can ask experienced developers to help and instruct their colleagues on the app debugging process outlined in the image below.
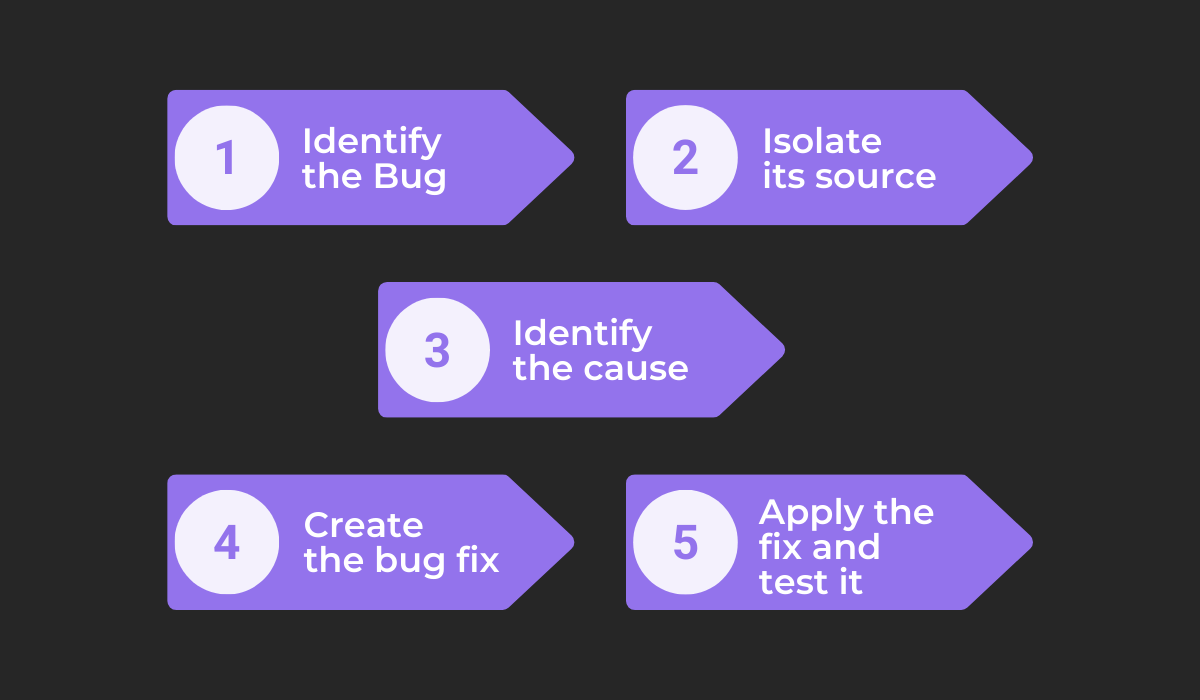
Senior developers would answer certain questions about the debugging process like the following:
Through this collaborative approach, junior developers can gain valuable insights and practical advice, enabling them to tackle various debugging challenges more effectively and efficiently.
Learning from coworkers is a valuable way to improve app debugging skills, and fostering a peer-to-peer learning environment is one practice that you might consider employing.
Despite debugging being a manual process, this fact doesn’t mean that developers can’t take full advantage of all available tools.
Debuggers are invaluable software solutions that allow developers to closely examine and control the execution of their code, helping them locate and fix any issues reported to them by testers.
Take a look at the following three tools shown below.
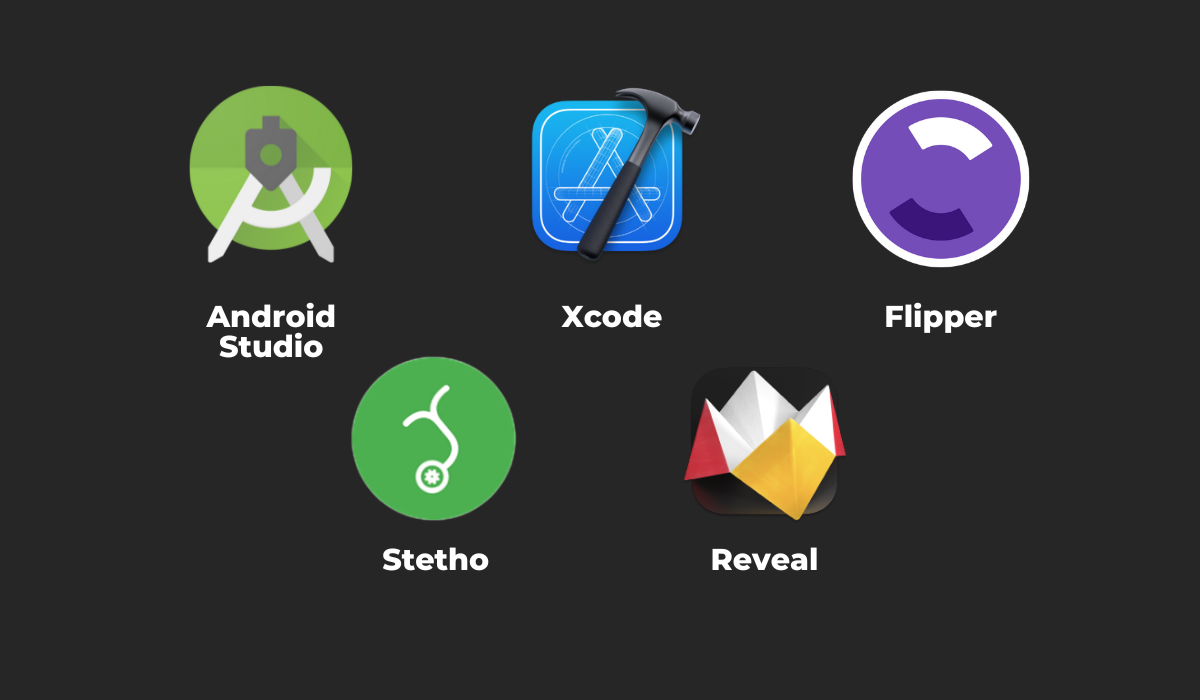
Android Studio and Xcode are not debuggers themselves but integrated development environments that come with built-in debugging tools offering various features to aid developers, some of which include the following:
These two platforms are often sufficient enough for debugging, but for more advanced options, you can consider the next three tools, Stetho for Android, Reveal for iOS applications, and Flipper, which can be utilized by developers across both platforms.

Capture, Annotate & Share in Seconds with our Free Chrome Extension!
In addition to debuggers, several other tools can enhance the debugging process.
One such tool is Shake, our very own bug and crash reporting solution that streamlines debugging by assisting teams in generating comprehensive bug reports.
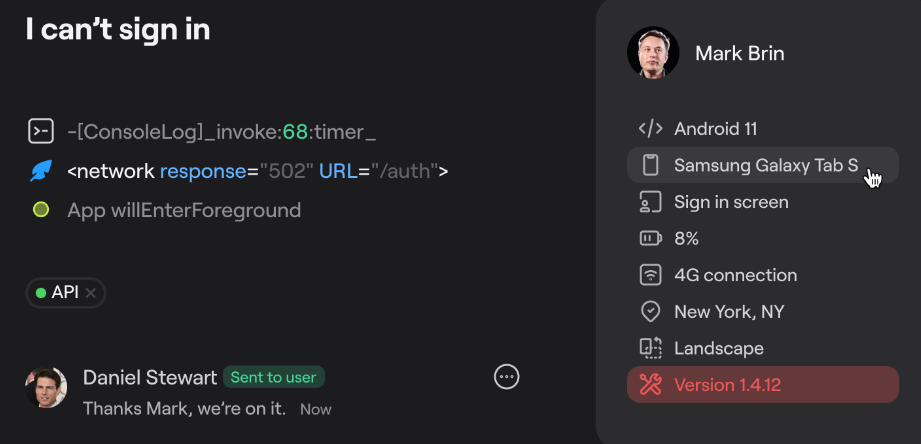
These reports come with a wealth of automatically attached data, such as the device environment specifications, network details, the user’s activity history, and much more.
These metrics can provide developers with valuable information guiding them to pinpoint a bug’s cause and work toward a resolution.
Using debuggers and other complementary tools such as Shake can greatly optimize app debugging, so you might take a look at the ones that would be most useful for your projects.
Throughout this article, we’ve explored the realm of app debugging, uncovering six vital tips to help you elevate your team’s debugging skills and streamline this process.
We trust that these insights and tactics have equipped you with the knowledge needed to guide developers in tackling software issues more effectively and confidently.
By implementing these strategies, you’ll enhance the quality of the app debugging process, save time, and help create a better app as a result.
Remember that fostering a culture of continuous learning, adaptation, and refinement is crucial in cultivating a highly skilled team of debugging experts.
So, start following some of these tips and watch the number of app bugs start decreasing.
From internal bug reporting to production and customer support, our all-in-one SDK gets you all the right clues to fix issues in your mobile app and website.
We love to think it makes CTOs life easier, QA tester’s reports better and dev’s coding faster. If you agree that user feedback is key – Shake is your door lock.
Read more about us here.

Add to app in minutes

Doesn’t affect app speed

GDPR & CCPA compliant