
App user behavior: 7 metrics to track
Key Takeaways:
You want your mobile app to be both profitable and a user favorite.
But to reach this coveted goal, you’ll need to roll up your sleeves and dig into all the data that shows how your app works in real time with real users.
That’s why in this article, we’ll show you why tracking and analyzing app user behavior is crucial if you want to outshine competitors, wow users, and, most importantly, grow your business.
Table of Contents
Understanding how users interact with your app gives you the evidence you need to make better technical and business decisions.
With quantitative (e.g., user count, retention rates) and qualitative user behavior data (e.g., social mentions, in-app surveys), you get a clear view of what users actually do inside your app.
This information can help you shape a better user experience and improve security measures.
Also, you can make much more confident decisions that’ll improve the app.
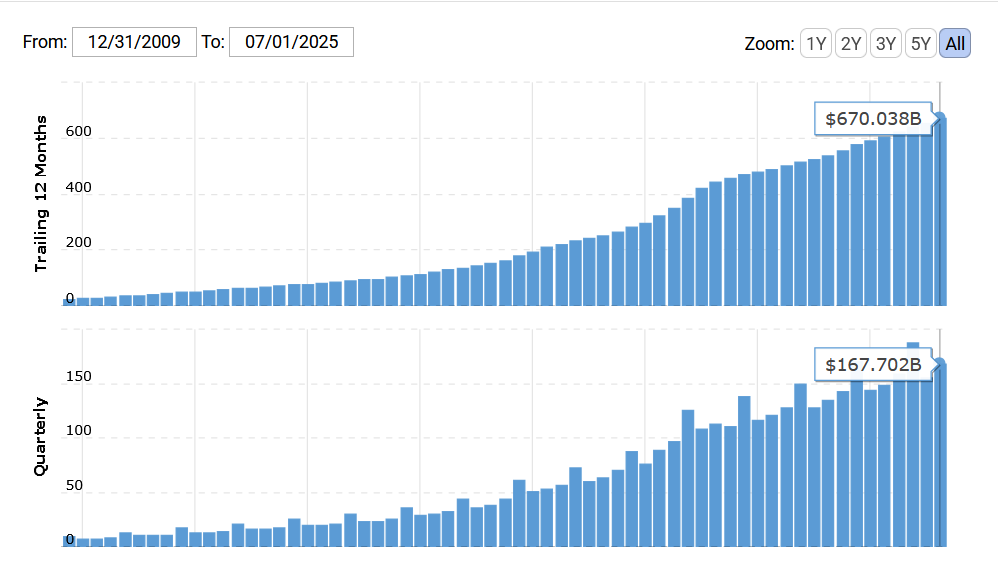
Take Amazon, for example.
Thanks to its robust data and consistent behavior tracking, Amazon personalizes and streamlines the user’s experience not only with dynamic pricing but with recommending products similar to those a user views and puts in their shopping cart.
This approach is one of the factors behind its continued growth.
Amazon reported $167.7 billion in revenue for Q2 2025, up 13.3% year over year, and $670 billion over the past twelve months, a 10.9% increase.
The same logic applies to mobile apps of any size.
If you’re building a fintech app and notice a sharp drop-off during account verification, you can treat that as a signal to simplify the flow.
And simple-to-use flows are always a plus for the user’s experience.

Get unreal data to fix real issues in your app & web.
When it comes to security, user behavior analytics play an important role in detecting and mitigating security risks, like mobile malware attacks and data leakage, which are especially prevalent in industries like finance and healthcare.
According to IBM, the global average cost of a data breach is $4.45 million, which shows how crucial it is to keep security top of mind in app development.
If you catch suspicious user activity in analytics tools, you can react immediately and secure the potentially exposed data.
Relying on app user behavior is, therefore, a great way to avoid those risks.
But, even if something slips through the cracks, it’ll be easier to solve the issue because you’ll be able to immediately pinpoint what happened and how.
This transparency reduces downtime and keeps users’ data and trust intact.
When it comes to internal decision-making, stakeholders may push for features based on assumptions.
But if you’re armed with data from in-app surveys and analytics tools, you can challenge those assumptions with evidence.
For instance, if the data shows that a feature is rarely used, decision-makers can quickly agree to shift focus elsewhere.
This shortens the decision-making process and frees up more time to improve the app itself.
Overall, the more your decisions are based on both qualitative and quantitative user data, the better chance you have at being aligned with app users and business goals.
Feature overload is a pressing issue in app development.
Although it may seem like “the more, the merrier,” especially if you’re an early-stage startup that wants to develop an all-in-one app, users actually hate being inundated with irrelevant features.
So, they either cut time on using the app or stop using it altogether.
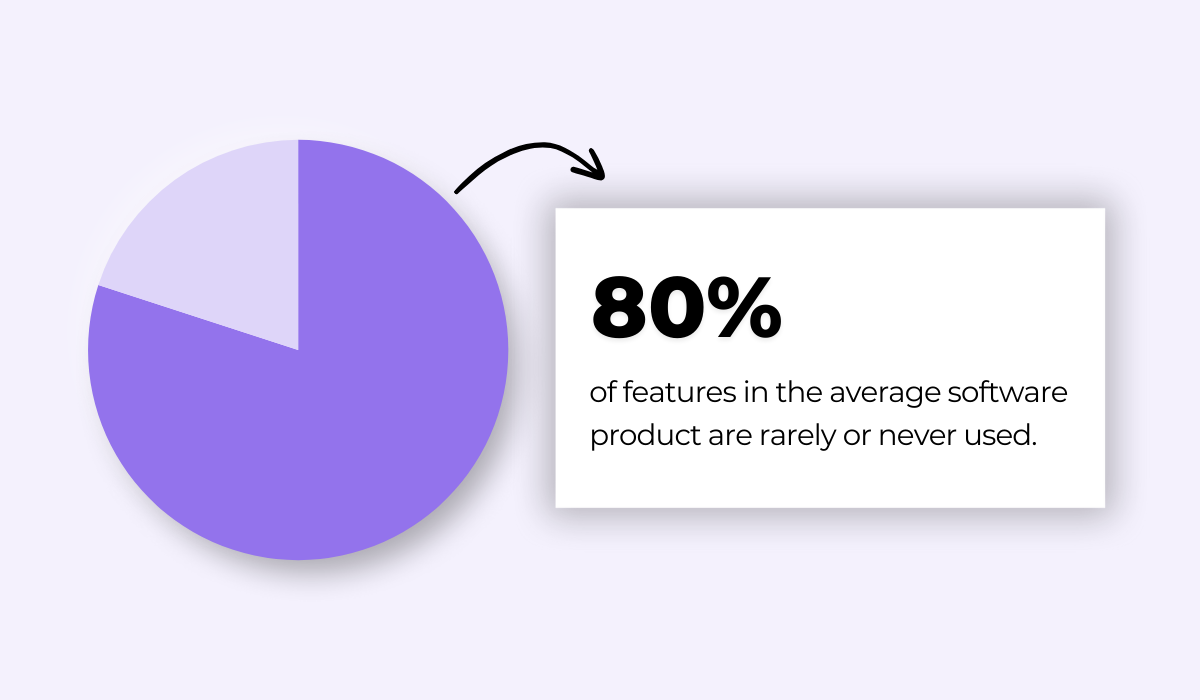
Plus, a survey by Pendo found that 80% of features in the average software product are rarely or never used.
Feature bloat can lead to other problems as well, such as technical debt, a more complex and harder-to-use app, and, in some cases, a drop in developer morale.
Relying on relevant user behavior data, combined with a clear understanding of your goals and the problems you solve for users, helps you determine which features deserve investment and which are a drain on time and resources.
Not all features are equally important. Some of them are the backbone of your app, while others have a supporting role.
When you use feature optimization frameworks like RICE or the Kano model, it’s much easier to speed up the prioritizing process.
The Kano model is based on the degree to which the features are likely to satisfy customers.
The RICE framework is based on scoring features across four factors (reach, impact, confidence, and effort), as you can see here:
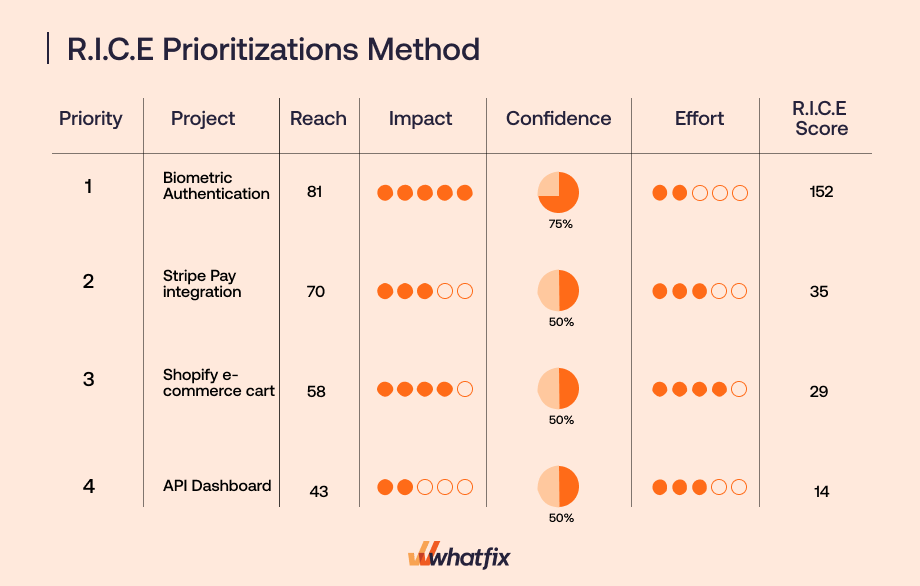
Frameworks like these also make it easier to develop an app that delivers the most value to both users and stakeholders.
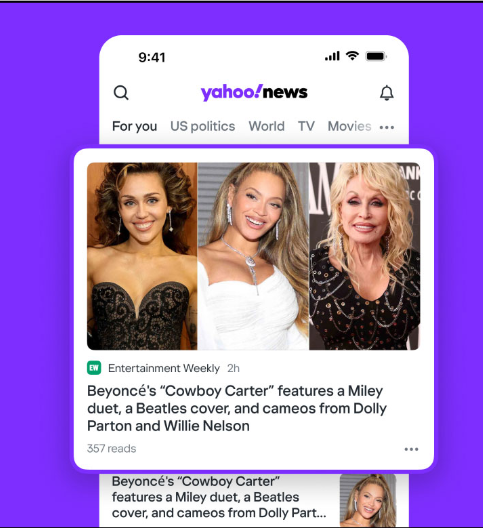
A great example of an app that prioritized its features based on real-user interest is Yahoo’s revamped news app.
Now it’s decluttered, has a sleeker design, and it doesn’t pester its users with irrelevant notifications, but tailors them to their interests.
But that’s not all.
Using user behavior data in feature prioritization makes your development cycles faster and increases client satisfaction.
So, instead of wasting time on features no one wants, invest in those that actually improve the user experience and support business goals.
Analyzing user behavior helps you uncover friction points—moments when people get stuck, confused, or frustrated while using your app.
A poorly labeled button or an unfriendly navigation path may seem minor, but for a user, it can be a breaking point.
Research confirms this.
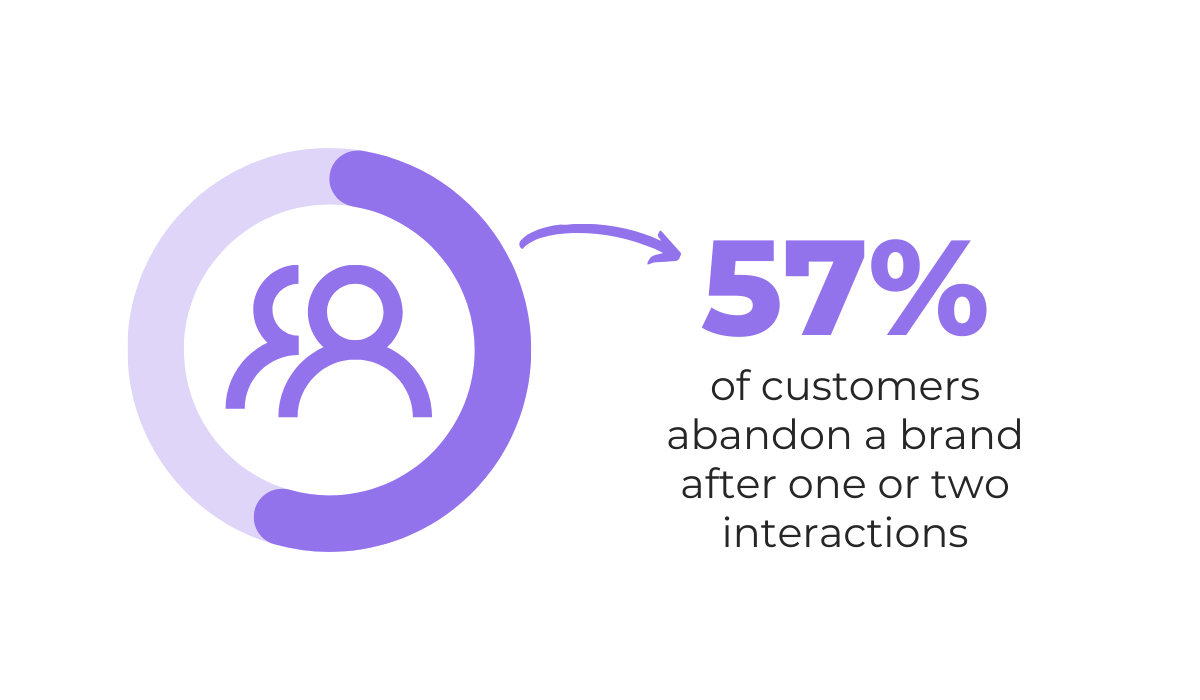
According to the NICE Digital CX Report, 57% of customers will abandon a brand after just one or two negative interactions.
An example might be a login flow that rejects valid credentials without explaining why, or a checkout page where the “Confirm Order” button is buried at the bottom of a cluttered screen.
Users rarely stop to figure it out.
They just close the app, and sometimes, if they’re frustrated enough, they delete it.
Now, when one or two users do that, it’s not a major issue, but when hundreds or thousands do it and leave one-star reviews, the damage can be serious.
That’s why behavior analytics tools such as heatmaps and session replays are so useful.
They provide hard data on exactly where people hesitate, rage-click, or close the app.
Detecting signals early, whether it’s rage clicks or drop-offs, gives your team the chance to respond before an unhappy user leaves and deletes the app.
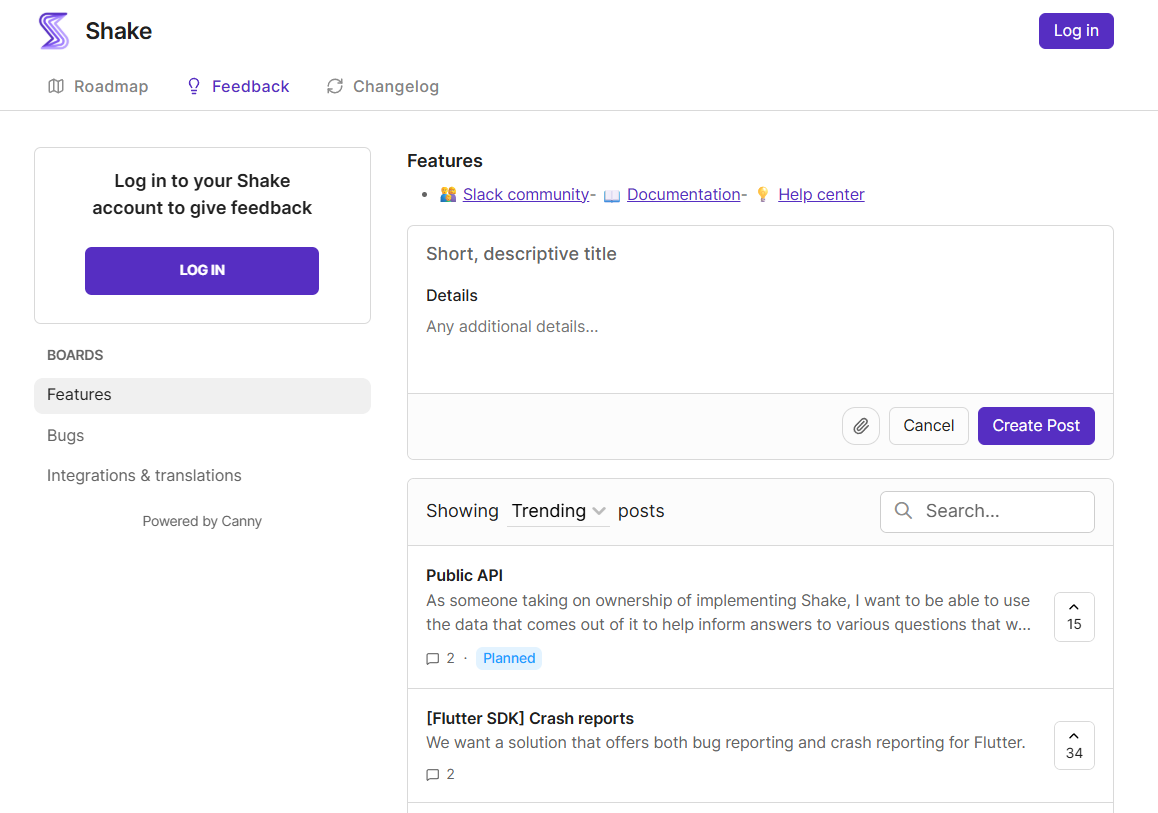
One way to close the loop quickly is with a tool like Shake.
If something goes wrong, a user simply shakes their device. That action triggers an instant report packed with session replays, crash logs, device data, and network events.
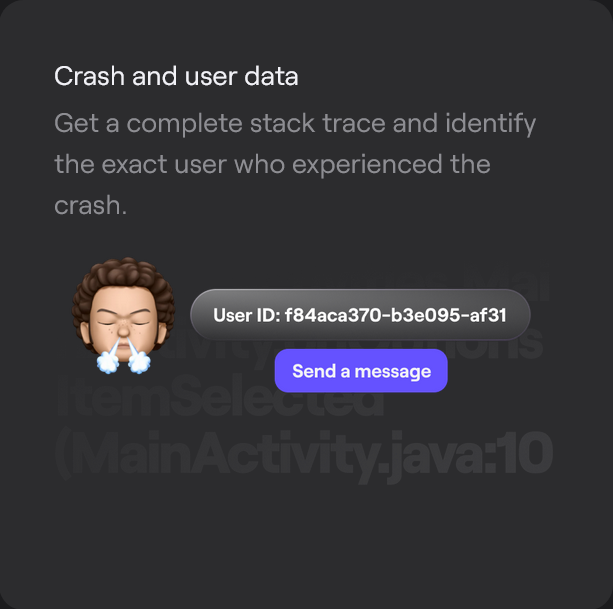
Instead of vague “this feature doesn’t work” complaints, you see exactly what the user saw in the moments before the failure.
Also, Shake comes with Canny-powered customer feedback.
Users can offer direct feedback to the product team and vote on the proposals of other product ideas and feature requests.
This helps you keep users top of mind when planning app updates.
All of this shows how fixing user friction points early keeps the experience smooth and helps you build a product users keep coming back to.
A sluggish app with performance issues like slow load times and regular crashes is a pending disaster.
Users are engaging with it less and less, they leave bad ratings in app stores, and that’s a signal for potential users to steer clear of it.
If not addressed on time, this can contribute to drops in business revenue.
This is exactly what happened to the audio company Sonos.
Their mobile app crashed in May 2024 after a major update.
As Andy Pennel, principal software engineer for Xbox and Sonos aficionado, explains, the company completely changed the old code.

The result was a range of issues:
To make matters worse, the new app also lacked many features that were available in the old version.
The aftermath included the CEO’s resignation and hundreds of millions of dollars lost.
If the company had tracked app performance more closely and aligned improvements with user needs, the consequences would likely have been less severe.

Capture, Annotate & Share in Seconds with our Free Chrome Extension!
This case illustrates how technical issues can impact both users and business outcomes.
Fortunately, behavior analytics can help developers catch these problems early.
Analytics reveal when and where issues occur.
Let’s say users consistently drop off during checkout on an app. Analytics will show that the payment screen is taking five seconds longer to load than any other part of the app.
To a developer, that’s a performance issue caused by a slow API call. But to the user, it just feels broken.
Fixing that delay could instantly reduce cart abandonment and improve satisfaction, even though the change is invisible in the interface. A win-win situation.
In conclusion, aligning technical improvements with real-time user behavior data results in an app optimized for both user retention and business success.
Acquiring new users is nice, but keeping them engaged and happy for the long term is the ultimate goal.
This is one of the hardest challenges in app development.
Numbers show that the average retention rate across 31 mobile app categories is 25.3% on day 1, falling to 5.7% by day 30.

Analyzing user behavior can help you understand why this happens and what steps to take to prevent it.
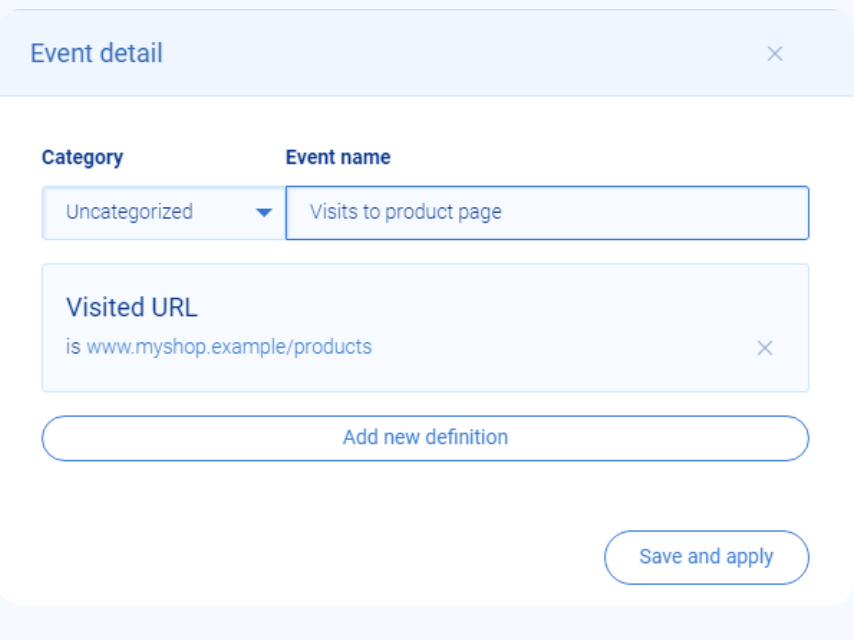
With heatmaps or event tracking from analytic tools like Smartlook, you can see the exact point where users leave the app and what triggered it, whether it was a bug, a frozen screen, or something else.
You can then compare data from the heatmap with other tools to get a more comprehensive view of the problem.
Using this type of personalized data to improve user retention is key to gaining an edge in today’s app market, which increasingly relies on personalization.
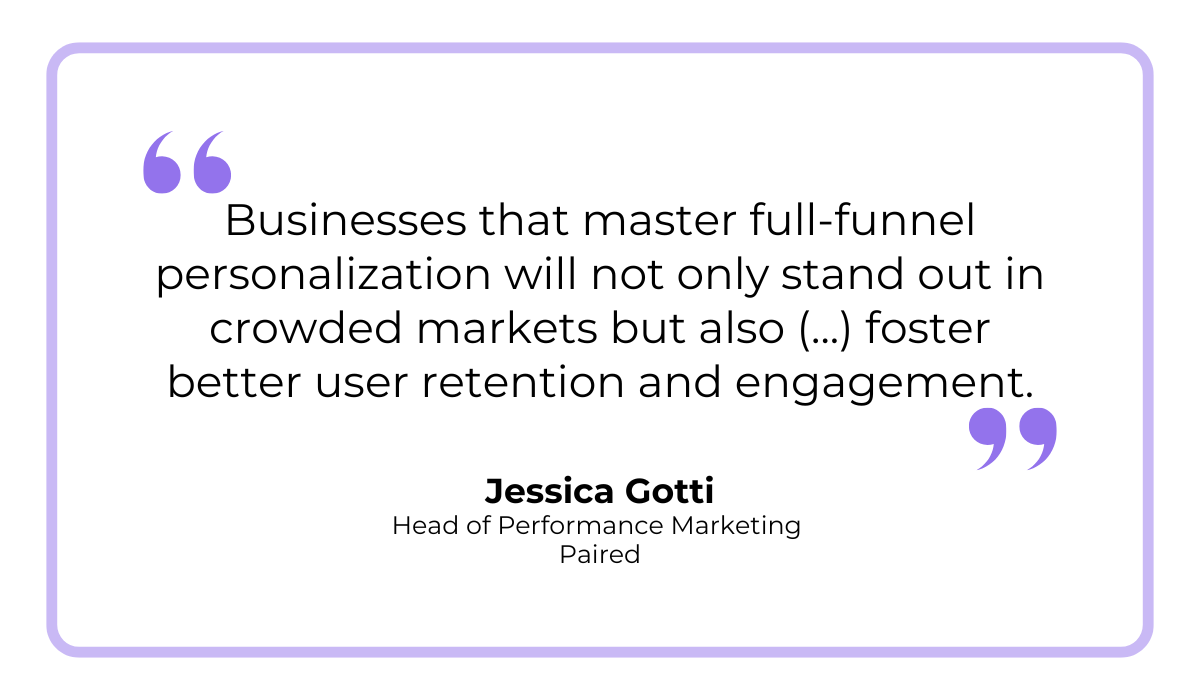
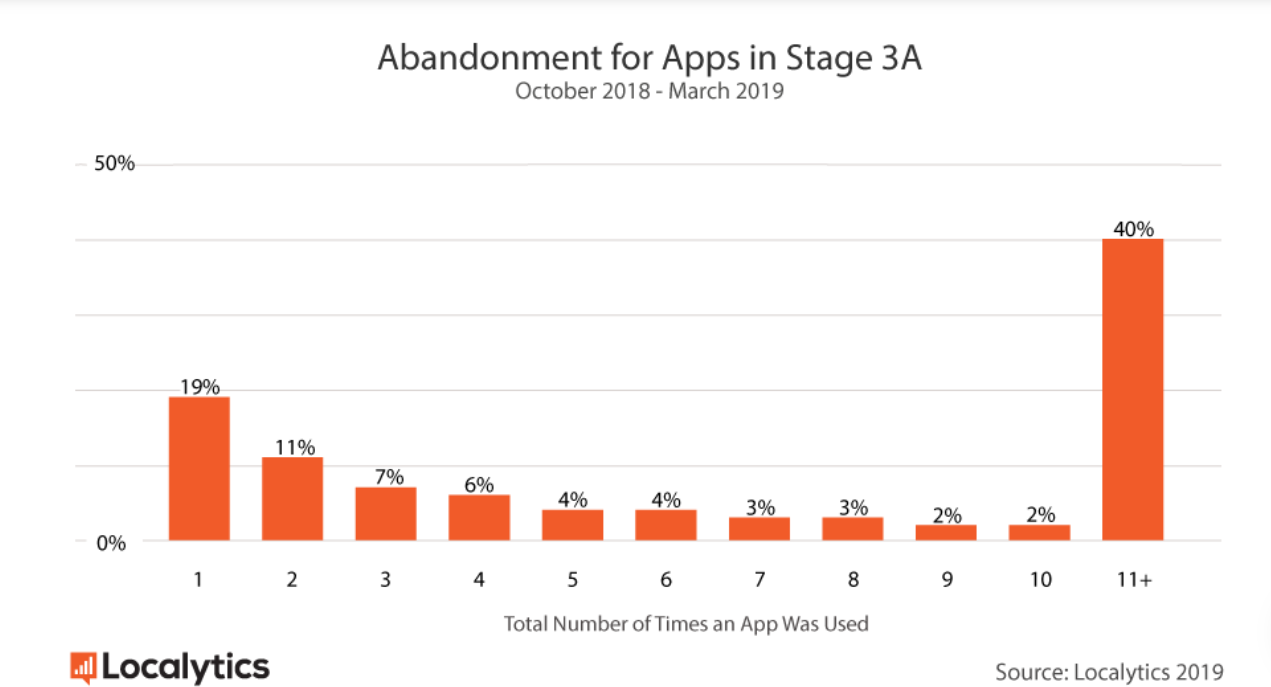
Research from Localytics provides a powerful illustration of Gotti’s point.
It revealed that apps using dynamic messaging and targeting specific user segments rather than the entire user base have lower abandonment rates (19%) and see the number of users continuing after 11 sessions rise from 32% to 40%.
When you use behavior data to identify drop-off points and tailor the experience to what keeps users engaged, you give them a reason to return.
That’s how apps become user favorites rather than one-time downloads.
And there you have it.
You now have a fuller understanding of why insights from user behavior analysis can help you develop a more successful app.
Whether it’s making confident decisions, prioritizing features faster, identifying friction points, or improving retention, user behavior data analysis ensures nothing slips through the cracks.
So, don’t treat user behavior analytics as an afterthought.
Use it strategically, and it can be the difference between an average app and one that drives business results while creating loyal users.
From internal bug reporting to production and customer support, our all-in-one SDK gets you all the right clues to fix issues in your mobile app and website.
We love to think it makes CTOs life easier, QA tester’s reports better and dev’s coding faster. If you agree that user feedback is key – Shake is your door lock.
Read more about us here.

Add to app in minutes

Doesn’t affect app speed

GDPR & CCPA compliant

Unexpected things pop up
Just like bugs in your app or web 🐛 Fix them now with just one reporting tool.