
5 challenges in understanding app user behavior

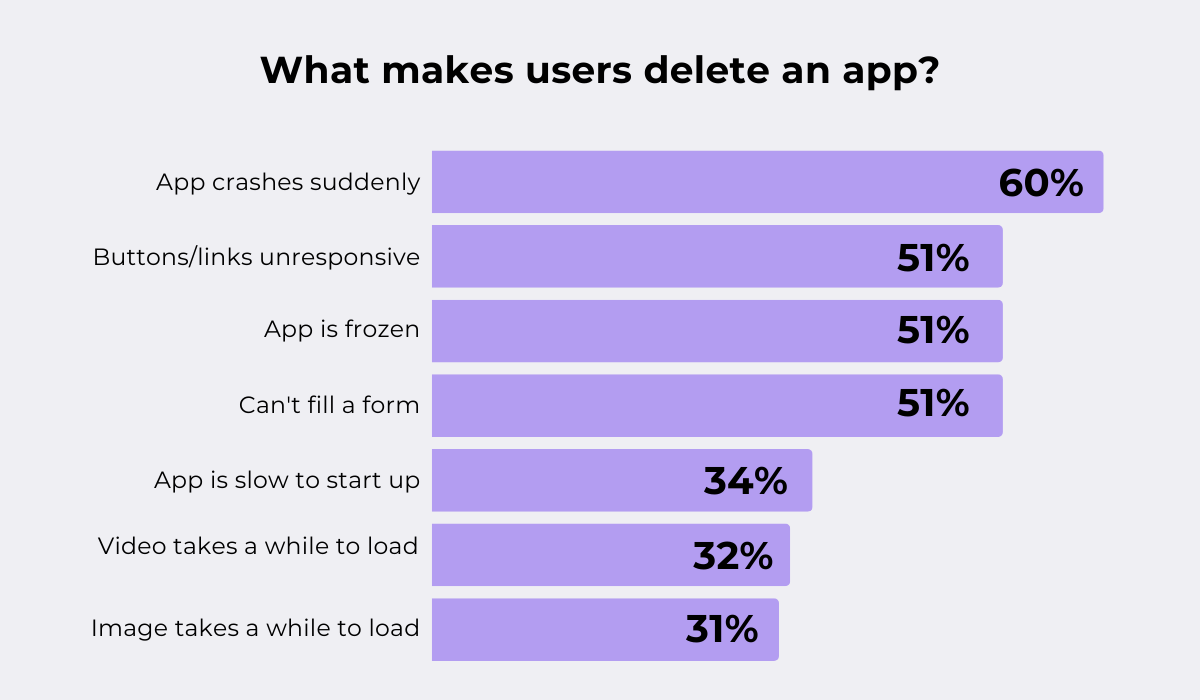
Research shows that 60% of users uninstall an app after just a few crashes.
But do you even know how often your app crashes? Or how long users stick around before they decide to delete it?
If not, keep reading.
In this article, we break down seven must-track metrics that uncover everything about your users’ behavior: why they leave, why they stay, and what might convince them to spend more.
These KPIs don’t just measure app performance. They reveal the full story behind your users’ choices.
Here’s what you need to know.
Table of Contents
User engagement measures how actively and frequently people interact with your app.
As such, it shows whether your app’s design and functionality encourage ongoing use or reveal areas where improvements are needed.
Measuring this metric matters because when users are truly engaged, they’re more likely to stay loyal and even convert into paying customers.
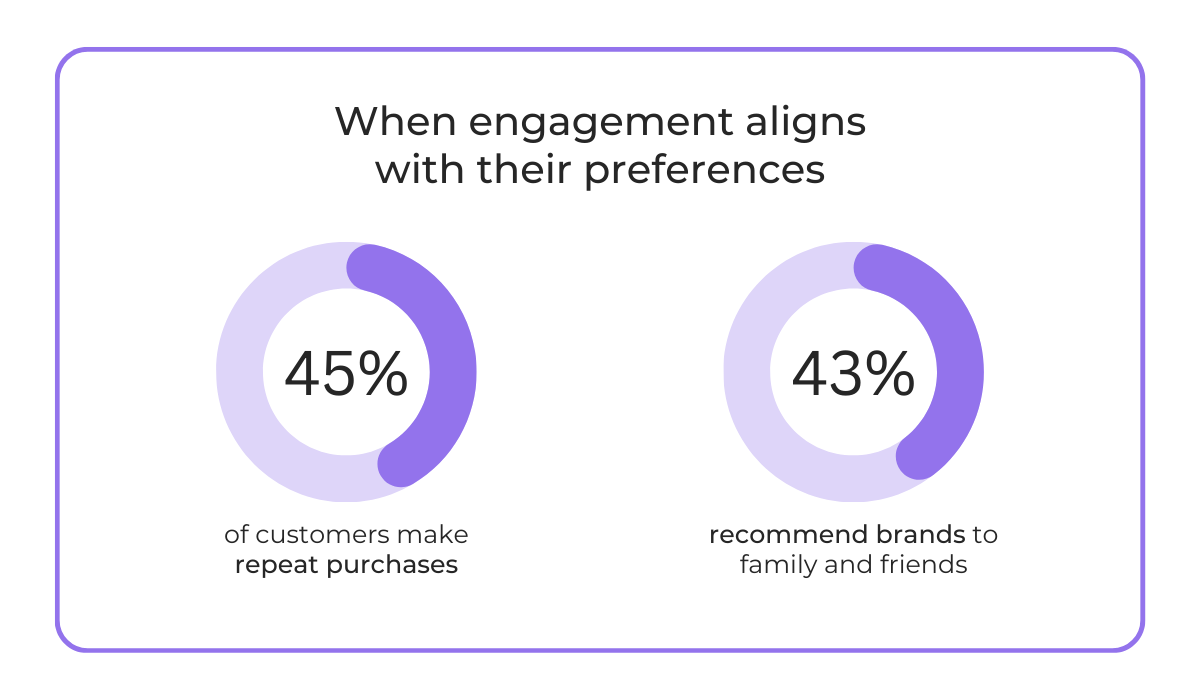
The 2025 Twilio survey backs this up, revealing that personalized engagement leads customers to make repeat purchases and recommend brands to family and friends.
In short, engagement turns one-time buyers into loyal advocates, driving revenue and lasting brand reputation.
But how exactly do you measure user engagement?
Well, there is no one-size-fits-all answer to this question. It varies by category and app type.
A couple of examples:
| Media | Key metrics include daily usage, time on site or page, clicks, comments, and shares, since these sites often depend on ad or affiliate revenue |
| E-commerce | Metrics center on buyer intent and conversion, such as visit frequency, site usability, add-to-cart actions, cart abandonment, and product reviews |
| B2B | These apps track daily/weekly/monthly usage, completion of work-related tasks, and new user invitations, since growth within an organization is a critical signal |

Get unreal data to fix real issues in your app & web.
In other words, engagement looks different depending on what “success” means for your app.
It’s all about understanding how your app delivers value to your unique users at each stage of their journey.
That said, there are some universal engagement metrics that almost every app should keep an eye on:
All in all, if you’re consistently tracking how many users are truly engaged, you’ll have one of the strongest indicators of your product’s health.
And when engagement starts slipping, it’s often the first red flag that something needs fixing, long before bigger problems show up.
Click-through rate (CTR) measures the percentage of users who engage with a specific in-app element, like push notifications, in-app messages, banners, ads, or CTA buttons.
It’s calculated with the following formula:
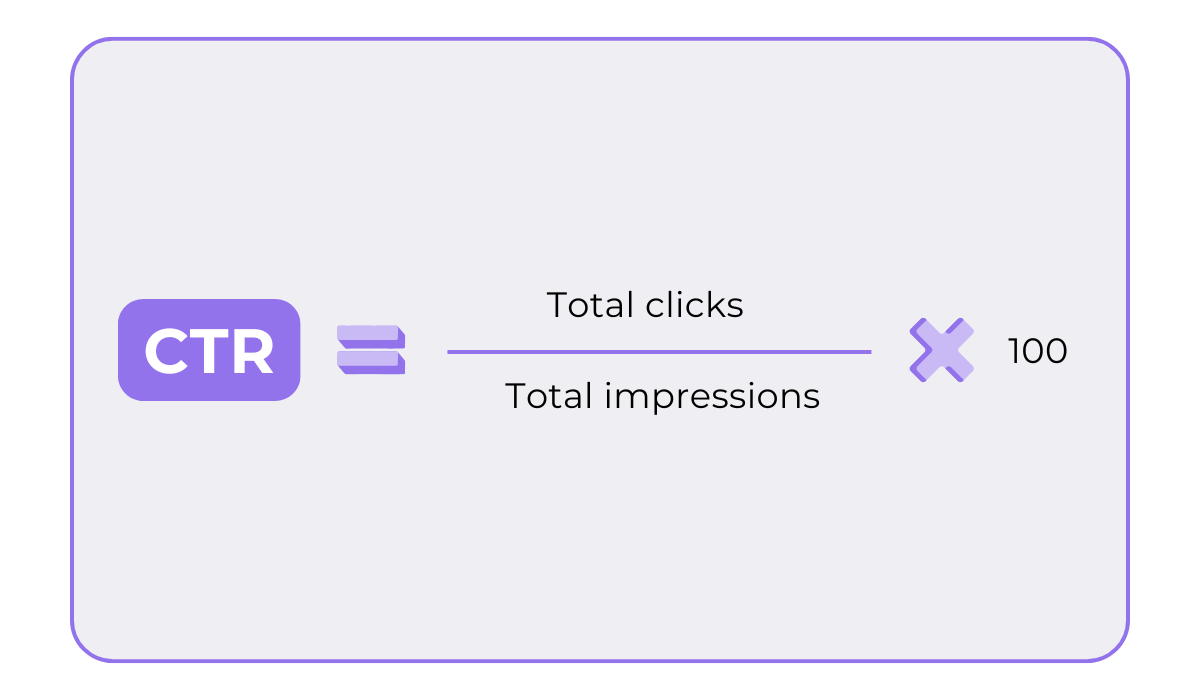
So, why should you measure CTR?
Because it’s a key indicator of how effective your messaging, design, or placement is at driving user action.
And if your app isn’t motivating users to take the intended action, then what’s the point, right?
Several factors can influence your CTR:
| Relevance of the message | Generic prompts are often ignored |
| Copywriting & design | Unclear CTAs, weak visuals, or vague wording reduce clicks |
| Placement | If the CTA isn’t visible or is placed disruptively, CTR drops |
| User intent | Users who aren’t in the right stage of their journey won’t click |
| Frequency | Overusing notifications or banners creates fatigue, lowering CTR |
A higher CTR typically means you’re getting all these right, and your content, design, and offers resonate with your audience.
But what is a “higher CTR” anyway?
That’s the million-dollar question.
Benchmarks vary by channel and industry.
For example, Pushwoosh offers some figures about average CTRs for push notifications. Feel free to check them out to see where you stand.
If you realize that your CTR is below average, don’t worry. There are plenty of strategies to improve it.
One of the most effective is A/B testing.
The idea is simple: show different variations of your message to a subset of your audience, then analyze which version drives the most clicks.
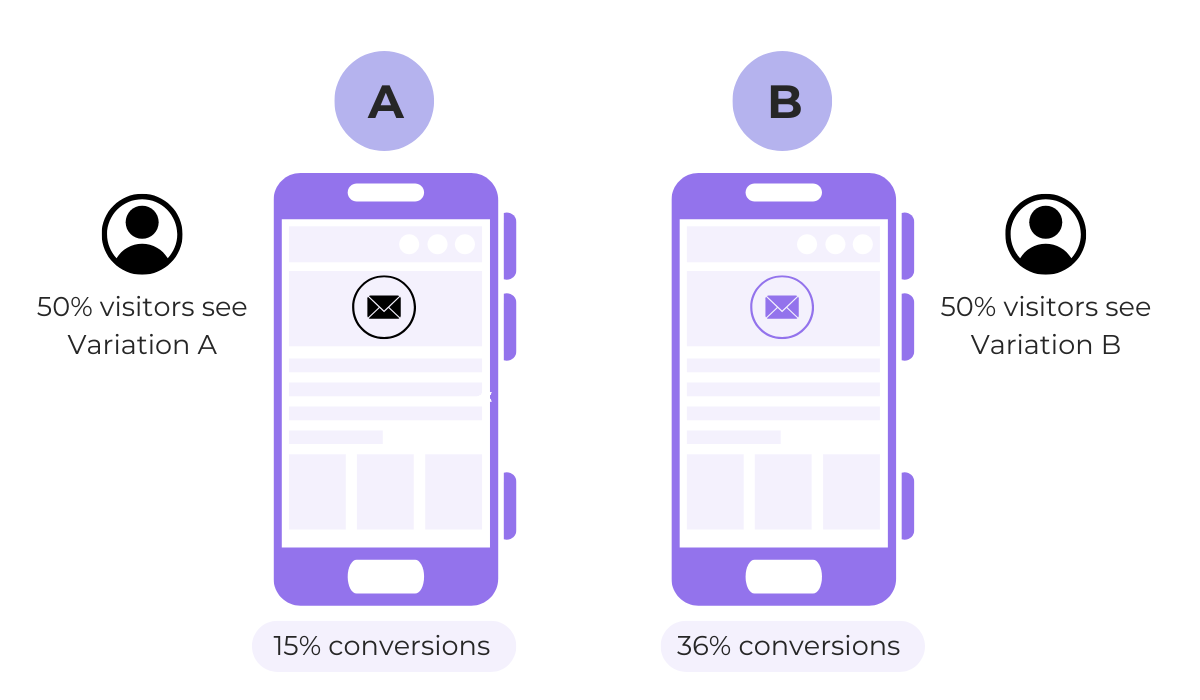
You can A/B test elements like button colors, frequency and timing, CTA placement, wording, and more.
Over time, these experiments tell you exactly what makes your users click, and what doesn’t.
So if your CTR isn’t where you want it to be, don’t panic.
Test, tweak, and repeat.
Conversion rate measures the percentage of users who complete a desired action in your app.
Here’s how to calculate it:
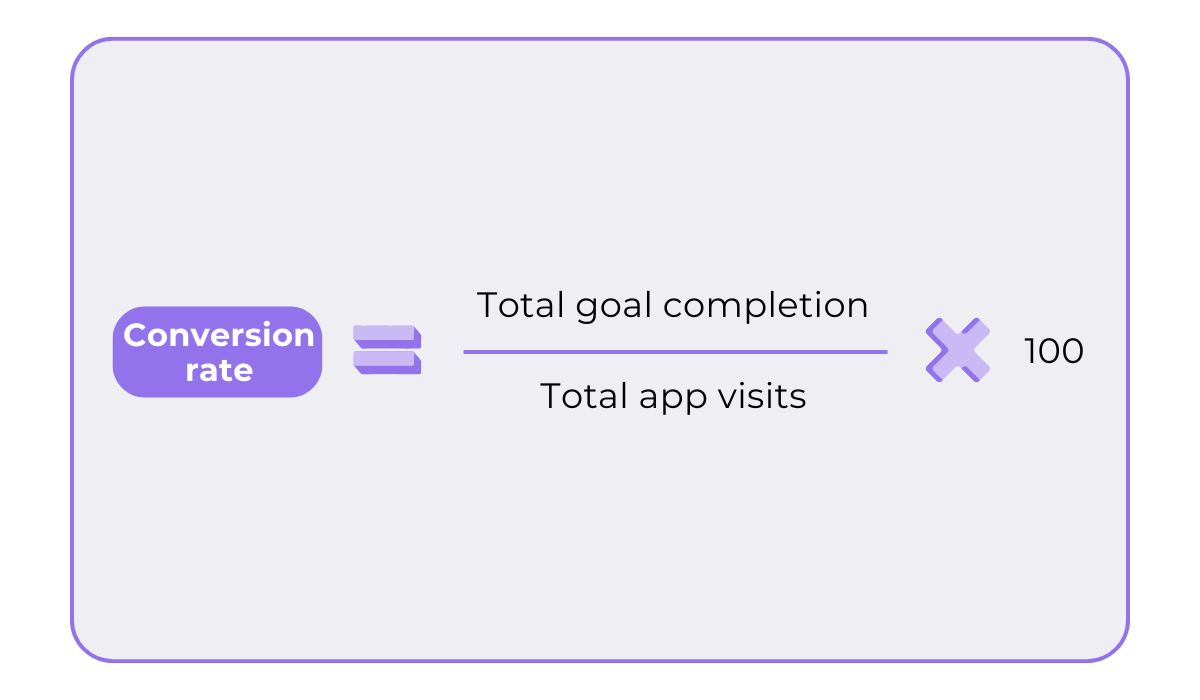
Now, what counts as a “conversion” depends on your business model.
It could mean making a purchase, starting a subscription, signing up for a free trial, completing onboarding, or enabling a key feature.
In any case, this metric is directly tied to revenue growth.
It shows how effectively your app turns interest into action and how compelling your value proposition is.
Think of it as a health check on the user journey: when conversion rates drop, it usually signals friction somewhere in the funnel.
This can be a result of all kinds of factors:
| User trust | Unclear pricing, lack of reviews, or confusing permissions erode confidence |
| App performance | Glitches or slow load times during checkout or sign-up lead to abandonment |
| Process complexity | Too many steps or forms frustrate users |
| Value communication | If the benefit isn’t clear, users won’t convert |
| Incentives | Discounts, free trials, or bonuses can push hesitant users across the line |
| Targeting quality | Even the smoothest flow won’t help if you’re reaching the wrong audience |
If your conversion rates feel low, don’t immediately stress. Across industries, conversion averages are typically in the very low single digits.
In fact, according to UXCam, install-to-purchase conversions usually fall between 1–2%.
Still, if you fall below the industry standard and want to improve, there are things you can do.
Start by refining the user experience.
Simplify every flow, like checkout, sign-up, or upgrades, and remove any unnecessary steps.
Every extra click or confusing screen can hurt conversions.
Take it from Musinsa, South Korea’s leading fashion app.
They redesigned their UI/UX, restructuring the home screen and adding a personalized section with AI-powered recommendations, and immediately tripled their purchase conversion rate.
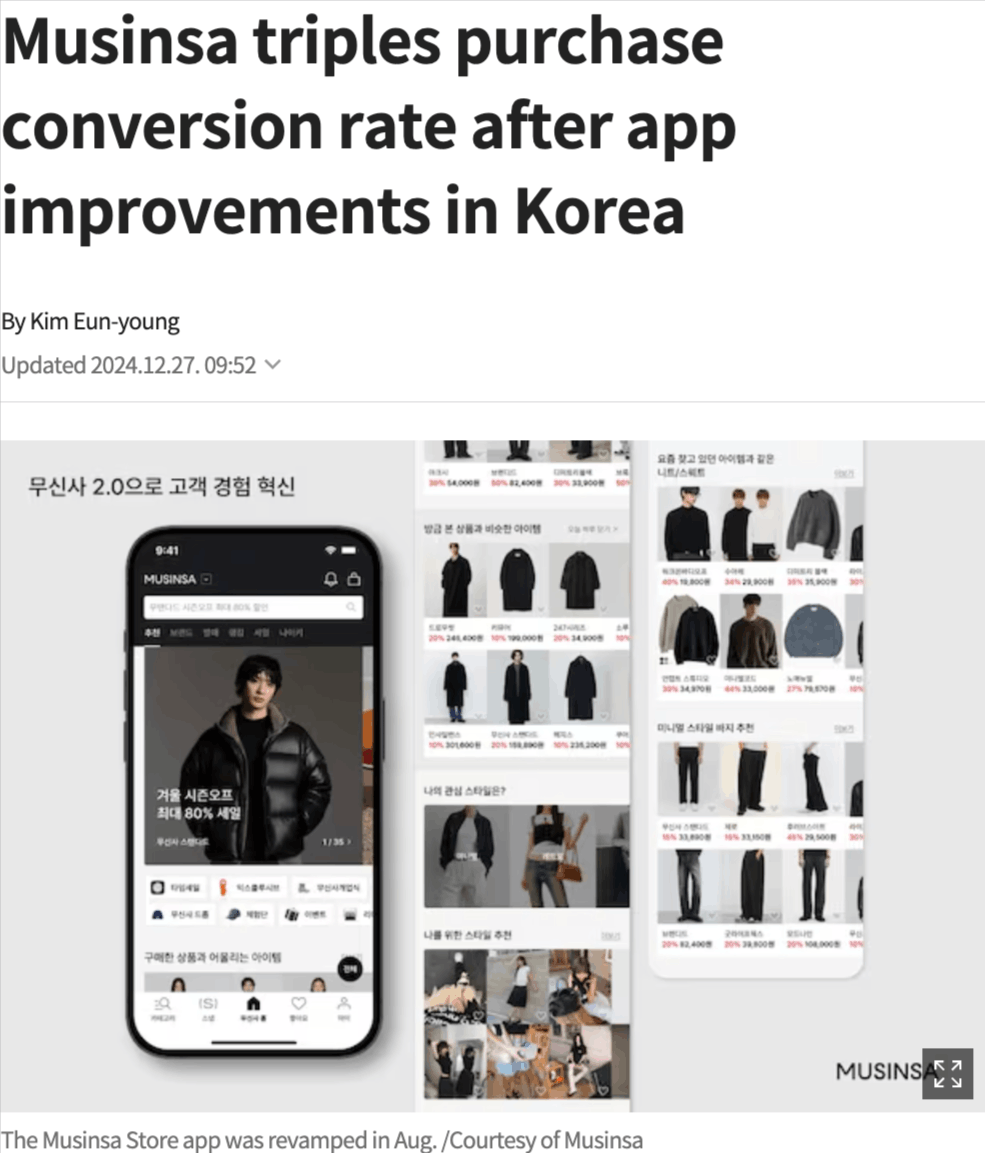
That contributed to a 308% increase in transactions year-over-year.
In the end, users want simplicity, clarity, and speed.
Deliver that, and you’ll earn their trust, loyalty, and, ultimately, revenue.
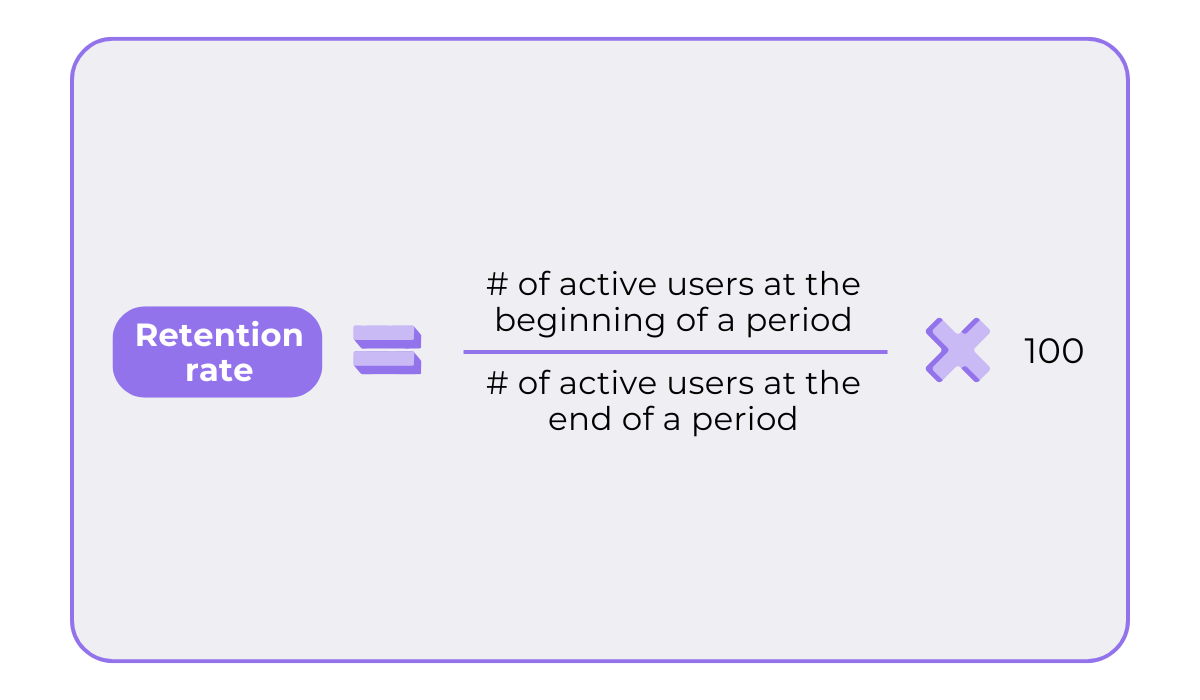
App retention rate is the percentage of users who continue engaging with your app over time.
This metric is typically measured at 1 day, 7 days, and 30 days after users first install the app, using the following formula:
This is one of the most important indicators of long-term app success.
Why?
Because it shows your app’s ability to consistently deliver real value to users.
Alex Walz, Head of Growth at Lighter Capital, a revenue-based financing lender, agrees:
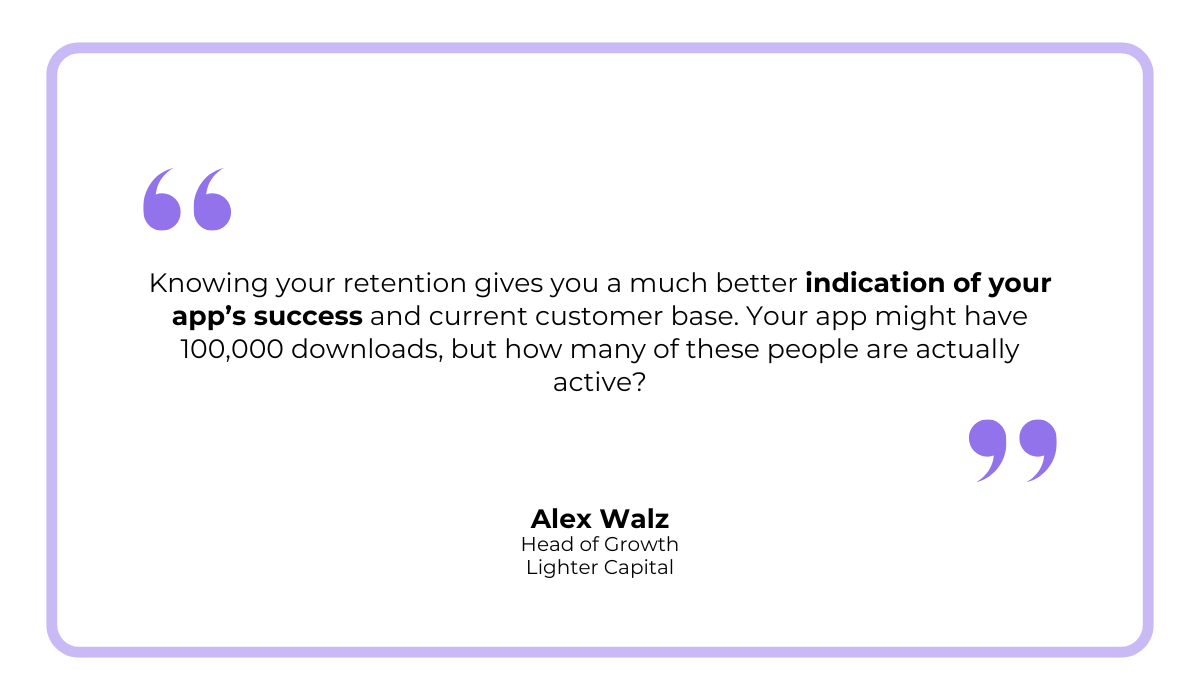
After all, you want your app to be able to retain users because acquiring new ones is significantly more expensive.
Now, like other app metrics, retention is influenced by several factors:
| Onboarding experience | Users who don’t quickly understand or see the value of your app are unlikely to return |
| User experience & performance | Crashes, slow loading, or confusing navigation drive users away |
| Content or feature relevance | If the app stops feeling fresh or useful, users churn |
| Engagement and habit formation | Features like streaks, reminders, or rewards encourage repeated use and improve retention |
If your retention rate is below the benchmark, a great place to start is improving onboarding.

Capture, Annotate & Share in Seconds with our Free Chrome Extension!
A smooth onboarding process guides users to their “aha” moment quickly and keeps them engaged longer.
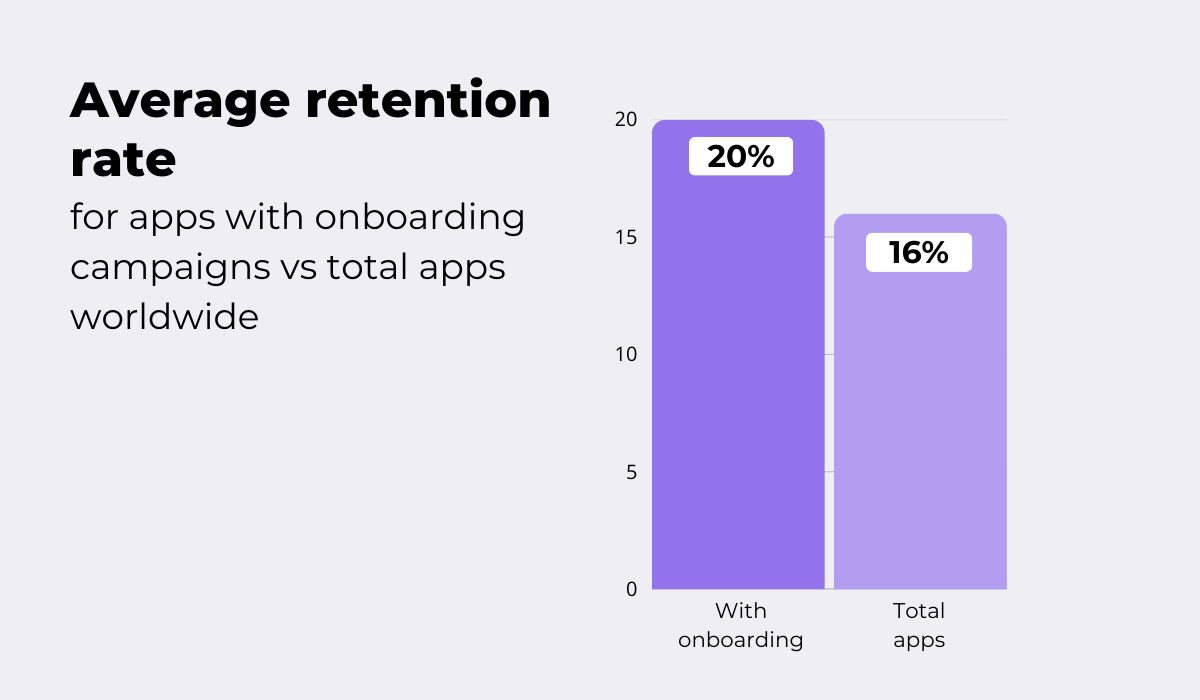
A study by EMARKETER and Airship backs this up.
It found that, in Q2 2024, 20% of users who downloaded apps with onboarding campaigns returned the next day, compared to just 16% across all apps.
So, don’t underestimate the power of efficient onboarding.
Try to keep it short, show value immediately, and avoid overwhelming users with too many screens or instructions.
Nail that first impression, and you’ll boost retention dramatically.
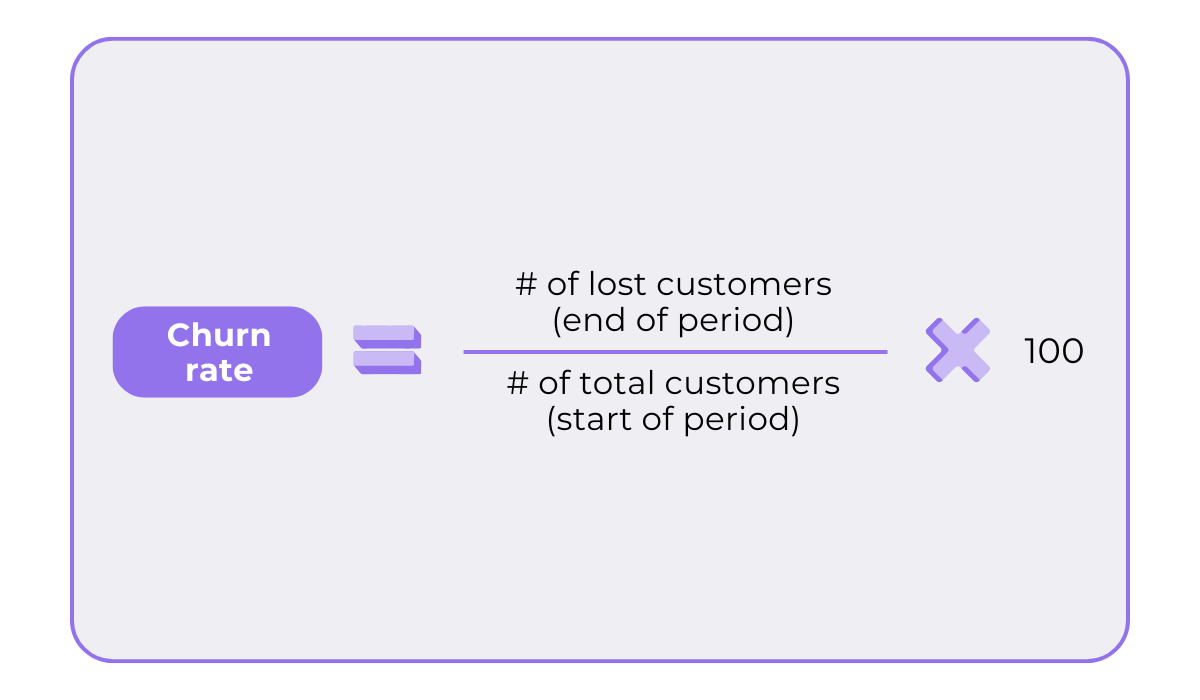
Churn rate measures the percentage of users who stop using your app over a given period.
It’s essentially the opposite of retention, tracking users who leave or disengage instead of returning.
Here’s the formula you can use to calculate it:
Like retention rate, churn rate indicates how much value your app is delivering to users.
High churn is a red flag. It suggests your app isn’t providing lasting value and may be jeopardizing user loyalty.
Want to know if your churn is a “red flag”?
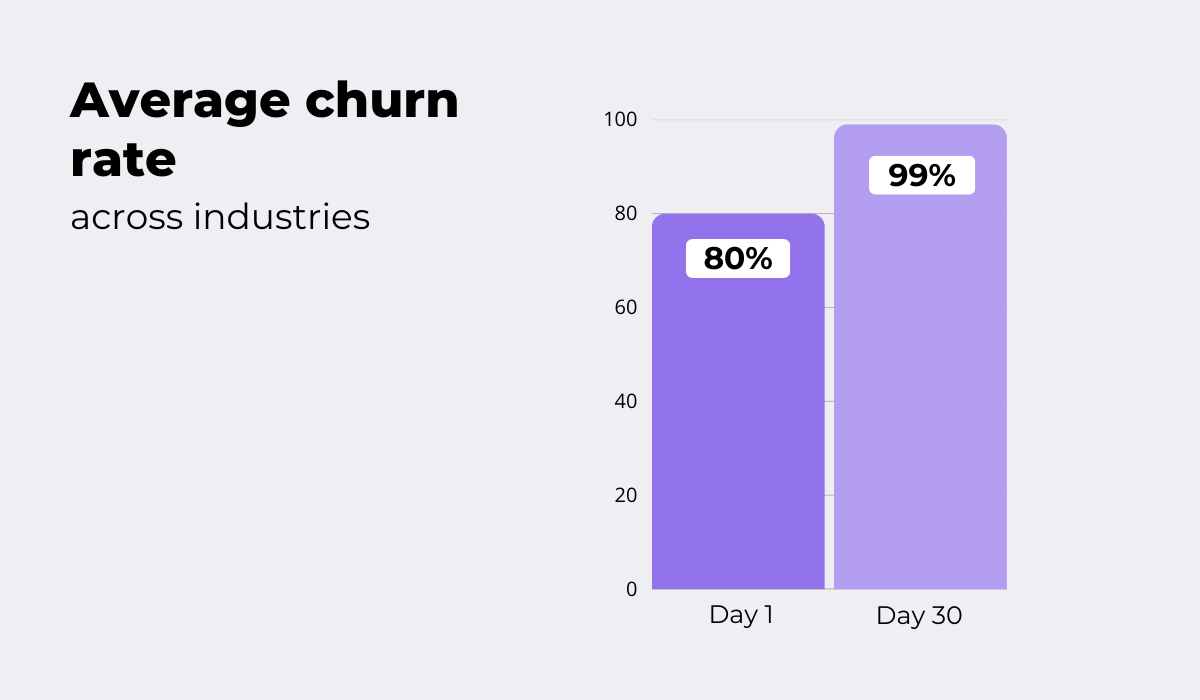
Take a look at some figures provided by Pooshwoosh.
Across almost all app categories, Day 1 churn rates are notably high, often exceeding 80%.
Another significant jump in churn occurs by Day 7 and becomes even more pronounced by Day 30, when many app categories surpass a 99% churn rate.
Such steep drop-offs often signal either a mismatch with the acquired audience or ineffective user engagement and retention strategies.
So, how do you fix it?
Simple: improve retention and engagement.
At its core, churn rate reflects low customer engagement.
When there are no clear incentives to keep users interacting with your app, they tend to lose interest, forget about it, and eventually uninstall it.
To combat this, focus on keeping users coming back. Personalized features, in-app rewards, or gamification can be effective.
Take Fitbit as an example.
Their app once offered challenges where users could compete with friends, earn badges, and participate in virtual events, adding a gamified element to the fitness tracking experience.
But when they removed these features in 2023, some customers expressed frustration, with many giving up on upgrading to premium or even considering leaving altogether.
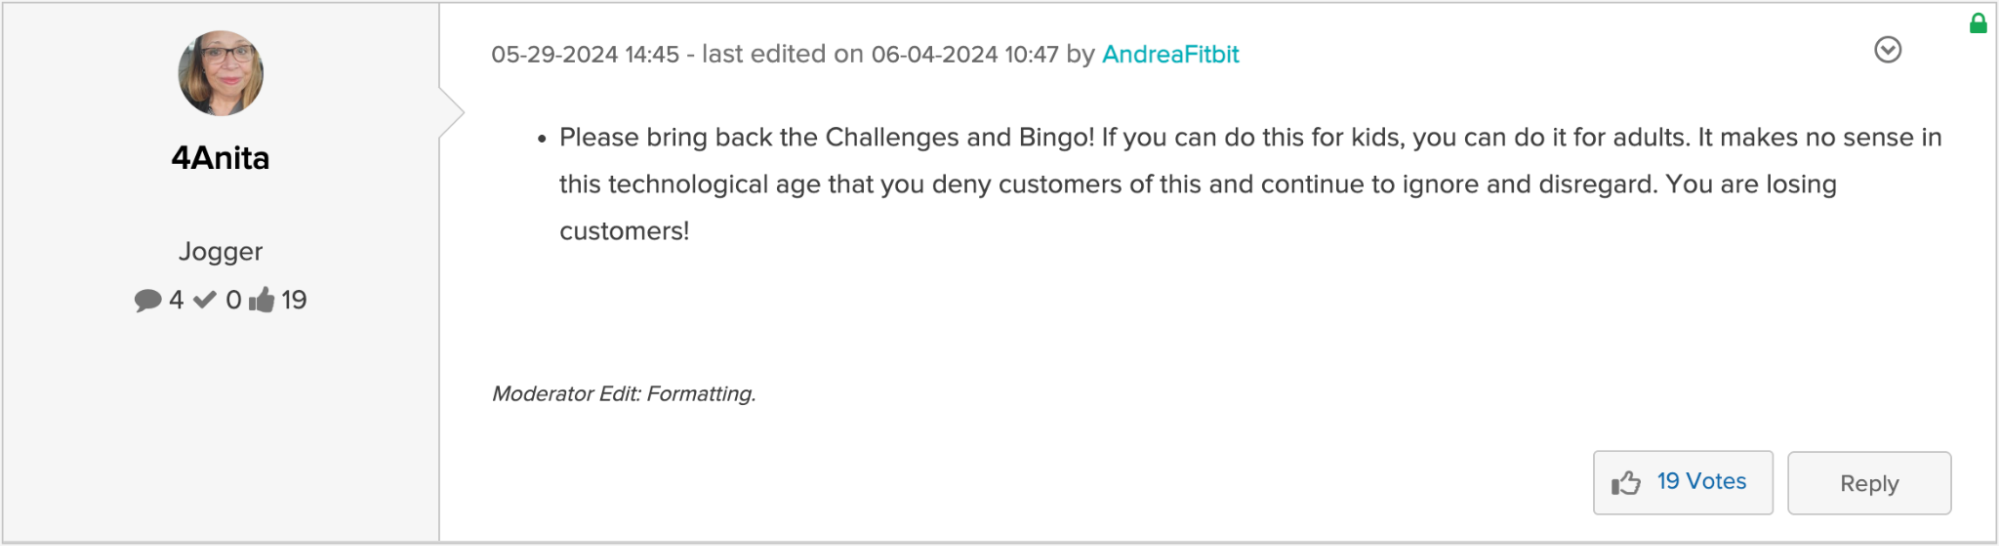
The lesson is clear: users need a reason to engage with your app continually.
Provide that reason, and you’ll reduce churn while boosting loyalty.
Never assume that users will continue engaging just because the app is “good enough” on its own.
Crash reports track how often an app fails or stops working unexpectedly.
This metric is definitely something you want to keep your eye on because frequent crashes frustrate users, erode trust, and lead to negative reviews.
In fact, they are often the culprit behind high churn rates.
The 2023 Embrace survey confirms this, showing that 60% of app users would uninstall an app that has crashed even a few times.
Tracking crash reports allows you to resolve these issues promptly, keeping your app stable and your users happy.
The best part?
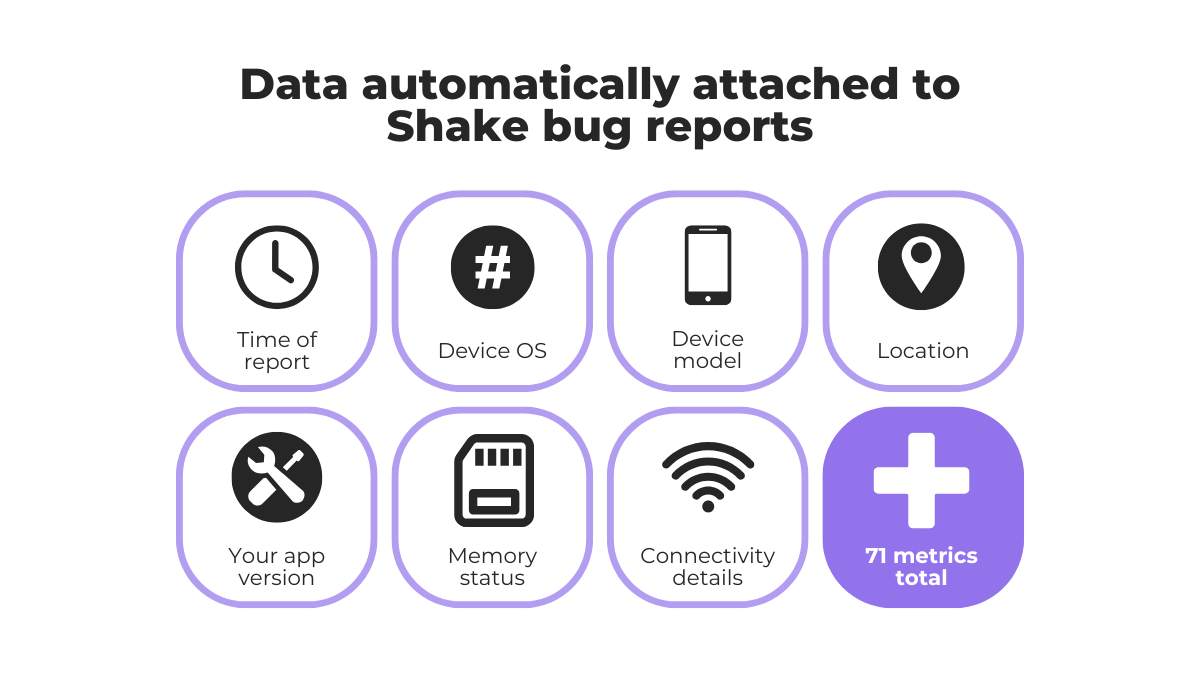
This process has never been easier thanks to crash and bug reporting tools like Shake.
Shake provides actionable data to help you address problems before they impact your users.
Each crash report includes details about the device and its state leading up to the crash, such as app version, current view, memory usage, and more.
Users can even submit their own feedback after a crash, giving you that extra context.
If you need more details, Shake’s live chat feature lets you ask follow-up questions, as well as reassure users that issues are being addressed or notify them when fixes are deployed.
On top of that, Shake includes automatic screen recording, capturing users’ actions in the moments leading up to a crash.
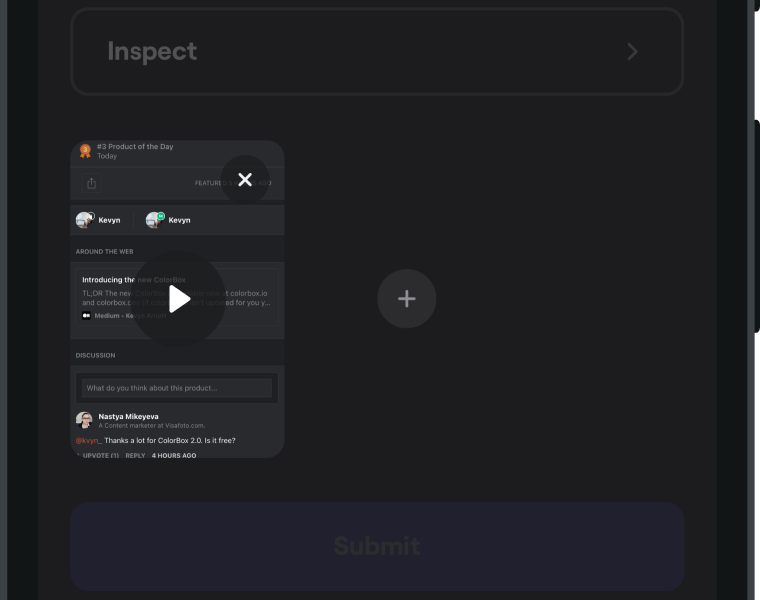
These recordings can be attached to feedback reports or issue tickets.
Put simply, with Shake, you don’t just see what happened.
You see everything that led to the crash, which helps you better understand why it happened to begin with.
Finally, resolving problems and maintaining user satisfaction becomes a breeze.
ARPU measures the average revenue generated over a specific period, giving you a clear view of how features, user experience, and monetization strategies contribute to overall profitability.
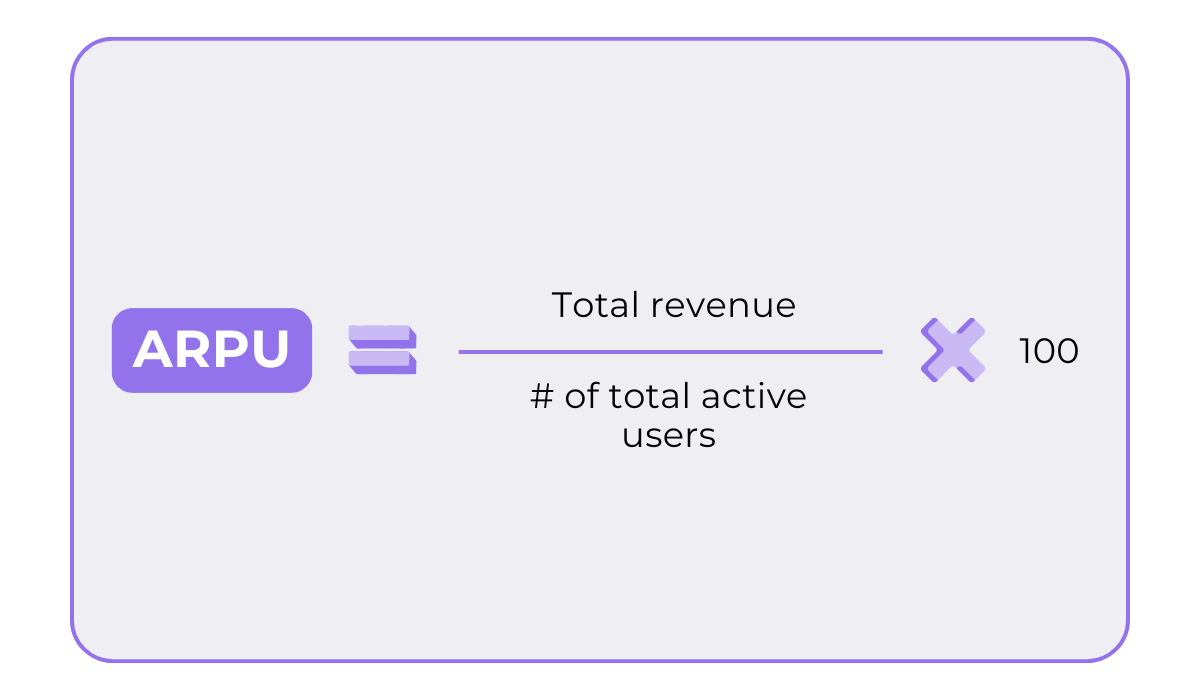
Essentially, ARPU is a litmus test for how effectively you’re monetizing your user base.
Several factors impact it:
| Pricing strategy | Subscription fees, in-app purchases, and ad revenue models all influence ARPU |
| User engagement & retention | The more engaged and loyal a user is, the more revenue they generate over time |
| Upselling & cross-selling | Offering premium tiers, add-ons, or bundles can increase ARPU |
| User segmentation | Different user groups (e.g., power users vs. casual users) contribute varying revenue levels |
| Market/geography | Users in certain regions may spend more or less, depending on purchasing power |
Yes, just like other app metrics, your ARPU is fixable.
And no, you don’t necessarily have to increase your prices to do so.
Instead, consider diversification.
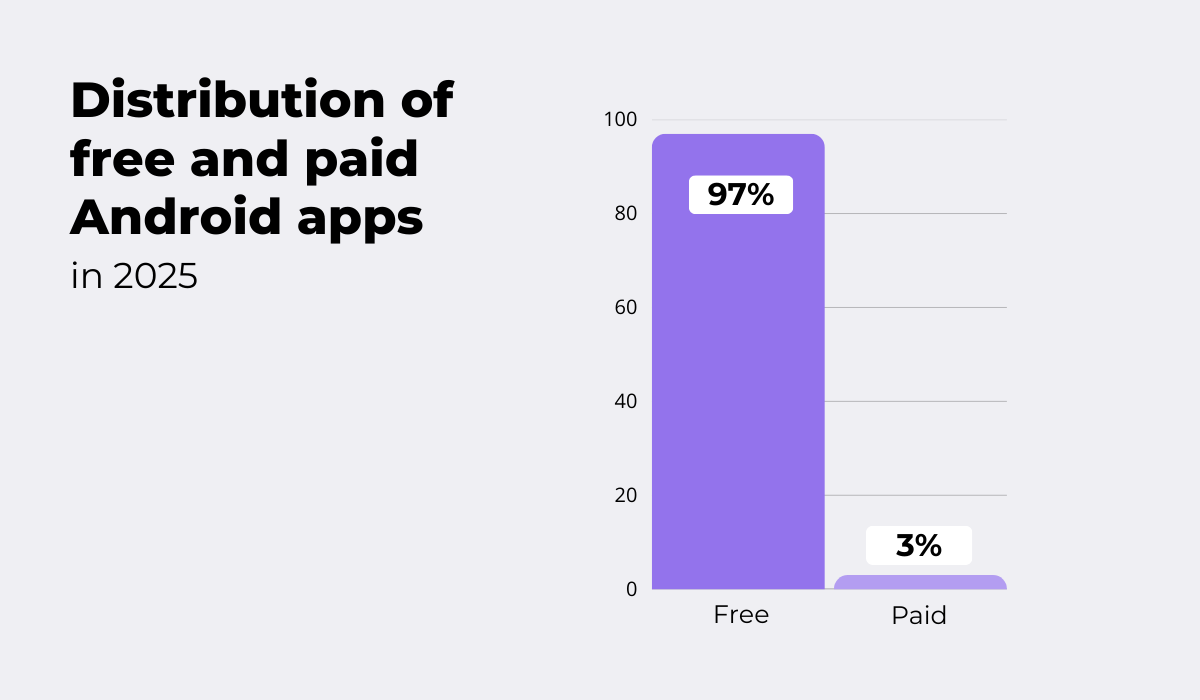
According to Statista, around 97% of all Android apps today are free, with only 3% requiring payment.
This is not by accident.
Paid apps often attract loyal users, but these users have high expectations: they don’t want ads or additional paid content.
So, while ARPU may be more stable with a paid app, revenue diversification is quite limited.
And in today’s highly competitive mobile ecosystem, you definitely want multiple revenue streams.
Here are some common ways to use in-app events to generate income and increase ARPU:
| In-App Advertising | Based on volume: more active users → more impressions → higher ARPU |
| In-App Purchases | Monetizes engaged power users willing to pay for premium items or features. Best when purchases improve the core experience without being mandatory |
| Subscriptions | Provides predictable and stable revenue. Each subscriber adds recurring revenue, significantly raising ARPU over time |
Diversifying revenue streams is one of the most effective ways to increase ARPU, as it allows you to capture value from different types of users.
Not everyone will subscribe, but they just might make an in-app purchase or two.
Try to think of these metrics as a conversation with your users, not just cold, hard data.
They reveal what the users value most, what frustrates them, what keeps them coming back, and even what inspires them to recommend you to others.
They show you what’s working and what isn’t, guiding you on how to do better.
Such insights are too valuable to ignore.
So, are you ready to listen?
From internal bug reporting to production and customer support, our all-in-one SDK gets you all the right clues to fix issues in your mobile app and website.
We love to think it makes CTOs life easier, QA tester’s reports better and dev’s coding faster. If you agree that user feedback is key – Shake is your door lock.
Read more about us here.

Add to app in minutes

Doesn’t affect app speed

GDPR & CCPA compliant

Unexpected things pop up
Just like bugs in your app or web 🐛 Fix them now with just one reporting tool.