Recommended
An introduction to app debugging
Software apps are essentially thousands of lines of code that need to be error-free if you want an app to work as intended.
However, errors and bugs almost always find their way into the code, so it’s important to fix them as soon as possible, before they escalate and cause serious problems down the line.
Therefore, app debugging is an important task that needs to be taken seriously.
Luckily, in this article, you’ll learn about common app debugging mistakes and how to avoid them to maximize your efficiency.
Let’s get to it!
Table of Contents
Would you use a pencil to paint a wall or a spoon to cut meat? We don’t know your preferences, but you would most likely choose more appropriate tools for those actions, like a paintbrush or a knife.
Why?
Because although the latter tools have their similarities to the former, you would be more efficient with the paintbrush and a knife, spend less time doing the task, and the results would be better.
It’s the same with app debugging.

Get unreal data to fix real issues in your app & web.
You can use various tools for debugging, but if you choose the wrong ones, you can make a mistake that can cost you time and provide you with subpar results.
Simply put, choosing the wrong tools for your needs and requirements can take you further and further away from productive work.
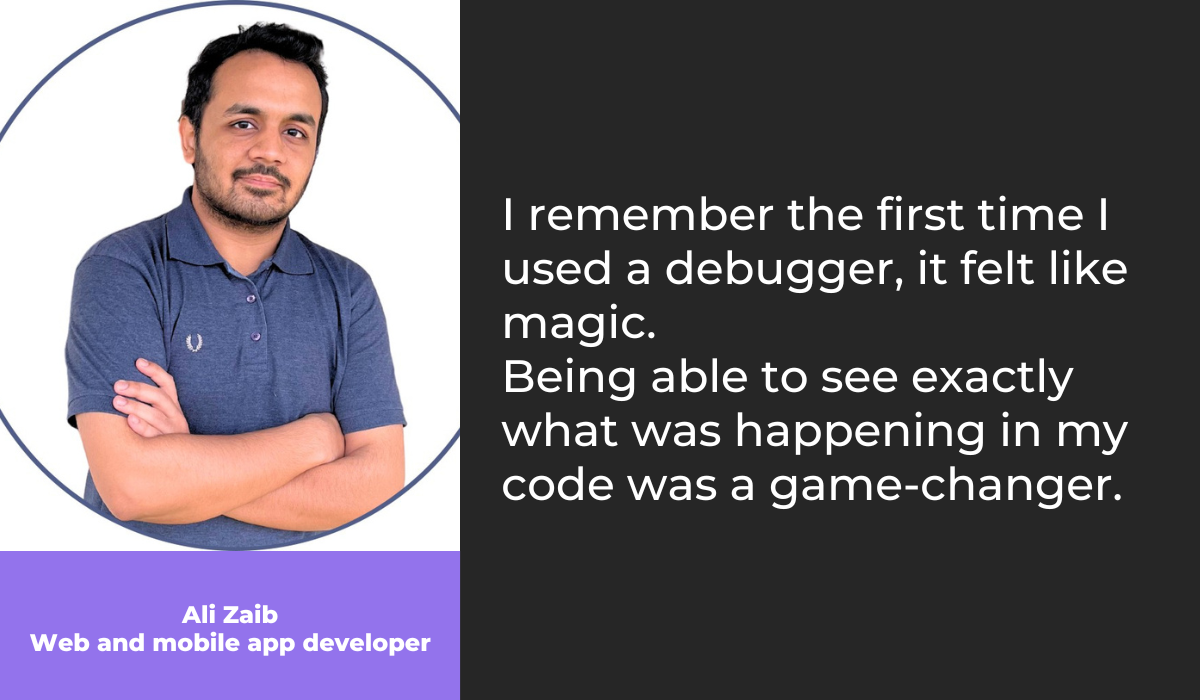
For example, one of the tools most developers use is a debugger. Here’s why Ali Zaib, web and mobile app developer, uses them:
But not all debuggers are the same.
For example, if your team consists of many junior developers or developers who lack experience with debuggers, choosing an advanced tool like IDA Pro would be a mistake.
It’s a powerful and versatile debugger that covers all the parts of the debugging session.
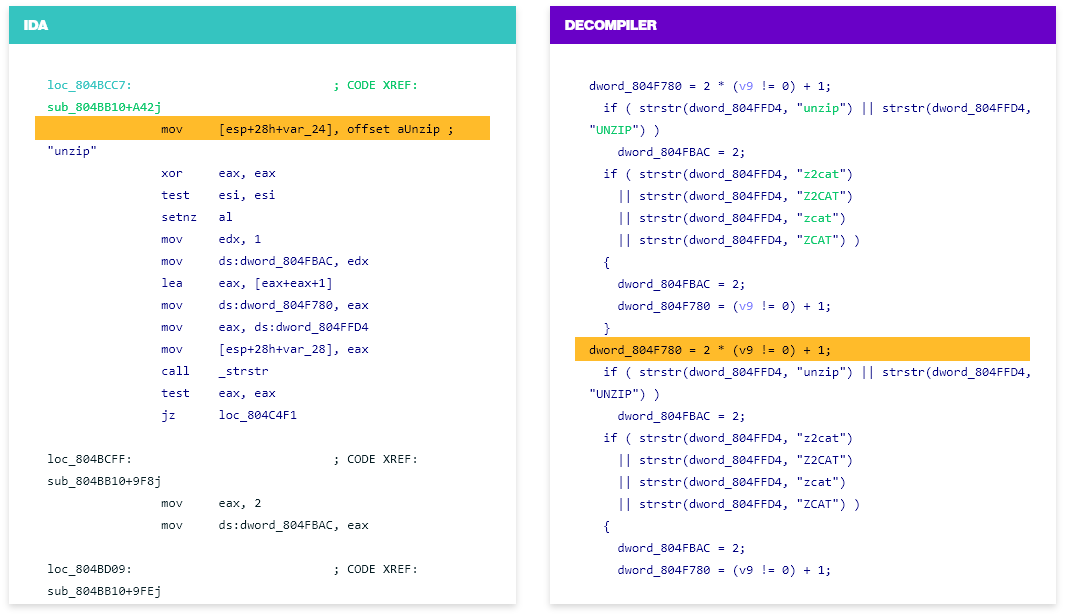
Although that’s an advantage and not a drawback of that tool, it could be overwhelming for beginners, leading to a lot of time and effort invested in figuring out how the tool works.
Or, let’s say that your developers mainly work in Python. You should do some research and find a debugger that is specifically built for Python, like Pycharm.
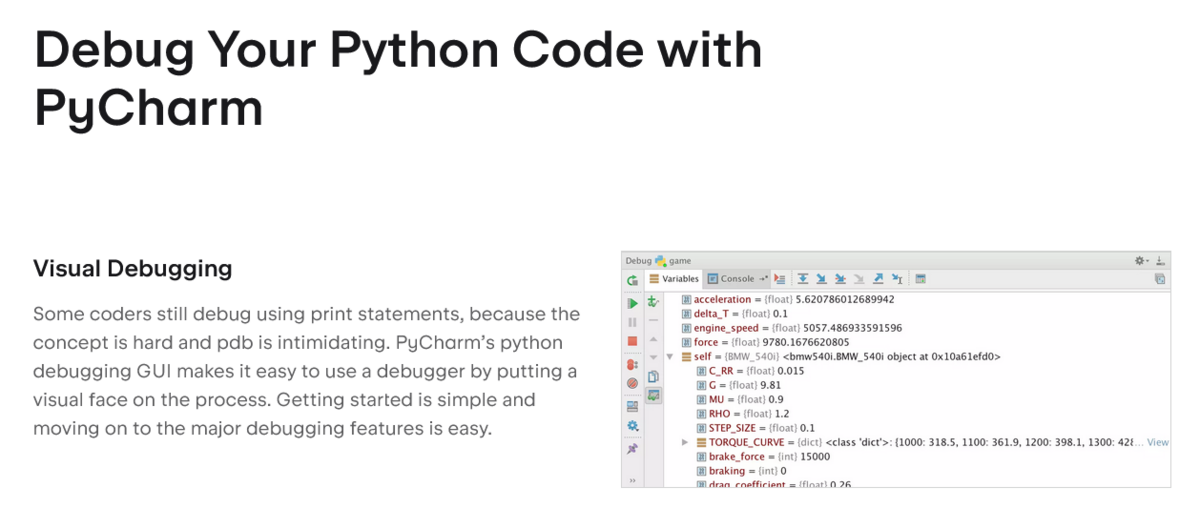
That way, you can increase your team’s productivity and work with a tool most suited for debugging your apps.
On the other hand, if your Python developers are trying to debug apps with RubyMine, a tool that works best with the Ruby programming language, that’s a mistake you should avoid.
All in all, choosing the wrong debugging tool can significantly set back you and your team.
If you don’t want to spend more time, effort, and patience on achieving mediocre results, don’t make that mistake.
One of the common mistakes while debugging apps is trying to find instant solutions to the problems.
On some level, that’s understandable. Software companies are in a never-ending race to develop better products and acquire more customers.
Therefore, developers can feel pressure to work quickly and solve any bug in the app as soon as possible.
Also, developers have many other responsibilities besides debugging, like writing code or daily meetings, and much more. They need to have time for all of that as well.
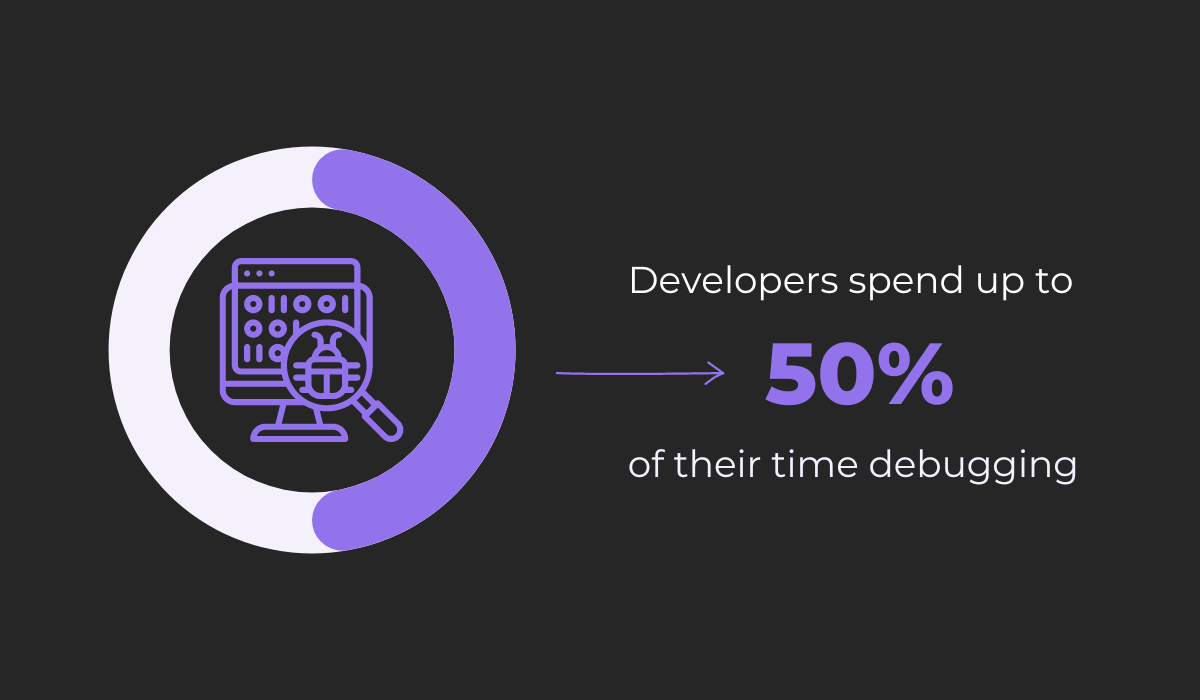
If you consider the data from the University of Cambridge, which indicates that debugging can take up about half of the developers’ time, it’s no wonder that they can make the mistake of rushing the process.
Of course, conducting the debugging in the least possible amount of time is always the best-case scenario. However, it isn’t always realistic.
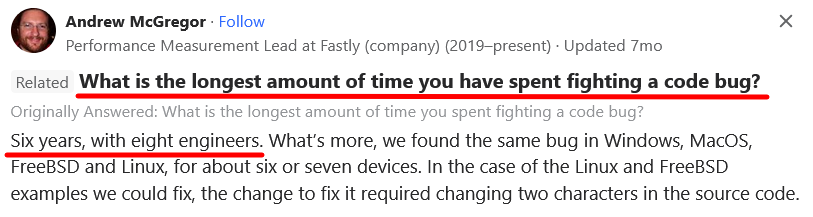
Some bugs can even be so stubborn that they compel you to devote a lot of time and resources to resolving them, like the one Andrew McGregor, an experienced software engineer, shared on Quora.
Luckily, you can solve most bugs in much less time than that and still get the benefits of approaching the issue systematically instead of rushing.
If you take your time while debugging, you can not only solve the problem but also gain a greater understanding of why it happened and, consequently, how to prevent it in the future.
On the other hand, if you rush the process and just copy and paste the solution you’ve found somewhere on the Internet, you might solve the problem without knowing what caused it and why the solution worked.
For example, there are communities like GitHub and Stack Overflow where you can ask others for help if you encounter a bug that stumps you.
That’s what this user below did:
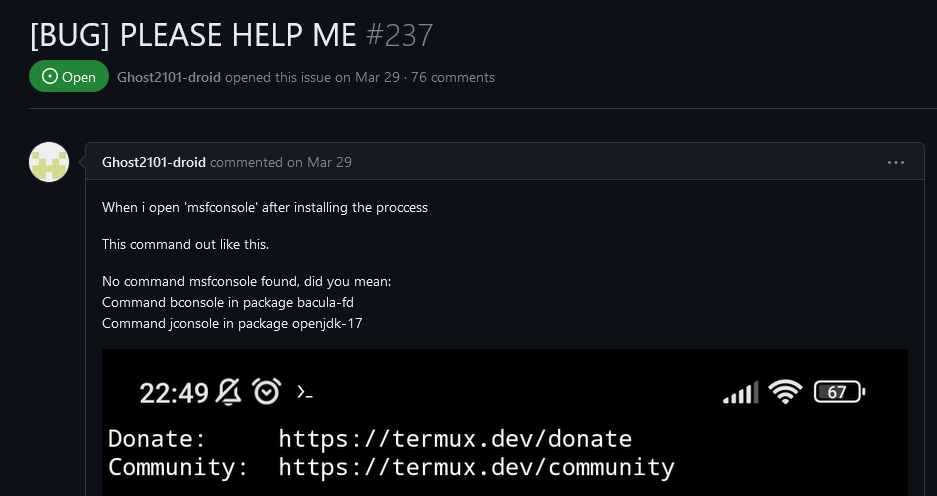
That’s the part of the post where they ask for help with the bug.
And they eventually solved the problem with the help of another developer, who guided them to the solution over a few dozen messages.
Ultimately, the bug was solved, and the thread’s author learned how to get to the solution.
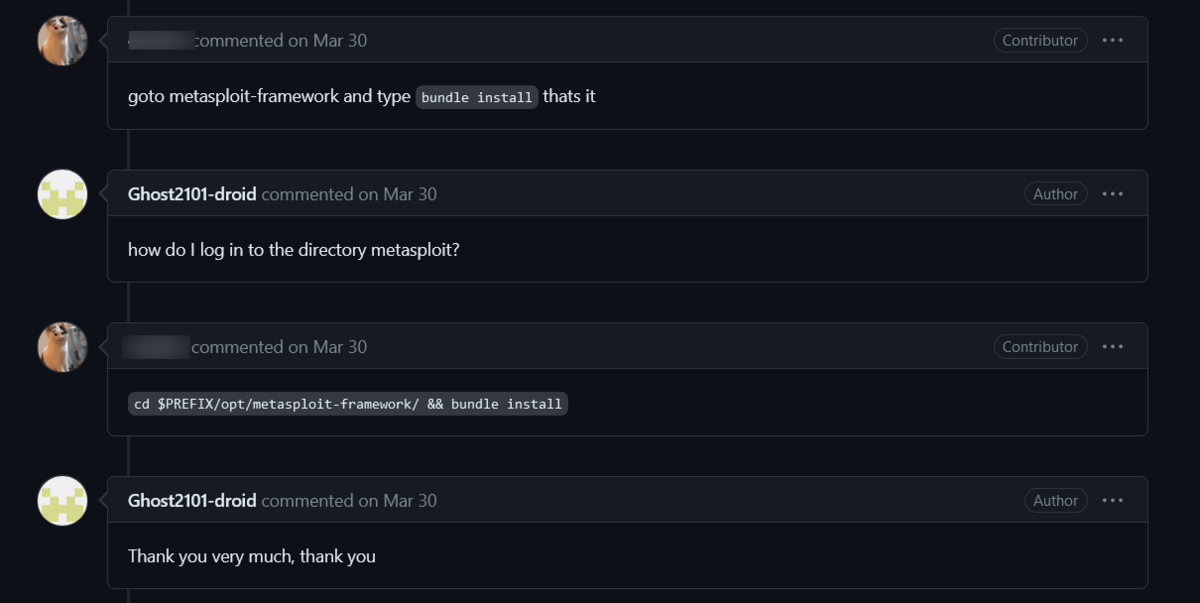
That whole thread, up to that point, is an example of a patient and gradual approach to debugging.
On the other hand, another user in the same thread didn’t want to go through the whole process and wanted a quick answer.
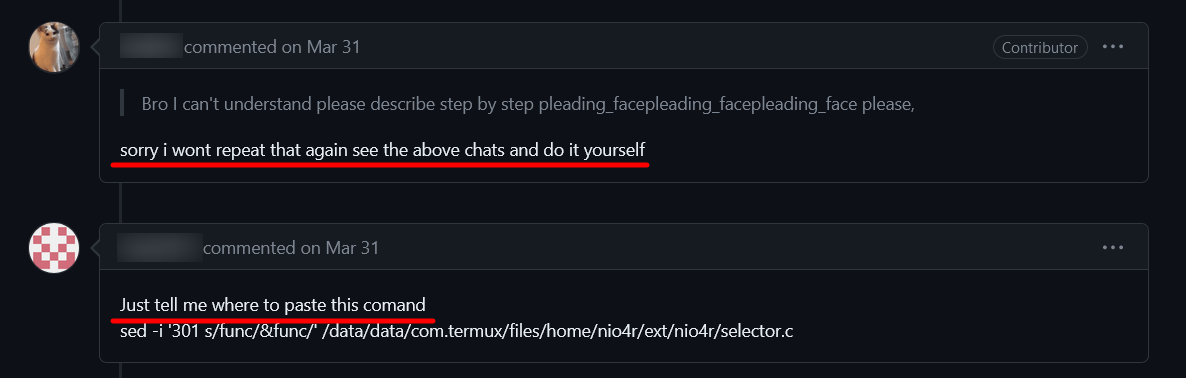
This approach is an example of rushing to the solution without understanding the bug and why it occurred.
A simple copy and paste of the command will most likely solve the bug, but if you take that approach to problems, your knowledge about the product and software development won’t improve.
Documenting the bugs you encounter and the steps you take to fix them can bring you and your team many benefits. However, many developers fail to do so.
To avoid that mistake, you should first prevent the one that leads up to it—thinking that the bug you’re facing will never occur again.
That’s far from the truth because the same bug can happen repeatedly in different modules of the application.
Considering that, you can easily see why not documenting the problem is a mistake.
Simply put, if you document the issue and the steps you took to solve it, you have a solution ready if you reencounter the same bug.
Furthermore, documenting your steps can help you solve the problem even when you first encounter it.
Here’s how Mike Wolfe, a software developer and Microsoft Access MVP, explains it:

That’s the similar effect that happens when you use rubber duck debugging.
The mere act of explaining the problem, in this case in writing, can help you gain new insight and observe the problem from a different perspective.
What’s even more helpful, you aren’t the only one who can benefit from documenting the problem—anyone from your team can save a lot of time and effort if the issue and the debugging process are documented.
Documenting the debugging process can be as simple as copying and pasting commands into an app like Notepad++.
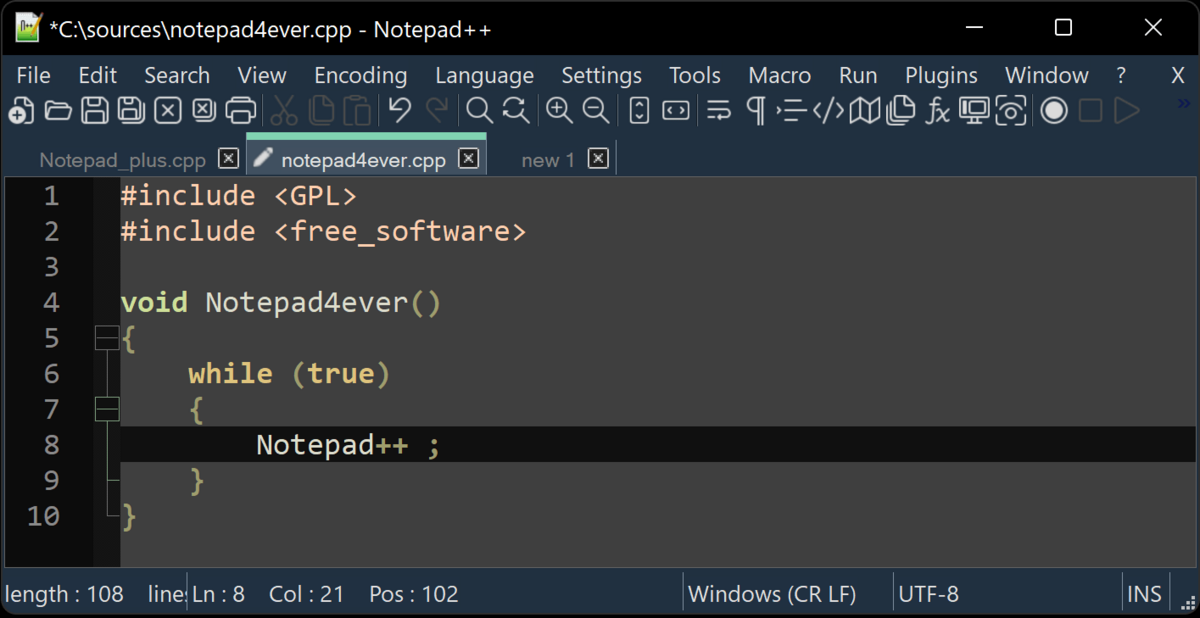
It’s a free text editor specifically designed to edit source code.
You can number lines, view multiple files with a split screen, and it supports syntax for over 70 programming languages.
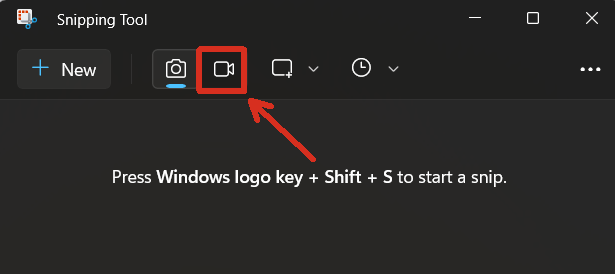
If you’re facing a particularly complex problem and writing is simply too cumbersome or takes too much time, you can record your screen while debugging.
There are many screen recorders to choose from, including the simplest solution of using the screen recording feature in Snipping Tool, an app built into Windows.
Whatever method of documenting you choose, the result will benefit future debugging.
You and your team will be able to solve the same or similar problems faster because you’ll have a resource to consult.
Thanks to that, if the bug occurs again, whoever tackles it will have a clear plan of what steps to take and which hypotheses aren’t working, which will facilitate solving a specific issue.
Therefore, don’t make the mistake of letting the steps to the solution evaporate into thin air.
When you have a big problem in front of you, what’s your instinctive response?
If you react by tackling the entirety of your problems all at once, you might be making the mistake of taking a less efficient approach.
In most cases, a more systematic, step-by-step approach can produce better results in less time.
The same is true with app debugging.
For example, imagine having a piece of code like this one below, and knowing that there is an error somewhere in there:
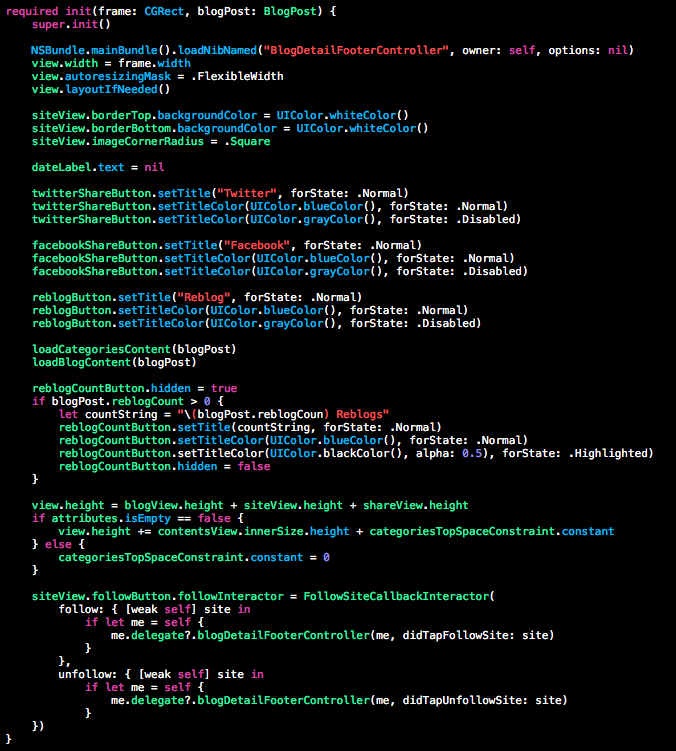
Diving into it can be overwhelming if you don’t have a clear strategy. So, how can you avoid that mistake?
And one of the most efficient strategies is taking a step-by-step approach or, in the case of app debugging, breaking the problem down into smaller parts.
By doing that, each part of the code is like an individual step that you take toward a solution.
You can isolate smaller parts of one large piece of code in various ways. One of them is commenting out the code.
That means turning parts of your code into comments so you can identify which part of the code is causing the problem.
For example, here’s what that looks like in C++:
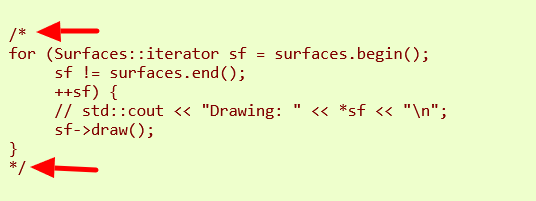
Different programming languages have different comment symbols, but the point is that whatever is in between them is treated as just that, a comment, and the program won’t run it.
So, the method is simple—you comment out a part of the code and see if the bug is still present.
If it is, then it’s not in that part of the code you’ve commented out, so you repeat the process with another one until you isolate the part with the error.
Another method of splitting the problem into smaller parts is binary search.
Binary search is a debugging method where you determine the area where the bug should be and narrow it down until you find the error.
Brooklin Myers, an experienced software engineer, illustrates it like this:
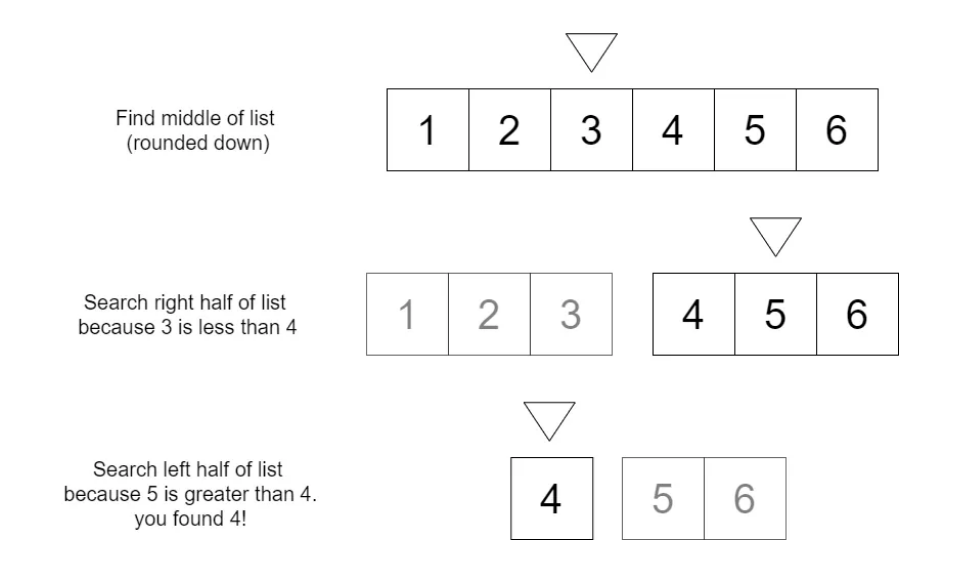
In other words, imagine if you had 500 lines of code with a bug somewhere in it.
By opting for a binary search, you would, for example, comment out the last 250 lines of code. If the bug was still present, you would know it’s in the first 250 lines.
Then you could break down that part of the code in half, test it, and continue the same pattern until you narrow it down enough to find an error.
Whichever method you choose, make sure to avoid the mistake of diving into a complex problem without untangling it first.
If you fail to do that, the debugging could cost you a lot of patience and time.
App debugging can be long, tedious, and frustrating for developers, especially if they don’t collaborate with others.
It’s not only a matter of piling on more people on one issue. Usually, a solitary developer will solve the problem on their own, sooner or later.
However, the longer they spend on one issue, the harder it can become to see the solution.
Having a pair, or more, of fresh eyes can significantly help detect a solution just because more developers have different perspectives, experiences, and knowledge levels.
In addition to solving the problem faster, you can also save time by not having different developers repeat the same work and test the same hypotheses.
For example, software engineer Jackie Luo wrote about that problem while working at Nylas.
There was a bug in the software, and their activity on it looked like this:
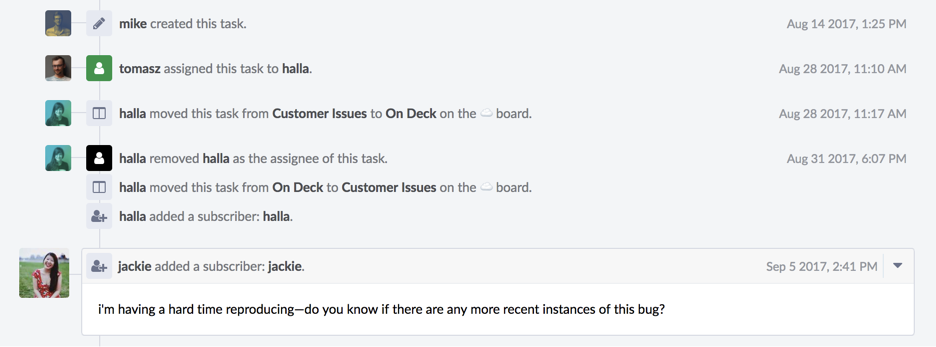
In short, the task was created when the user reported the bug.
Almost two weeks later, an engineer was tasked with solving it. After a few days, Luo herself took on the task but didn’t manage to solve it.

Capture, Annotate & Share in Seconds with our Free Chrome Extension!
As she describes, their process was inefficient for several reasons, but the main one was repeating the work that others had already done.
The developers who worked on the task didn’t know what the developers before them had tried because they weren’t collaborating.
If we had been debugging collaboratively, each person would have been leaving breadcrumbs for the next person to make sure progress wasn’t lost along the way.
You can listen to Jackie Luo describe that particular case and the advantages of collaborative debugging in the video from the LeadDev New York conference.
Luckily, there are many tools that can help you collaborate with your team members on app debugging.
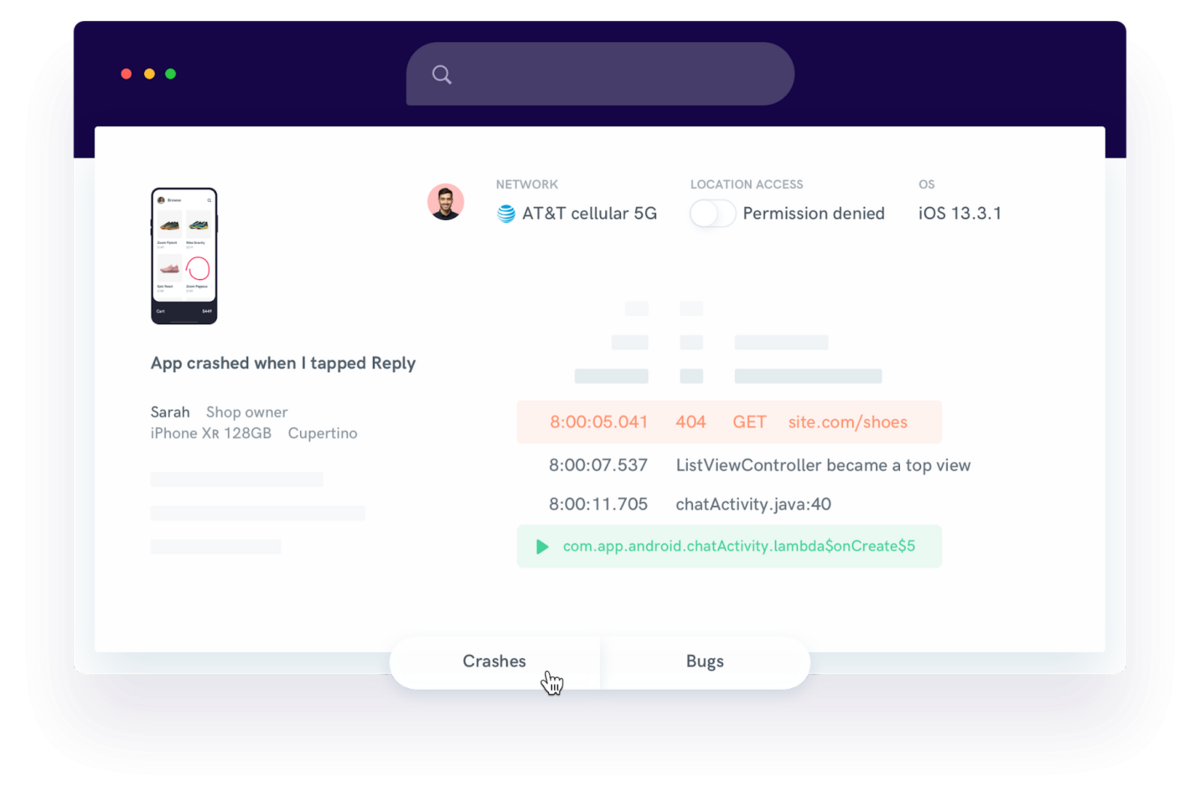
For instance, our own solution Shake is a bug and crash reporting app that offers collaborative-friendly features.
When users or testers spot the bug, they can just shake the phone, and the app will automatically create a detailed bug report with all the relevant information needed to fix the bug.
When you receive a bug report, you can work on it with other developers in Shake’s dashboard.
Although Shake is not a debugger, it can make the whole process of debugging apps easier, especially if you collaborate with your team on it.
App debugging can be time-consuming and challenging, but avoiding common mistakes can make it much more manageable.
The mistakes we’ve examined in this article can harm your app-debugging process. However, you can avoid them easily if you follow our advice.
Paying attention to those mistakes will pay off in the long run, resulting in a streamlined app debugging process that will guarantee great results every time.
From internal bug reporting to production and customer support, our all-in-one SDK gets you all the right clues to fix issues in your mobile app and website.
We love to think it makes CTOs life easier, QA tester’s reports better and dev’s coding faster. If you agree that user feedback is key – Shake is your door lock.
Read more about us here.

Add to app in minutes

Doesn’t affect app speed

GDPR & CCPA compliant

Unexpected things pop up
Just like bugs in your app or web 🐛 Fix them now with just one reporting tool.