
Bug reporting takes time. Here’s how AI helps teams work more efficiently

App session replay tools let you see exactly how users interact with your app.
You can see what they tapped, where they got stuck, and which moments triggered rage clicks or silent drop-offs.
They help product and development teams understand user behavior, catch bugs, and improve UX with less guesswork.
In this guide, we’ll review seven leading tools and break down their strengths and limitations, starting with Shake.
Table of Contents
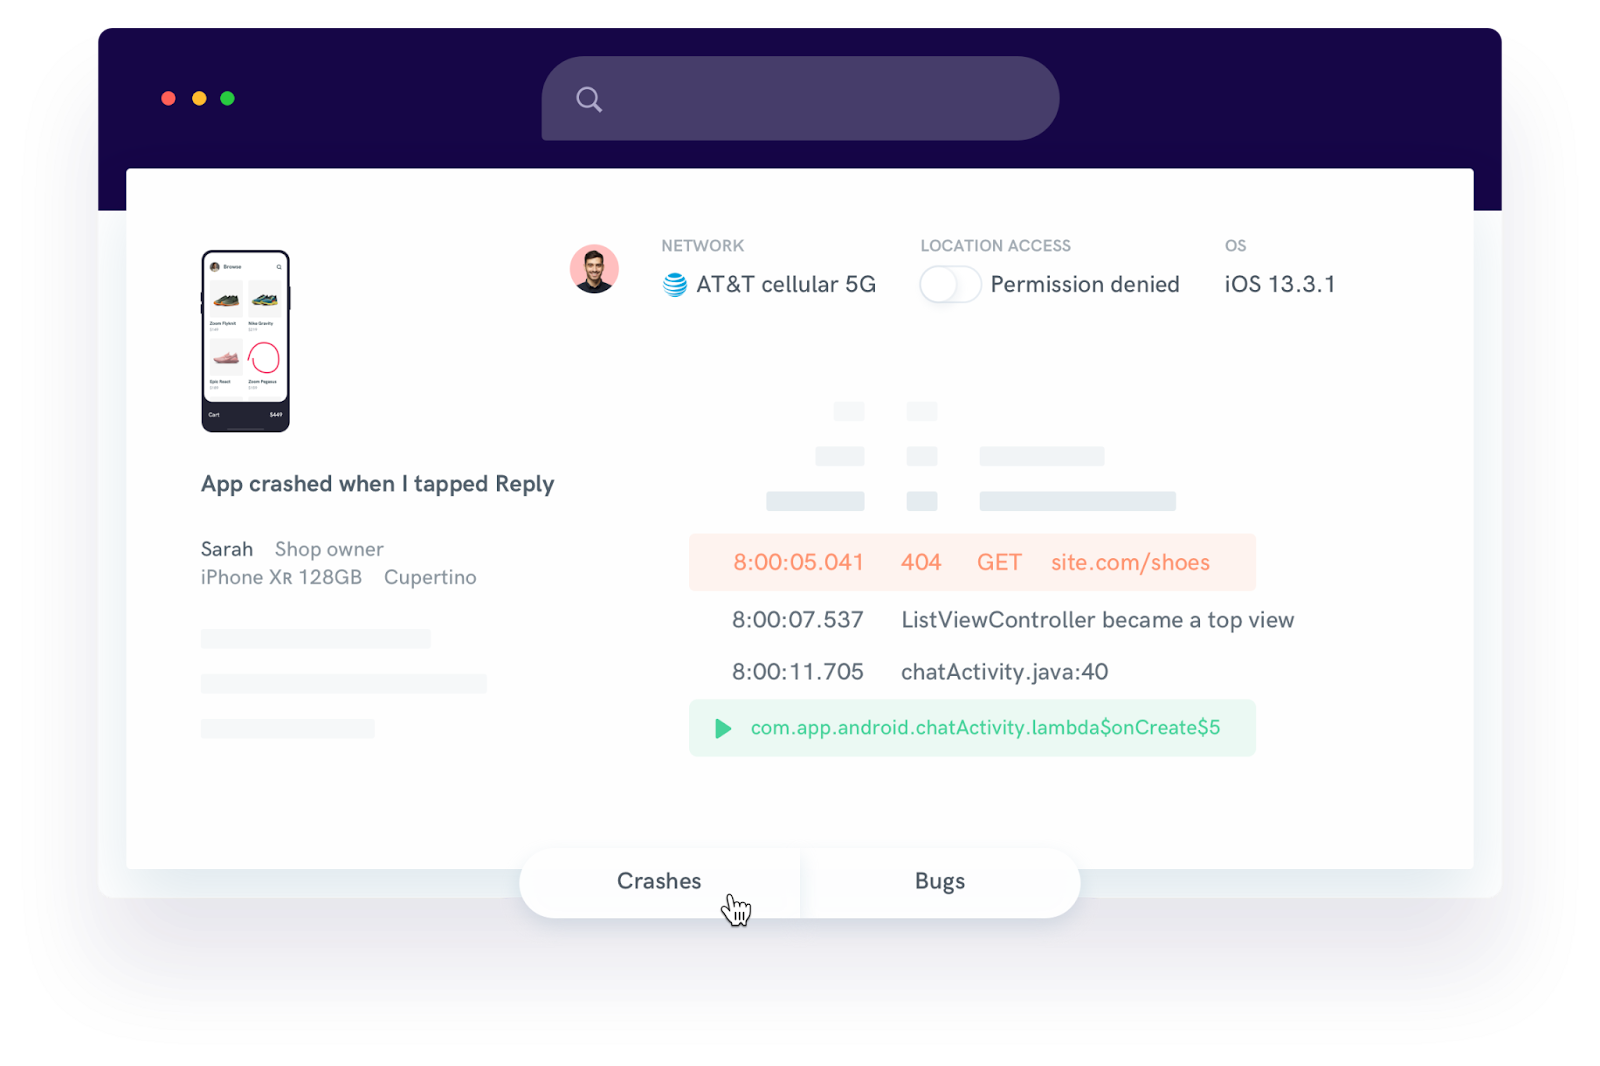
Shake is a bug and crash reporting tool that includes session replay as part of a broader feature set built for fast, efficient debugging.
Its session replay feature automatically records user interactions within your web app and attaches them to submitted bug reports.
No extra setup is required, and you can enable or disable the feature depending on your needs.

Replays are limited to DOM-based interactions, so visual elements like canvas or video may not be fully captured.
And if your app relies on external assets that fail to load, the replay might appear incomplete.
But session replay is just one part of what Shake collects.
Each report comes with all the technical details needed to reproduce and resolve the issue, including:
Moreover, when users trigger Shake, a screenshot of the app is captured automatically and attached to the ticket.
They can choose to remove it, draw on it, or mask sensitive data before submitting.

Get unreal data to fix real issues in your app & web.
There’s also an option to record their screen manually using a built-in recorder.
These user-added videos can help teams better understand the steps behind a bug or request.
Shake also supports real-time chat, so developers and users can communicate directly within the app to clarify reports.
All these features combined lead to faster issue resolution and fewer delays, as one Shake user points out:
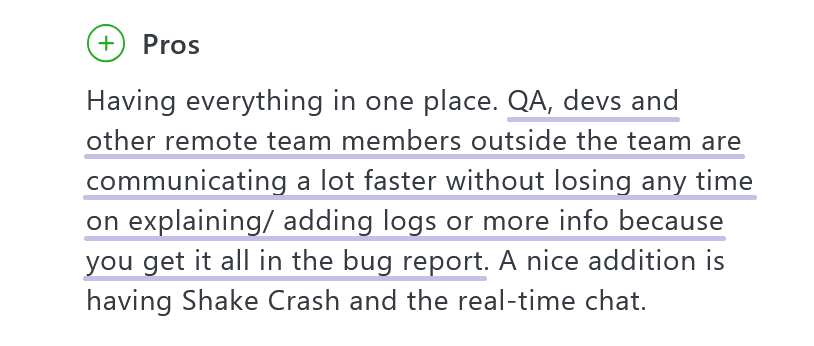
Shake’s pricing is straightforward:
It offers a free plan for small teams (three users, 20 bug reports per month), with paid tiers starting at $160 per month for unlimited reports and up to four apps.
For larger organizations, the $340/month plan supports unlimited apps and reports.
There’s also a free Chrome extension that makes Shake even more accessible.
While not everything in the session replay is flawless, the combined functionality makes Shake a well-rounded choice, especially when smooth debugging workflows and fast collaboration are your priorities.
UXCam is built specifically for mobile apps and offers much more than just session replays.
While it now also supports web apps, its core strengths and feature set are still tailored primarily for mobile experiences.
UXCam automatically tracks user gestures, screen transitions, crashes, and common frustration signals, while also providing heatmaps and mobile-specific analytics.
Session replays include detailed data on single and double taps, long presses, swipes in all directions, zooms, and gesture trails, giving product and UX teams a rich view of how users interact with each screen.
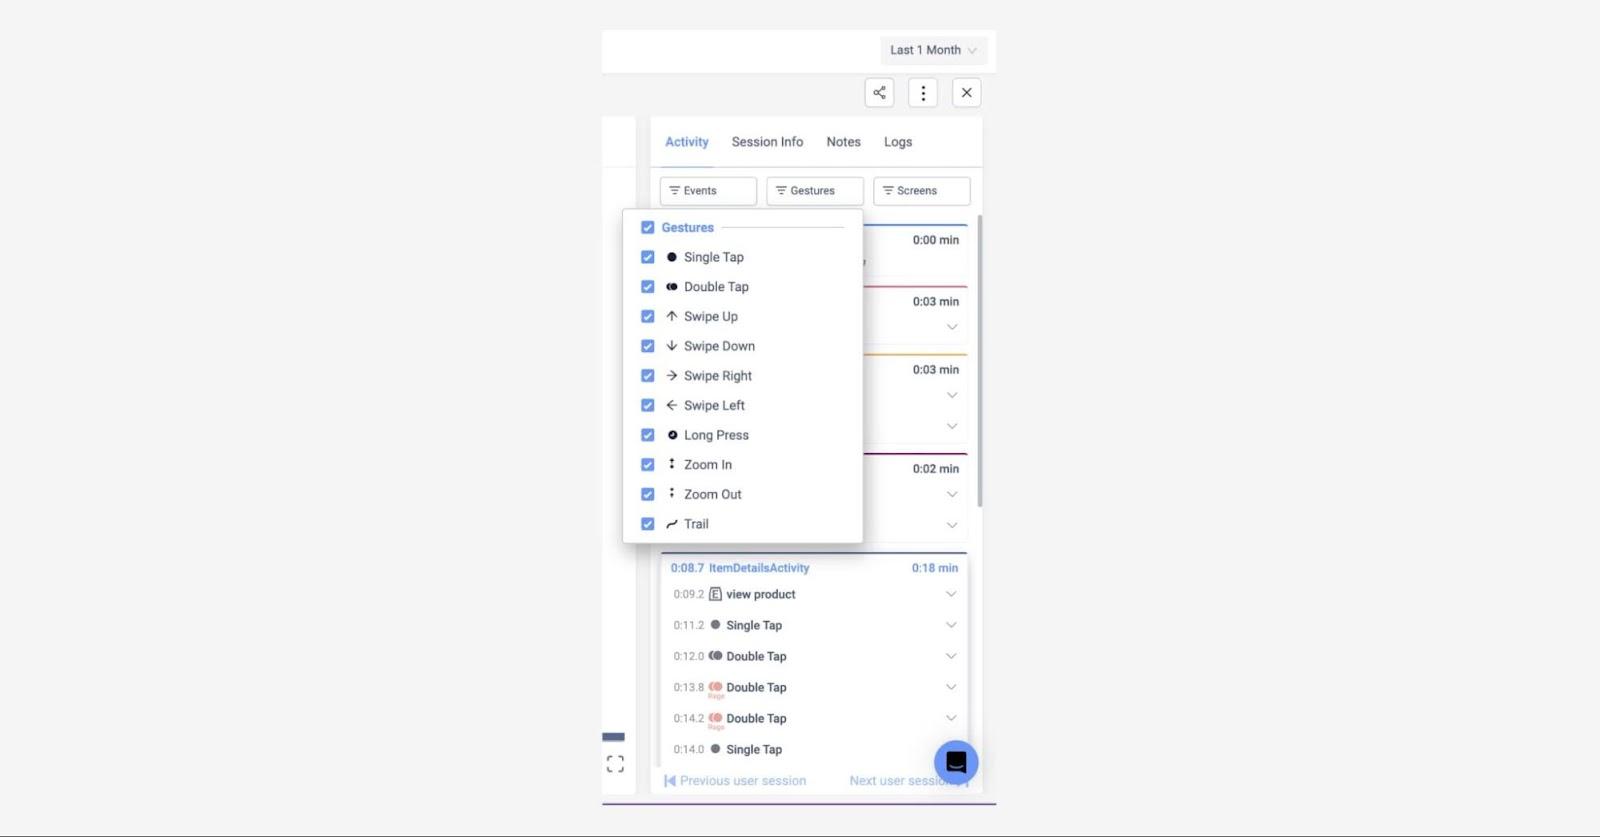
Automatic event tagging helps highlight patterns like rage taps or dead clicks, and sessions can be filtered by behaviors, technical issues, or UI events like crashes or freezes.
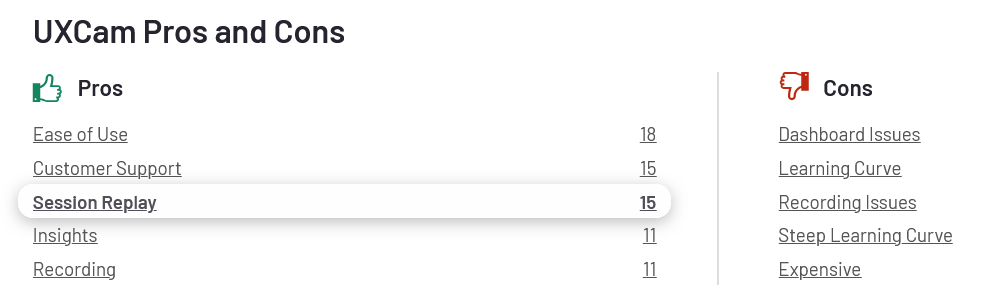
According to reviews on G2, users appreciate UXCam’s ease of use, helpful support team, and detailed tracking.
However, some pointed out a steep learning curve and dashboard issues, particularly when trying to locate sessions worth watching.
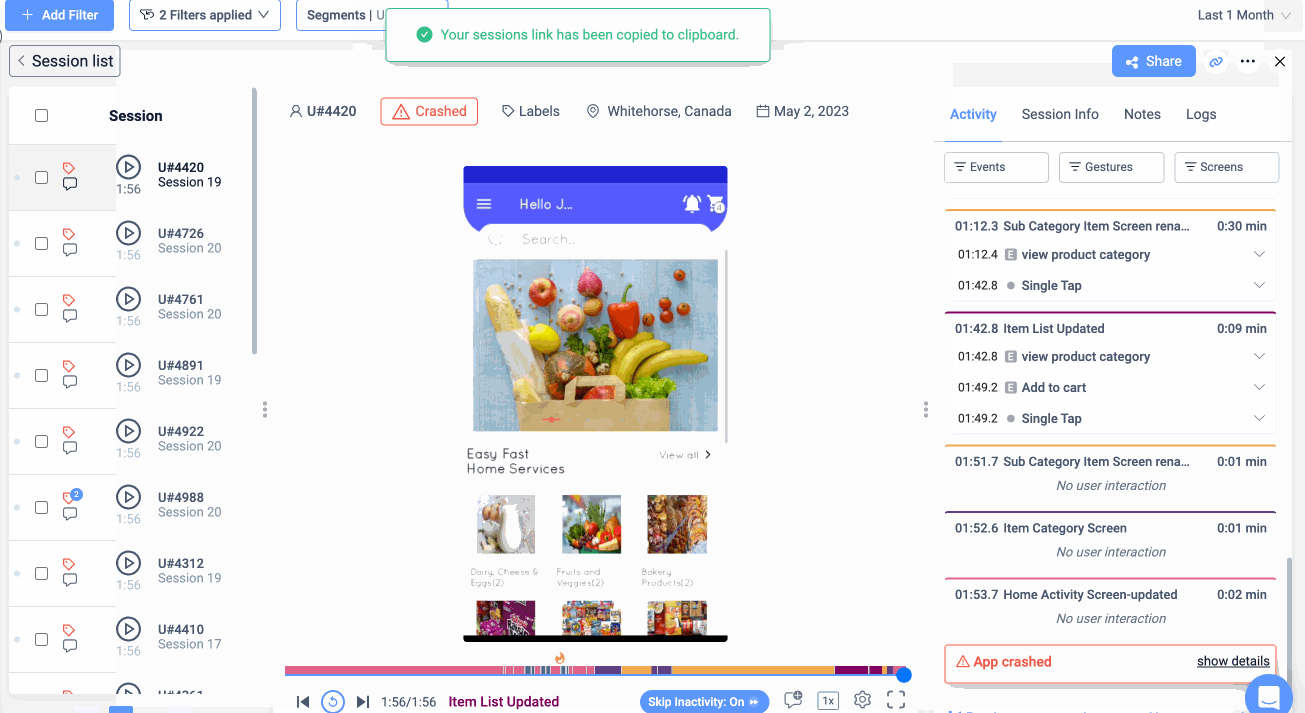
After hearing from users that the interface made it difficult to find the right sessions, UXCam revamped its filtering and replay tools.
A new “Rage Quit” filter now shows sessions where a rage tap occurs just before the user exits the app, while redesigned quick filters and session markers make it easier to jump to frustration points.
“Fires” and “snowflakes” mark rage taps and UI freezes right on the replay timeline, and you can skip over inactive moments to save time.
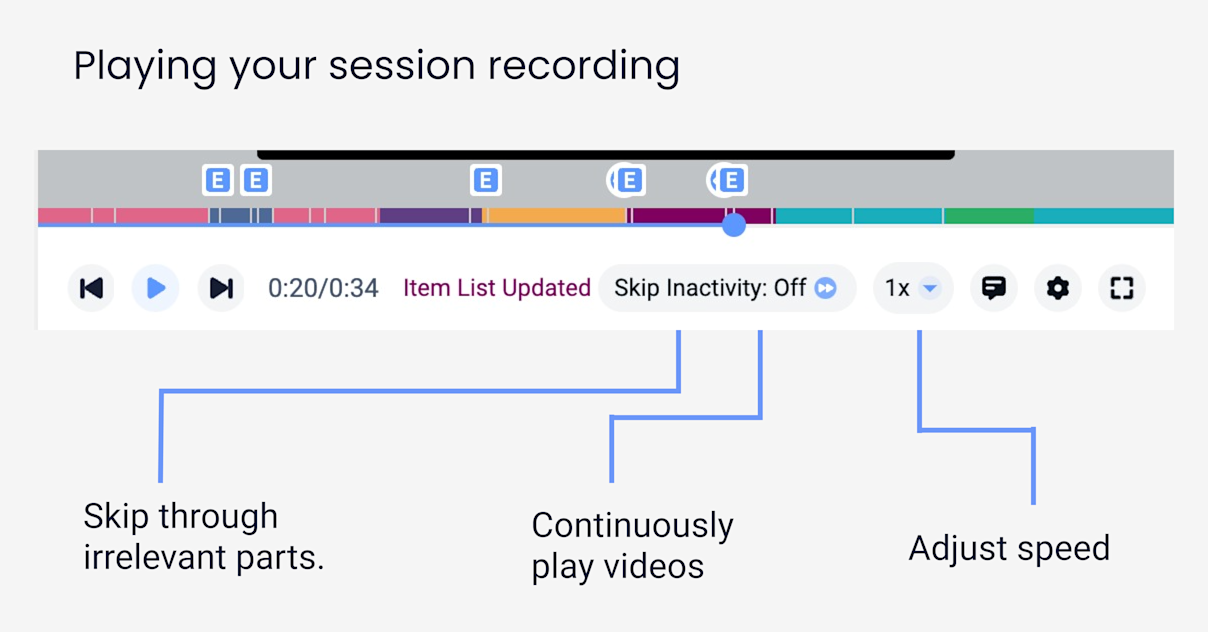
You can also share session links or export logs for debugging.
As for the pricing, there’s a free plan with 3,000 monthly sessions, though access to filters and replays is limited.
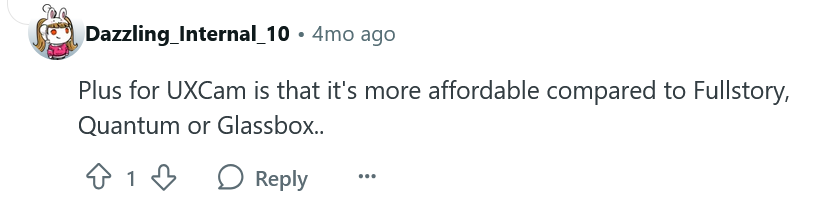
A 14-day free trial is available, and while pricing for paid plans is request-based, users report it’s more affordable than alternatives like Fullstory.
If you’re building mobile apps and need visibility into real user behavior, UXCam is a capable, mobile-first option that’s actively evolving based on user feedback.
Fullstory combines session replay with mobile and web analytics, blending user behavior tracking with lightweight product insights.
It captures all the essentials, including session replays, debug logs, filters, scroll and heatmaps, plus indicators like dead clicks and rage taps.
But one thing it lacks is crash reporting, which some teams might need for a fuller debugging workflow.
Session replays are smooth and detailed, though they don’t offer inactivity skipping.
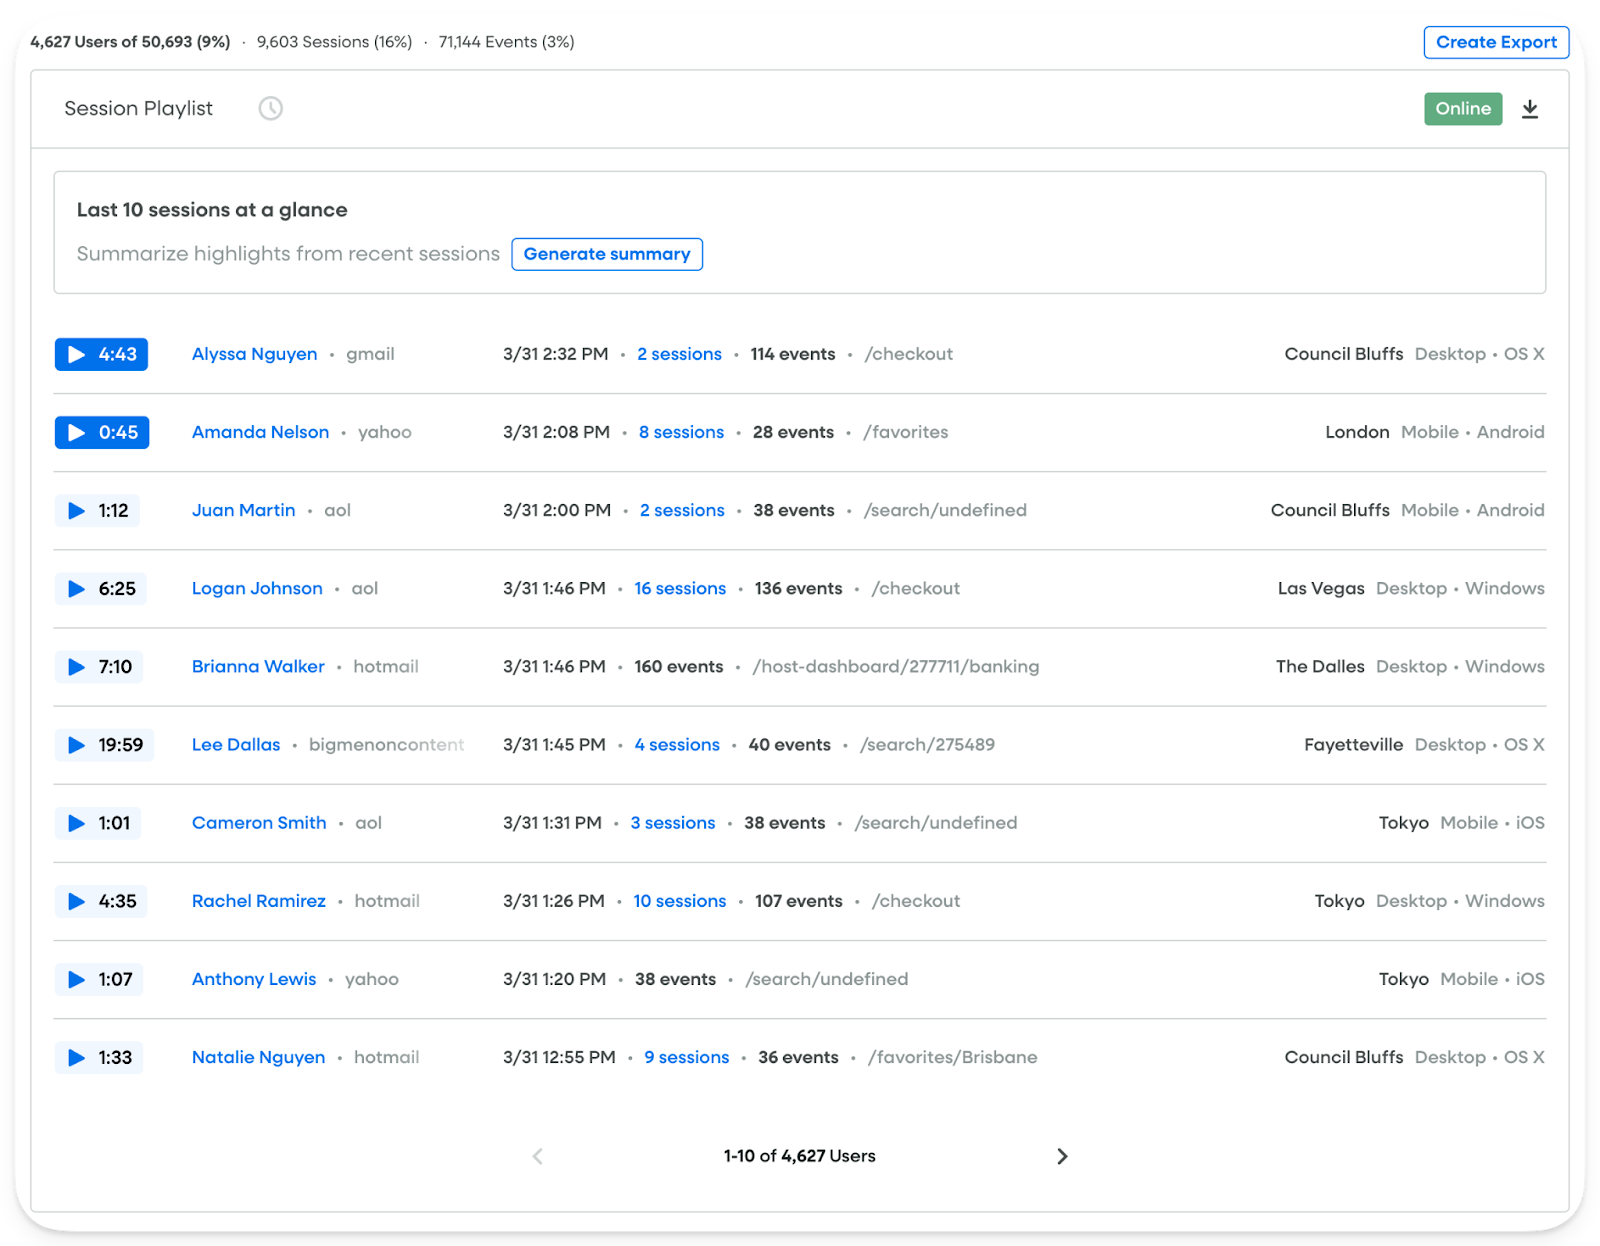
Instead, you can increase the replay speed to get through sessions faster.
Fullstory also lets you take notes while watching, placing comments directly on the timeline with the Note and Share feature.
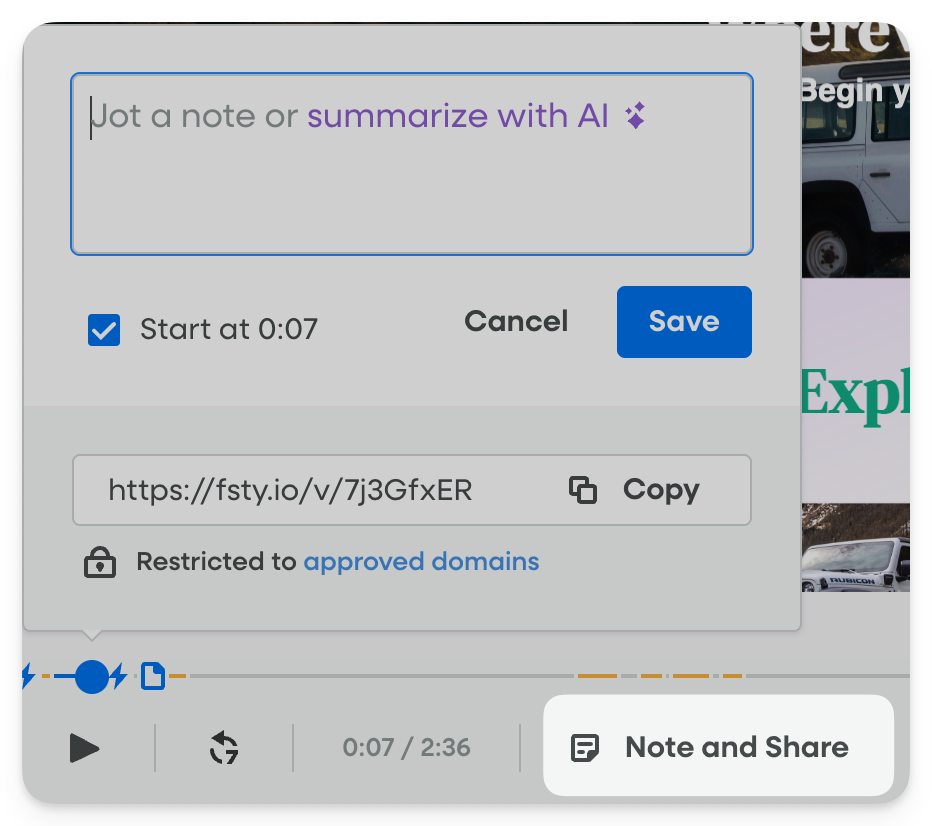
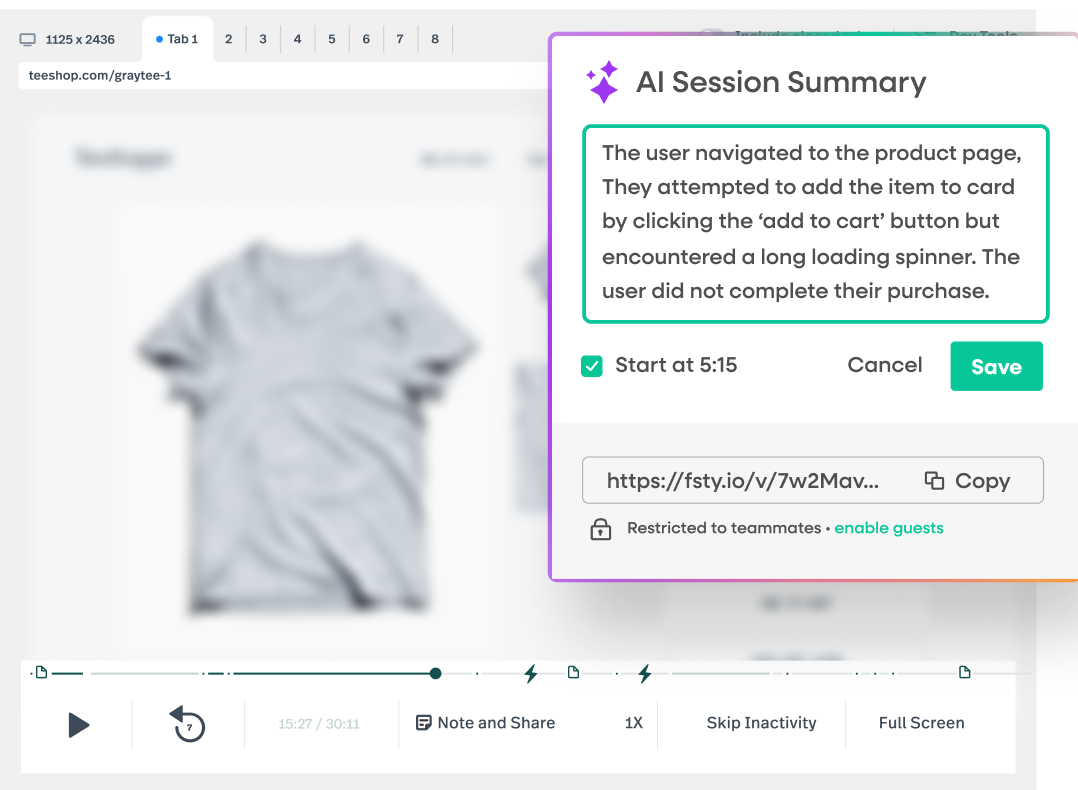
Teams using higher-tier plans can access StoryAI, a generative AI feature that summarizes sessions automatically and highlights key moments.
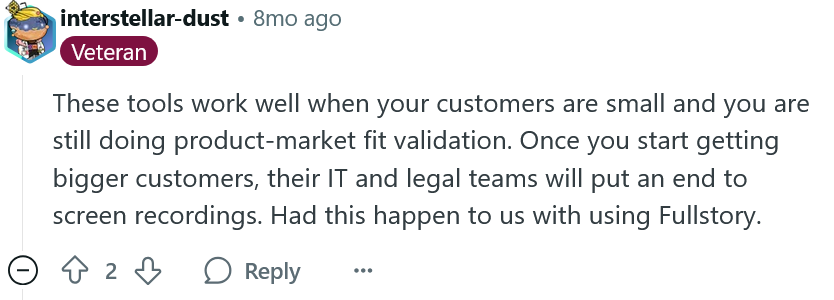
Privacy is a sensitive topic for any tool in this category.
While Fullstory emphasizes customizable privacy controls—letting teams mask specific elements or inputs—some users have still faced pushback from enterprise clients.
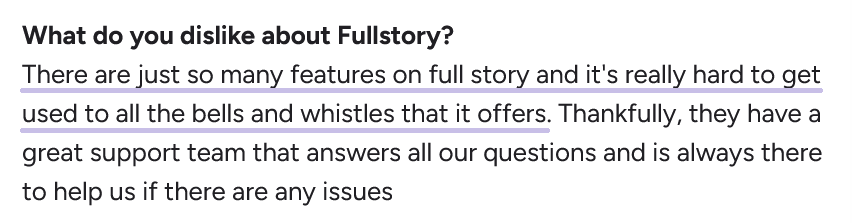
Despite that, Fullstory is still popular with teams focused on validating feedback and improving UX, as one G2 reviewer shares:
“The session replay feature is especially helpful for identifying pain points and validating feedback from users or support teams. It’s also easy to share recordings across teams to drive alignment and prioritization.”
On the flip side, some users mention that the tool’s large feature set can be overwhelming, especially for beginners.
There are three pricing tiers available, but details aren’t publicly listed, so you’ll need to reach out for a quote.
For teams ready to invest in a powerful but complex platform, Fullstory offers strong replay capabilities, as long as you’re prepared for the learning curve.
Microsoft Clarity is a free session replay tool that delivers impressive value for zero cost.
It supports all the basics:
You can filter replays by screen activity, user segments, and specific events, which makes it easier to isolate meaningful behavior from general usage.

To streamline collaboration, Clarity lets you download recordings, mark important sessions, and share clips with teammates or external stakeholders.
You can also label sessions to highlight specific customer issues and keep track of key findings across your team.
One useful feature is its integration with Google Analytics, allowing you to sync GA data into Clarity for a more unified view of the user journey.
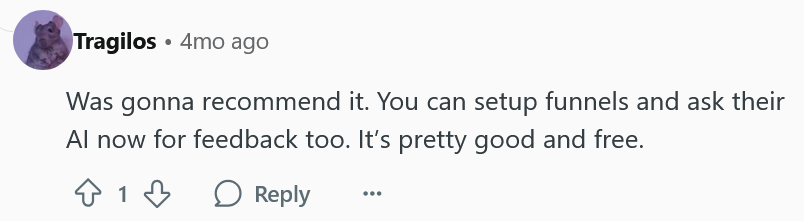
Similar to Fullstory, Clarity offers AI-generated summaries of sessions to speed up analysis—but for free.
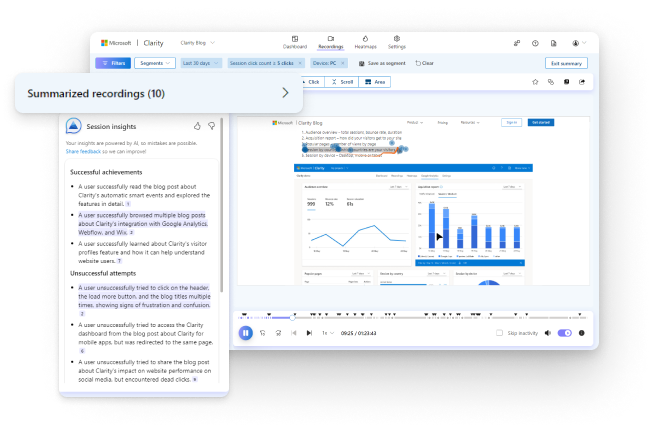
That’s one more reason why users like it:
However, Clarity doesn’t offer advanced debugging features like console logs or crash reports, so it’s less suited for developer workflows.
While it’s great for spotting UX issues and high-friction patterns, it lacks the deeper diagnostics some teams may need.
Privacy is another point mentioned by users, which could raise concerns for teams operating in strict regulatory environments.
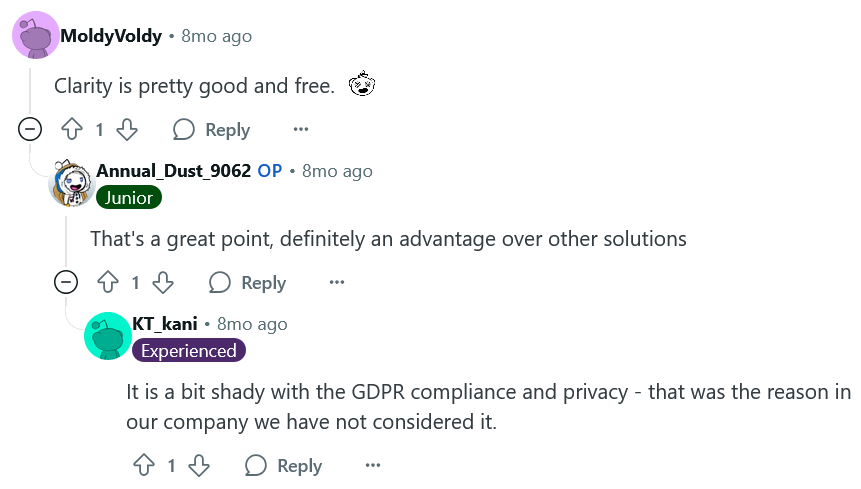
Still, if you’re looking for an easy, no-cost way to start analyzing user behavior, Clarity is one of the best entry-level options available.
It’s especially useful for marketing and UX teams that want to spot usability issues without needing complex setup or developer support.
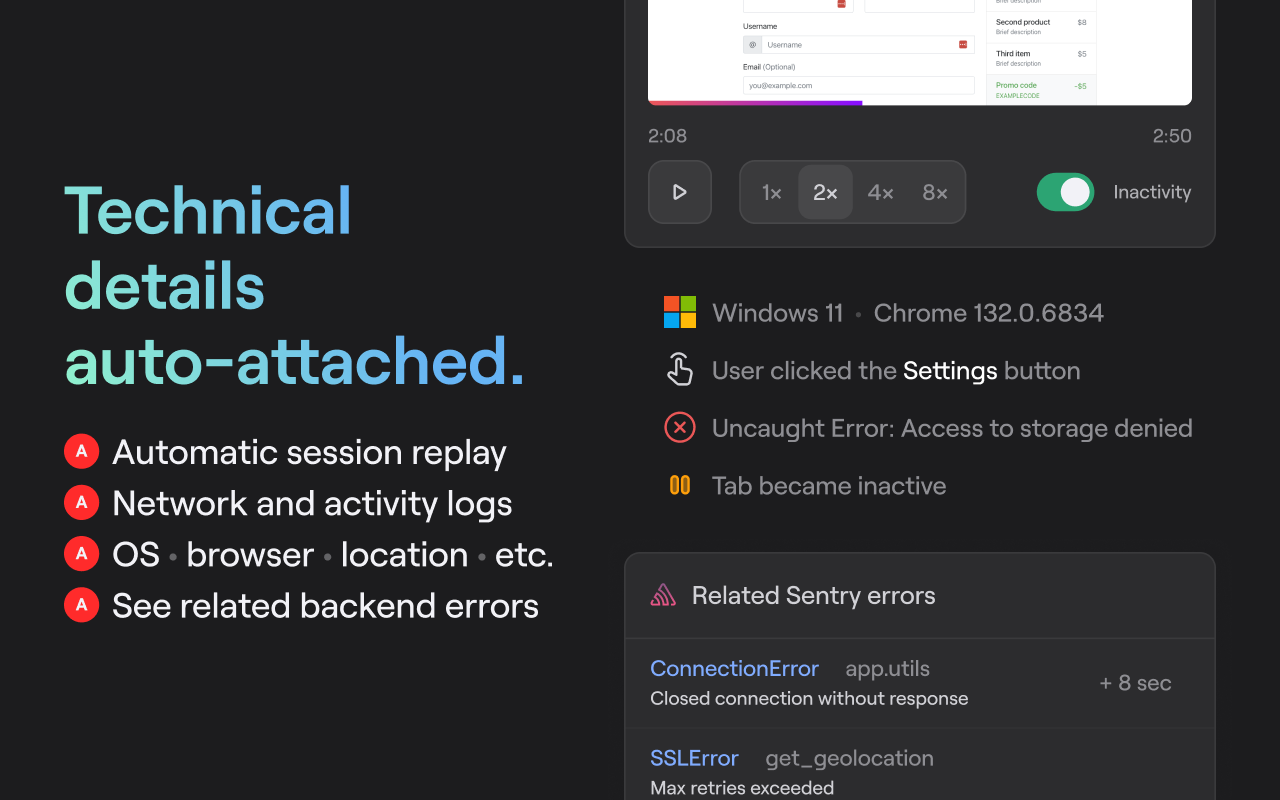
Sentry is best known for error tracking, but its session replay feature for both web and mobile adds another layer to its developer-focused workflow.
What sets Sentry apart is how well session replays are tied to other telemetry data.
You can watch what a user did right before an error occurred, even if that error happened three services down the stack, explains the Session Replays’ team member:
“Session Replay has insights such as connecting replays to other telemetry data like spans and errors through traces, so you can have a replay of the user’s session even when looking at a backend error 3 services down.”
The replay includes a DOM snapshot-based video, synced with rage clicks, network requests, console logs, memory usage, and more.
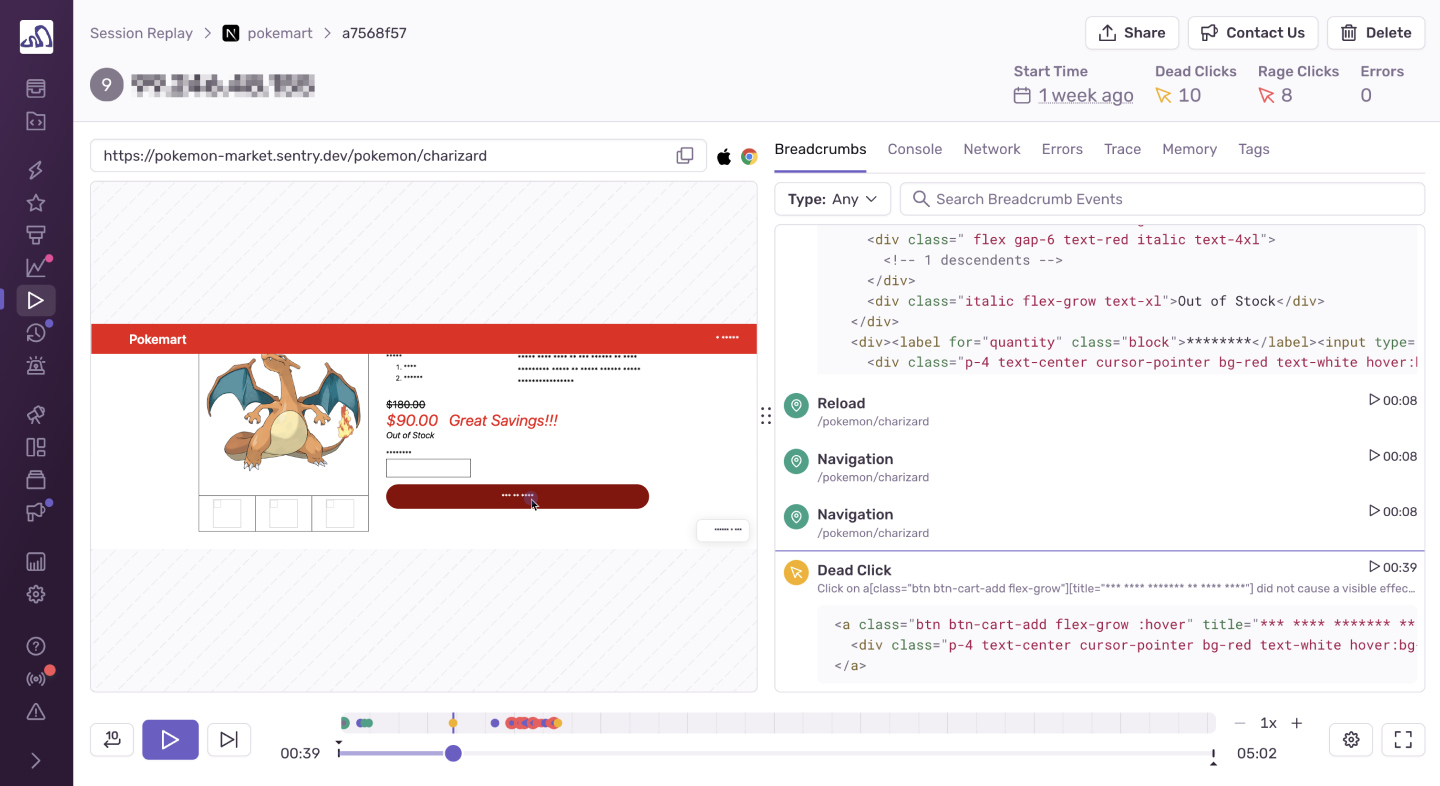
You also get a zoomable timeline, breadcrumb trails for user actions, and error markers you can click to jump to the moment they occurred.
For React/Next.js apps, Sentry offers a unique Hydration Error diffing tool that visually compares the DOM before and after hydration issues.
Replays are also tied to user feedback.
Privacy is built in by default, masking inputs and removing media.
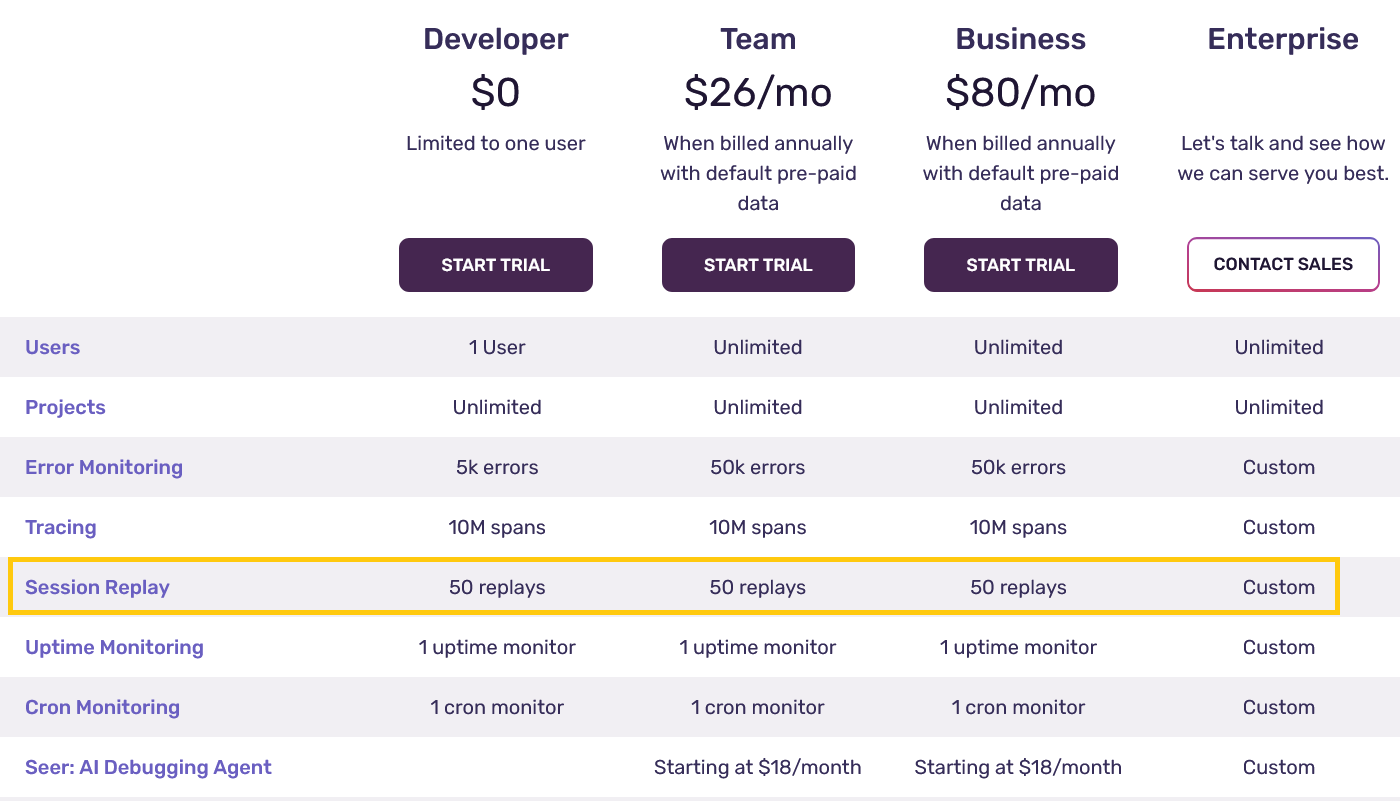
That said, pricing can be a sticking point.
There’s a free plan for solo devs, but teams needing higher volume or advanced features will see costs rise quickly.

Capture, Annotate & Share in Seconds with our Free Chrome Extension!
One user noted that exceeding your quota can temporarily cut off visibility, which may disrupt workflows:
“I don’t like that even if I have a subscription, I’m not able to see all the error that exceeds the subscription amount, which means if you exceed the subscription, then your Sentry work is dead until the next billing date.”
The concern about hitting caps applies to both errors and replays (50 replays in all plans except Enterprise).
Still, if you’re already using Sentry for error monitoring, error tracking, the session replay feature is a natural and valuable extension.
LogRocket is a session replay tool built for product and engineering teams.
Its standout feature is pixel-perfect session replays, showing every user interaction in high fidelity.
They are paired with technical data like console logs, network requests, DOM snapshots, and performance metrics such as Web Vitals, CPU usage, and network speed.
LogRocket also masks sensitive user data and offers AI-generated insights through its Galileo feature, which flags sessions where users struggle.
Teams use LogRocket to troubleshoot bugs, trace user issues, and improve UX.
One G2 reviewer noted:
“The session replay functionality also gives us access to error logging and bug tracing, which is saving our support efforts.”
However, session volume can become a challenge.
LogRocket records all sessions by default, including short ones, which means it’s easy to reach your quota, especially on mid-tier plans.
Users point out that without proper configuration or filtering, important sessions can get lost in noise:
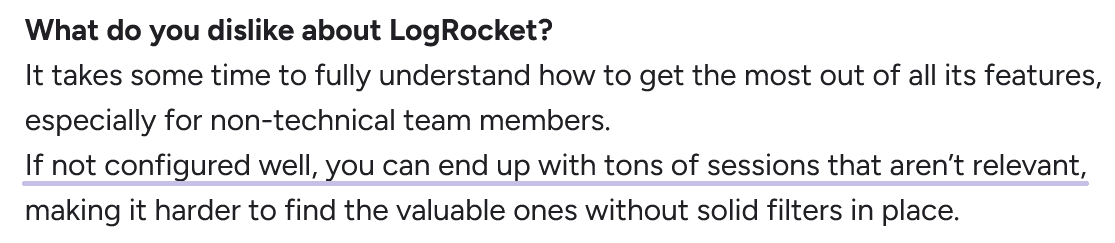
Non-technical users may also face a learning curve, and some have flagged performance overhead on the client side, and a need for more advanced filtering.
As for the pricing, LogRocket offers a free plan with 1,000 sessions per month.
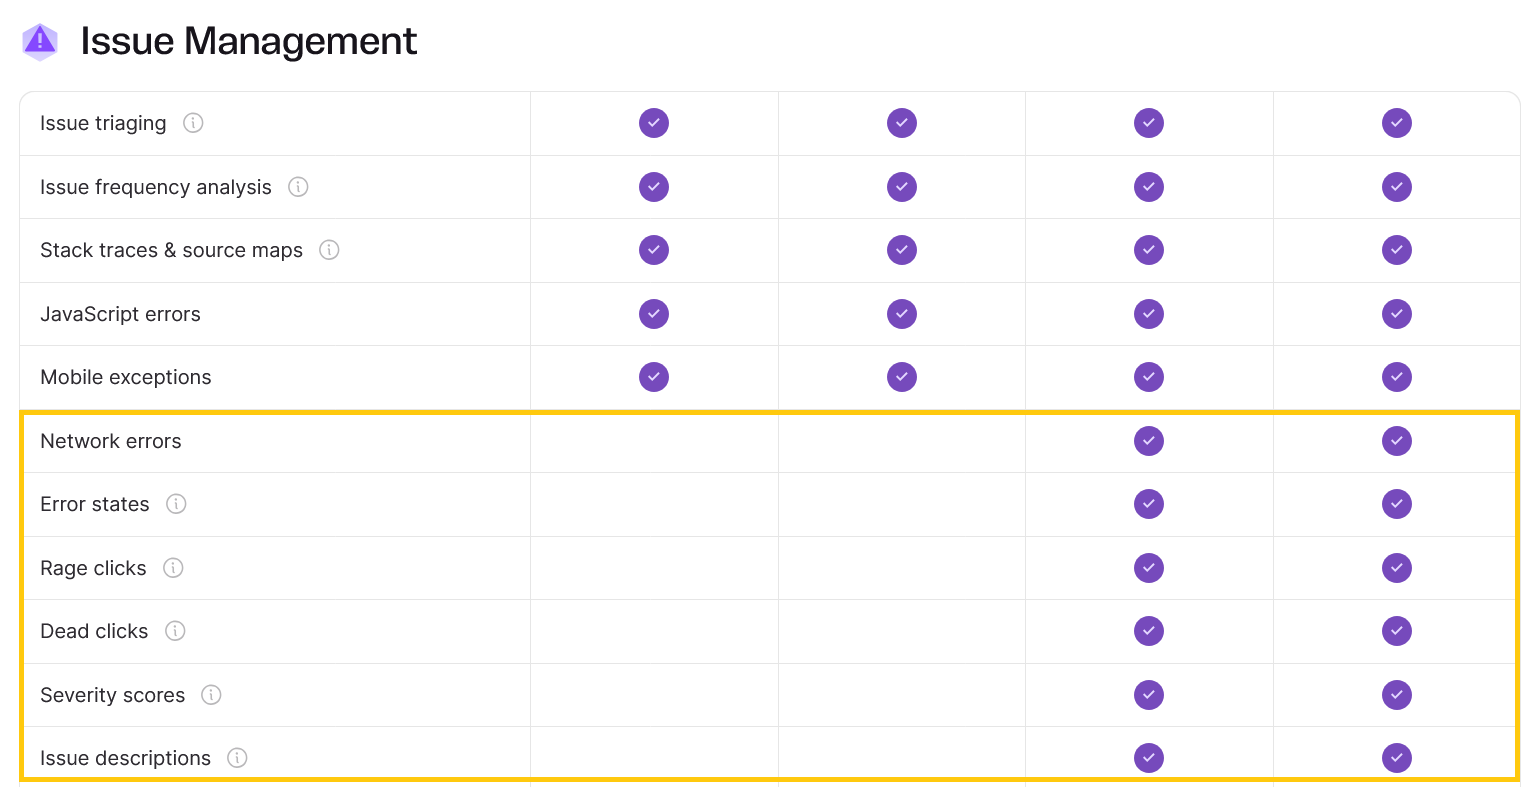
Paid plans start at $69/month (Team tier), but key features like rage click tracking, network error logging, and dead click detection are only available in the Professional and Enterprise plans.
Overall, LogRocket is powerful, especially for debugging and performance monitoring.
But to get the most out of it, teams need to fine-tune the setup and be prepared to actively manage session volume.
PostHog is an open-source analytics platform that includes session replay as part of a broader suite of product tools.
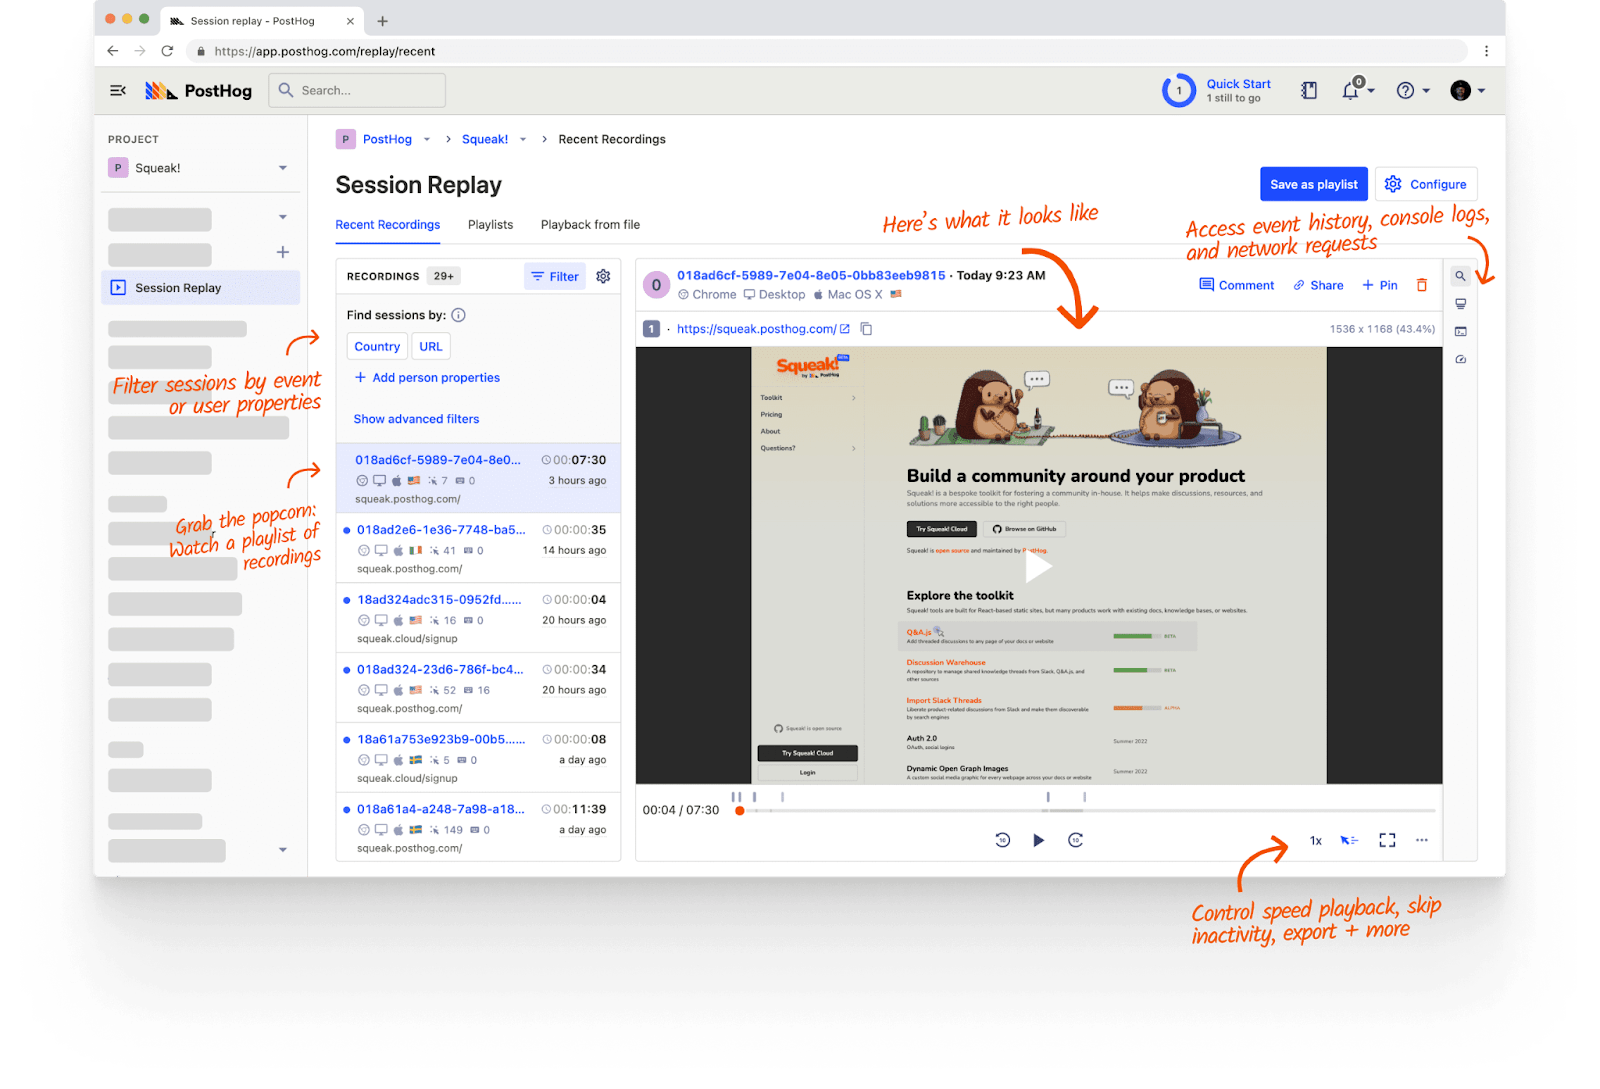
Its replay feature gives teams the ability to filter recordings by events (like “Clicked Save” or “Opened Settings”), URL paths, session duration, and even user properties—if that data is being tracked.
A linked event timeline shows everything that happened during the session, and you can optionally include console logs, network monitoring, and error data to speed up debugging.
Session replays stream smoothly with a history of UI events, performance data, and diagnostics.
You can see everything from user clicks to custom breadcrumbs, network calls, and console warnings.
Sensitive inputs are blocked or masked by default.
PostHog supports web and mobile SDKs, and you can download recordings or retain them beyond retention limits.
It also offers automatic playlists—filtered session sets—so teams can batch review similar user behaviors quickly.
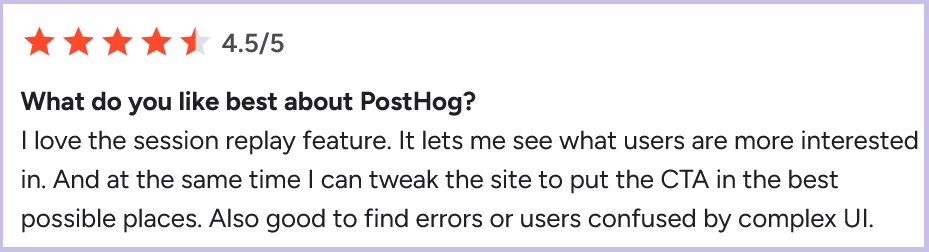
Users generally appreciate PostHog’s session replay:
However, PostHog doesn’t support heatmaps, rage or dead click detection, or crash reporting, so it’s not as feature-rich as other session replay tools on this list.
Still, its value is clear for product teams who want lightweight, targeted visibility into user behavior.
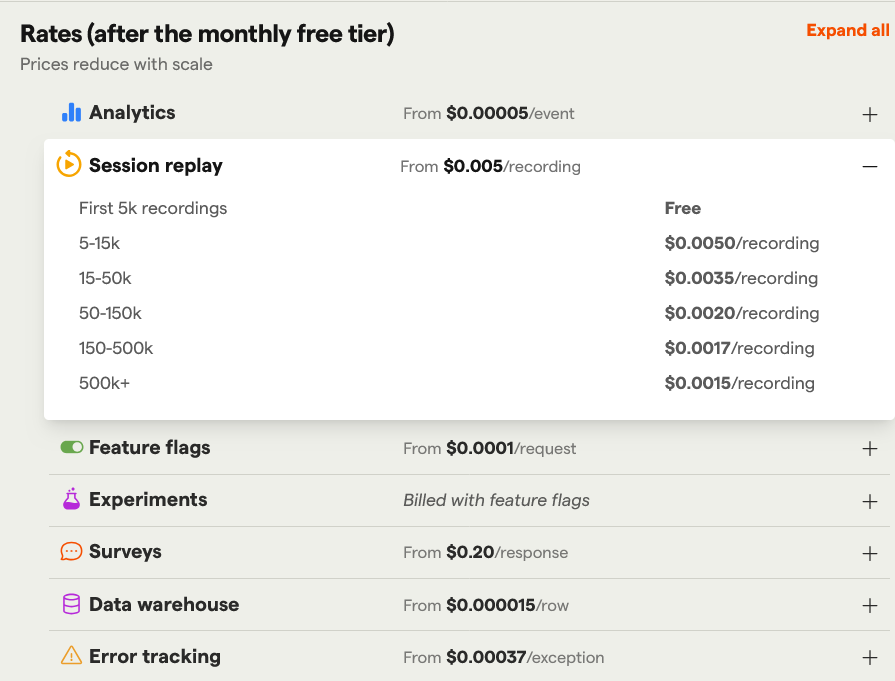
The free plan includes up to 5,000 session recordings per month, and pricing beyond that is usage-based at $0.005 per additional recording.
Being open-source, PostHog is also highly customizable if you have the technical resources.
Overall, it’s a good fit for data-driven teams who want flexible replays without getting locked into rigid pricing or workflows.
Each session replay tool we reviewed brings something different to the table.
Shake and Sentry integrate deeply with developer workflows to speed up debugging, while UXCam, Microsoft Clarity, and Fullstory focus on product analytics and user experience insights.
LogRocket combines both high-fidelity replays and advanced debugging features, though it requires careful setup to avoid clutter.
Meanwhile, PostHog offers a flexible, open-source solution for teams who want to self-host and integrate session replays with their event analytics.
Each tool has its limitations, whether in session quota, missing features like crash reports, or learning curve, so it’s worth testing a few before committing.
But skipping session replay tools entirely?
That’s like trying to understand why a user’s frustrated from a voicemail transcript.
You’ll get part of the story, but miss what really happened.
From internal bug reporting to production and customer support, our all-in-one SDK gets you all the right clues to fix issues in your mobile app and website.
We love to think it makes CTOs life easier, QA tester’s reports better and dev’s coding faster. If you agree that user feedback is key – Shake is your door lock.
Read more about us here.

Add to app in minutes

Doesn’t affect app speed

GDPR & CCPA compliant

Unexpected things pop up
Just like bugs in your app or web 🐛 Fix them now with just one reporting tool.