Recommended
An introduction to app debugging

They say that only Cher and cockroaches will survive the end of the world, and in the domain of software development, we can adjust the phrase by listing Cher and bugs as the only survivors.
Seeing as bugs will always be there, it’s best to consider them a necessary part of the software development process and build a strategy for resolving them.
In other words, you need a debugging strategy, and to squash bugs efficiently, you need proper tools.
So, if you believe in life after bugs, keep reading, and you’ll find the best tools for eradicating errors and providing your users with the best experience possible.
Table of Contents
We know, we know—you’re eager to start debugging your app.
However, before you get to that stage, you have to know what bugs you’re fixing, and Shake can help you streamline the bug-reporting process.
Shake is a bug and crash reporting tool that reduces the workload that your QA testers have to put in when manually reporting bugs.
The tool automatically notes software and hardware specifics for each bug that a tester reports, saving time and reducing context-switching.
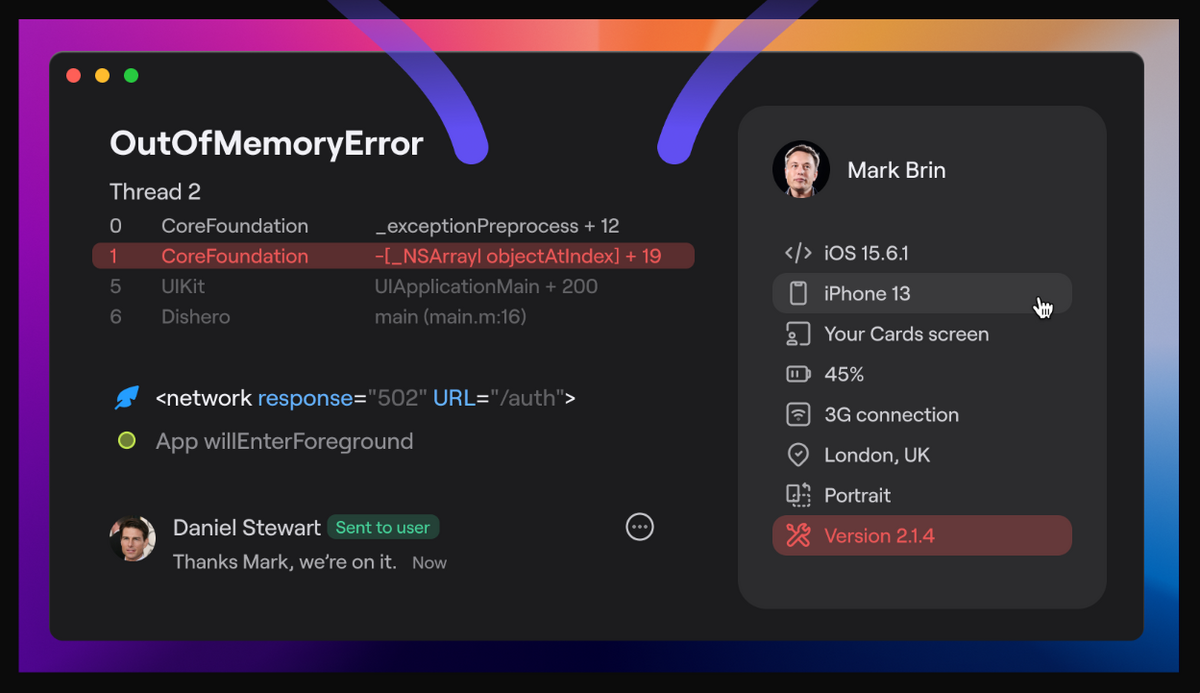
Moreover, such detailed reports help you understand the circumstances of a bug better, and judging by the reviews from satisfied customers, that knowledge is highly valuable during debugging.
Here’s how one Capterra reviewer puts it succinctly:
Tons of metrics associated with each bug gives more insight into the bug cause.
Another excellent feature of the tool is that you can use it directly from the app you’re testing, which makes the reporting even smoother.

Get unreal data to fix real issues in your app & web.
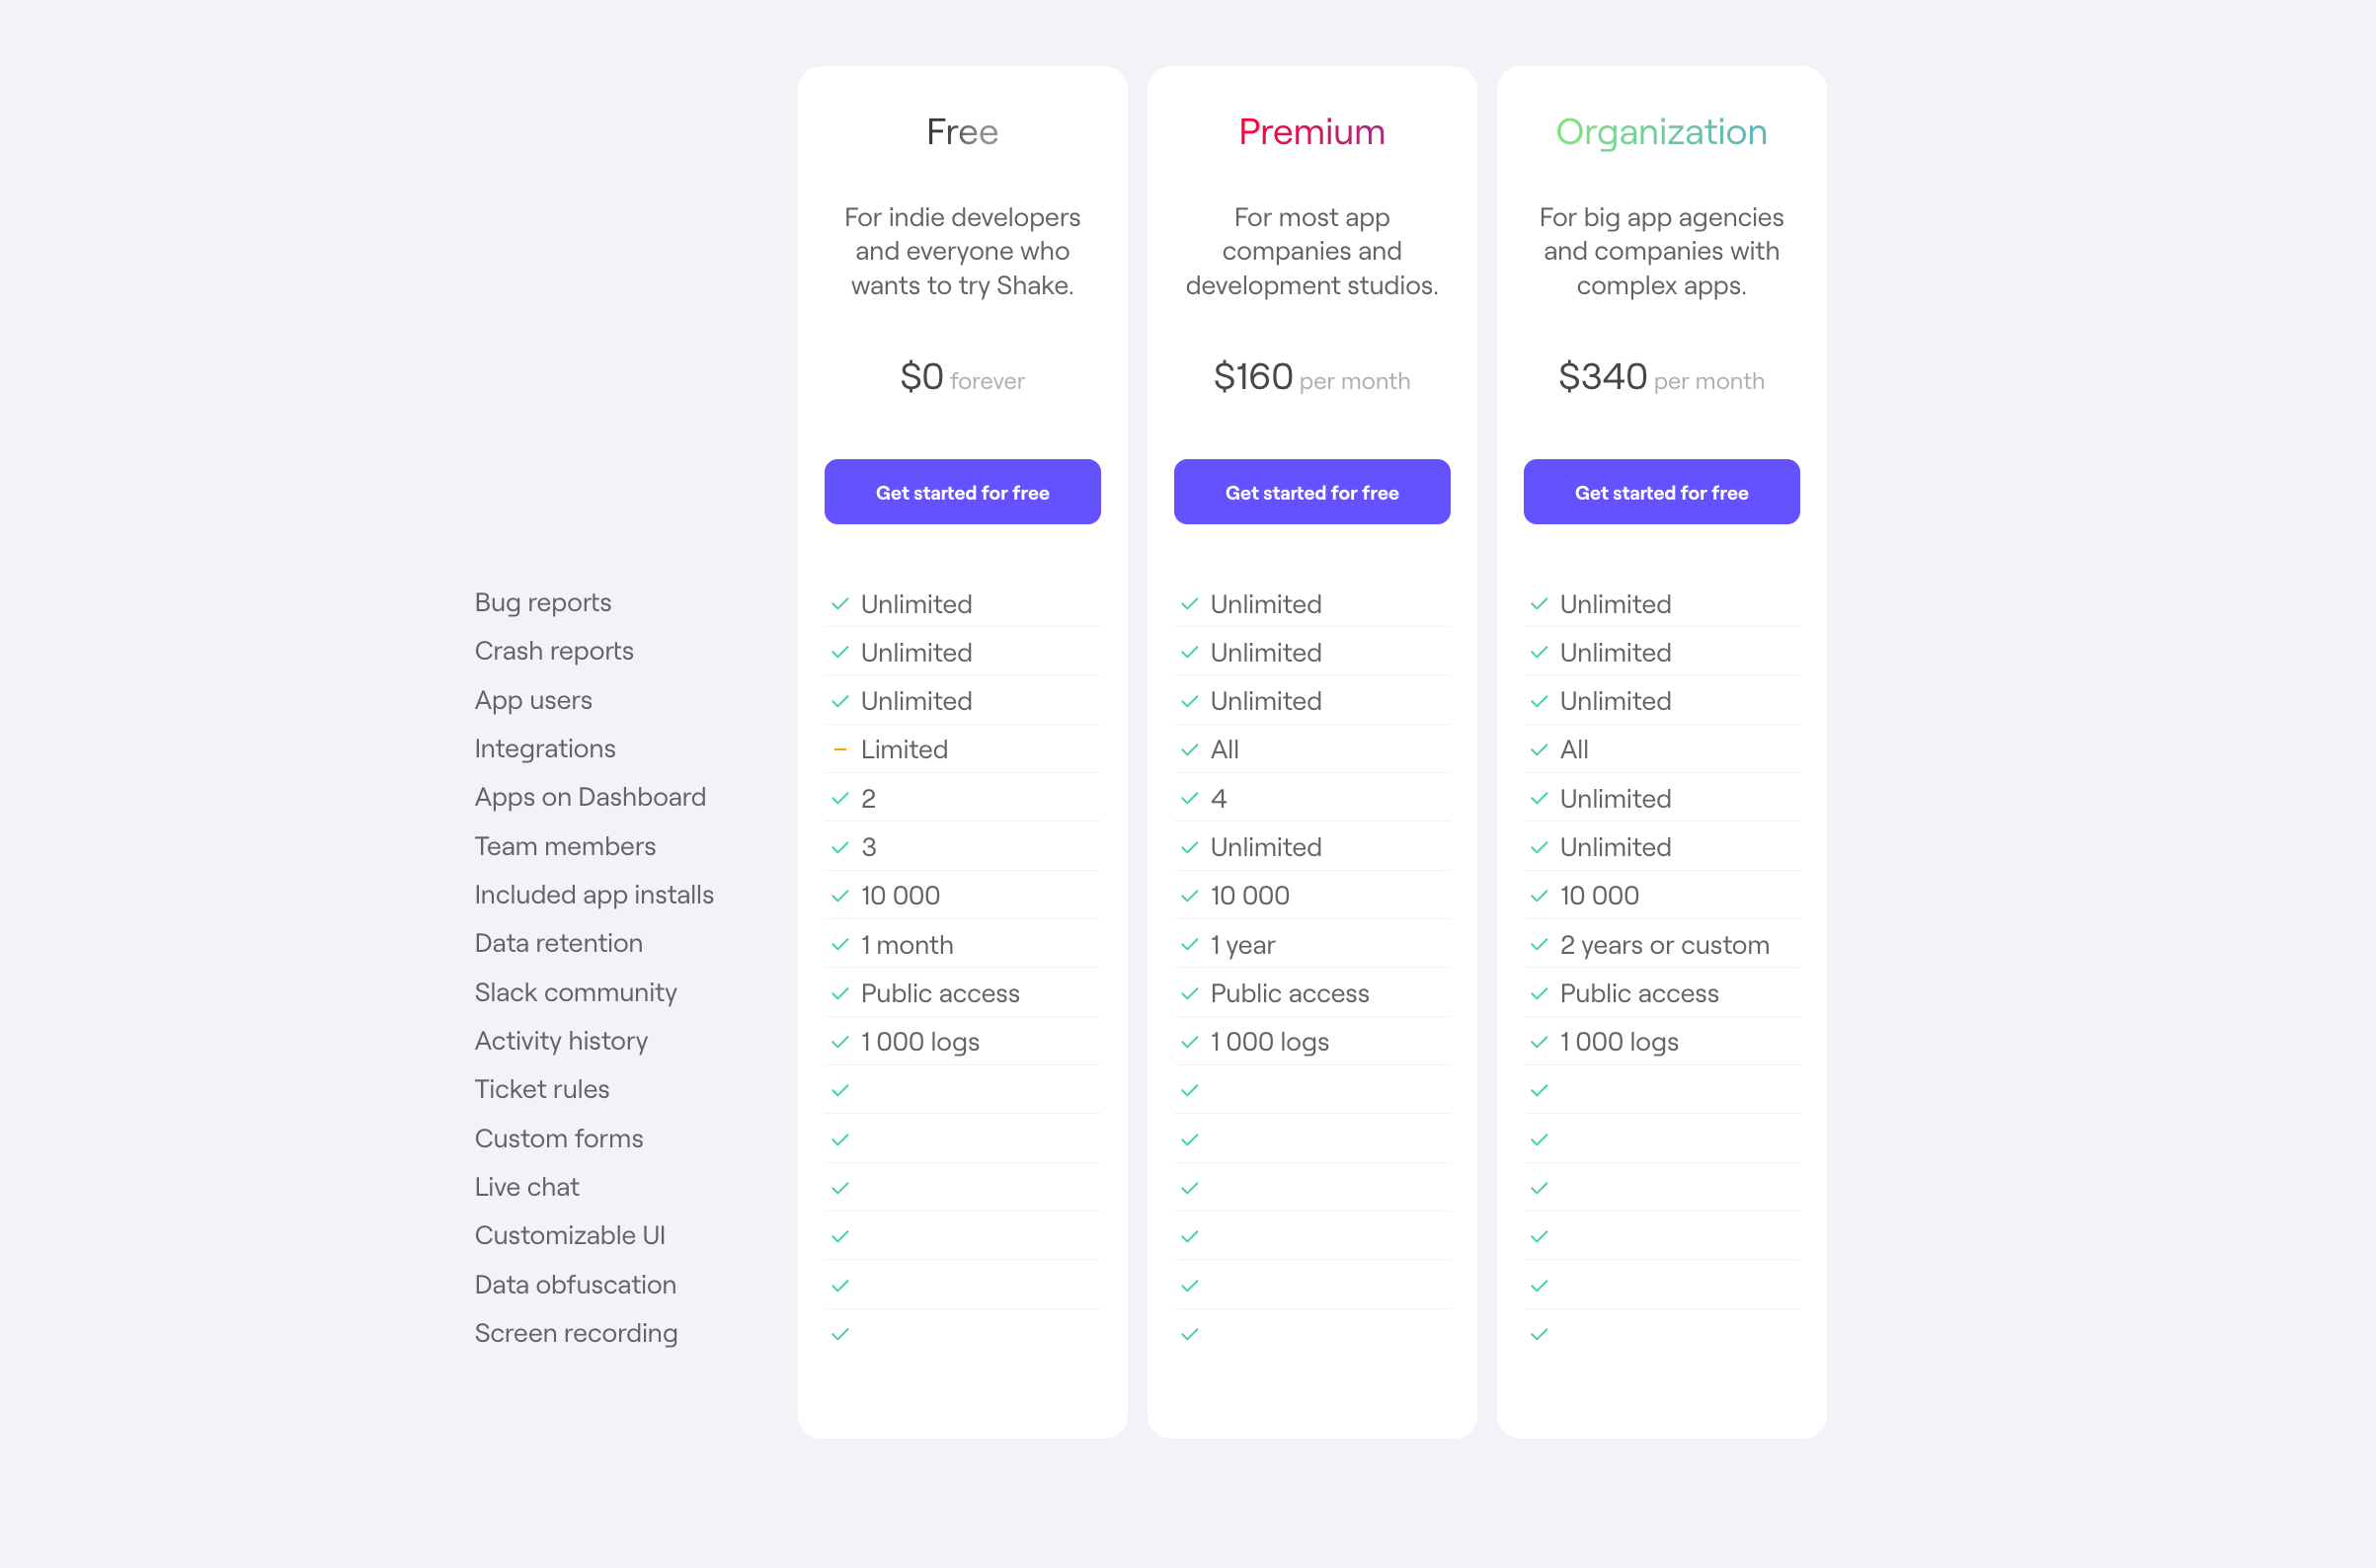
When it comes to pricing, you’ll find that Shake is more affordable than its competitors.
The plans begin at $160 per month when billed annually, and you can choose between three plans depending on your needs.
Bear in mind that Shake is intended for mobile testing only, so if you’re working with websites or desktop apps, this tool is not a good fit.
But if you’re debugging a mobile app, you should take advantage of the free tier and see how Shake can assist your team in bug reporting.
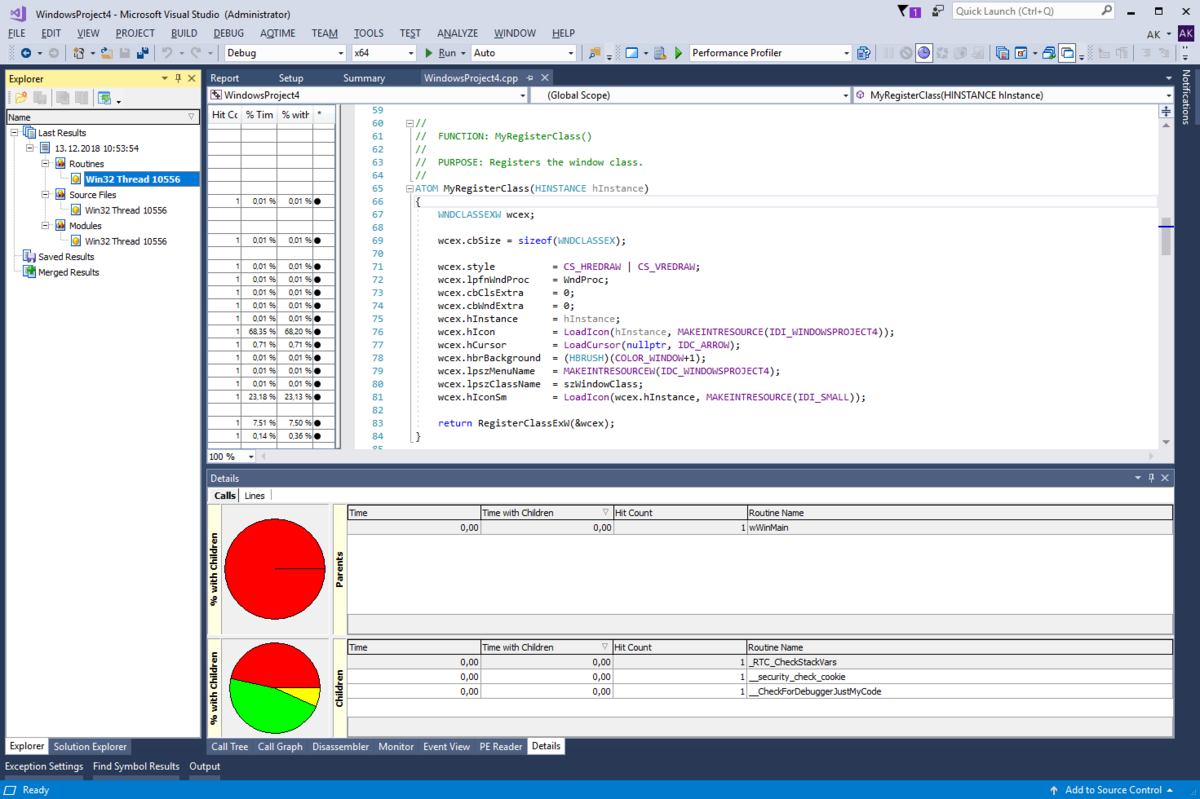
AQTime Pro is one of the 27 tools from SmartBear’s software product arsenal.
This tool can aid your debugging efforts by detecting memory leaks, code coverage gaps, and performance bottlenecks.
Bugs in such vital areas can compromise the safety of your software, so it’s important to avoid that by using AQTime Pro and its insights to ensure the high quality of the code.
If you’re coding across multiple codebases and frameworks in a project, AQTime Pro has you covered because it has broad language support.
Additionally, you can use the tool on its own or integrate it with Visual Studio or RAD Studio.
A disadvantage of using AQTime worth mentioning is that it uses a lot of computer memory.
Even the product specifications page has a note that advises users to allocate as much physical RAM as possible to the tool.
In terms of pricing, AQTime is a bit different from the other tools in the industry. Instead of monthly payments, you can make a one-time purchase of a license.
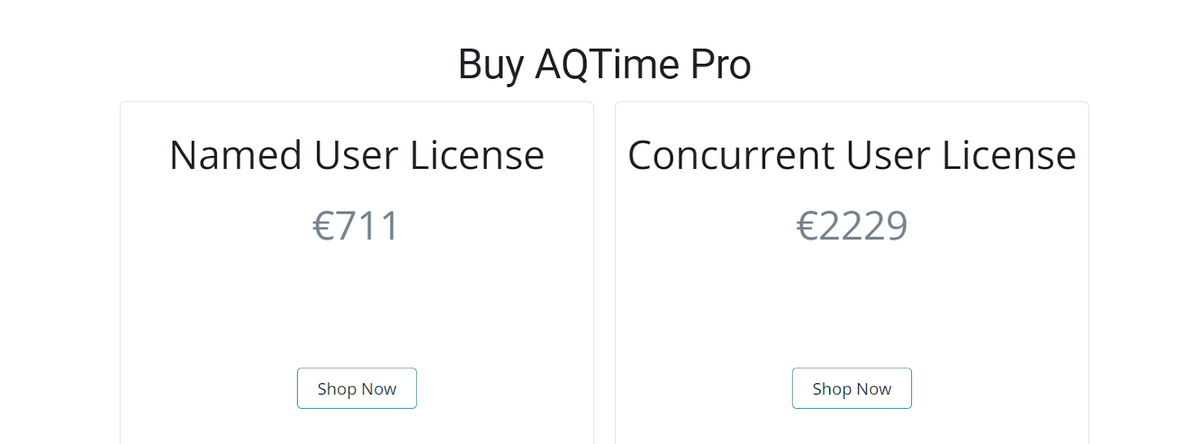
If you only need one account, you can get the named user license for €711, whereas the price of a license for multiple users is €2229.
This may seem expensive, but keep in mind that both license types are perpetual, i.e., they don’t have an expiration date.
As we’ve seen with Shake, a well-structured debugging process starts with bug reporting.
If your projects require you to go beyond mobile and also work with websites, then Bugfender might be a good bug-reporting option.
Bugfender is a log storage service that lets you collect information about events that surround a bug and provides you with an overview of incidents.
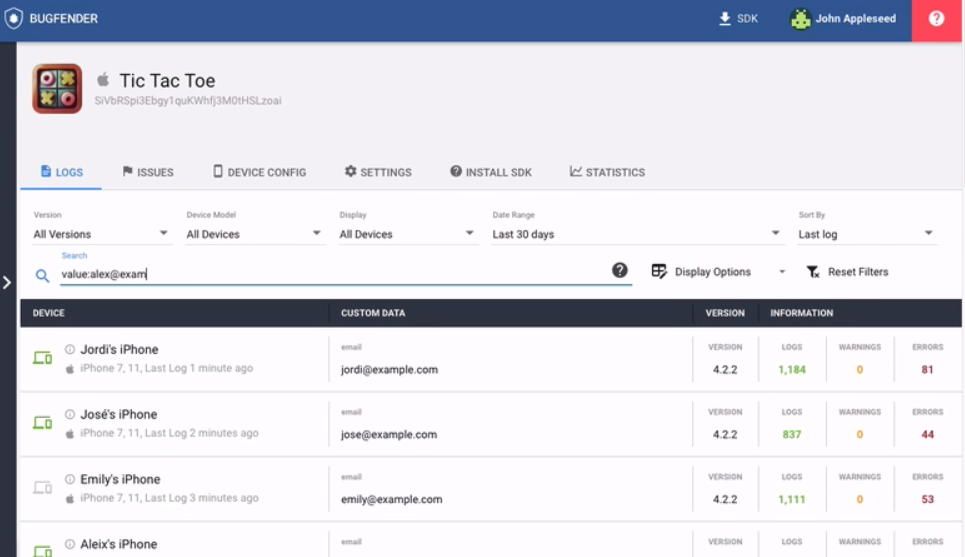
In addition to supporting mobile and web development tools, Bugfender lets you design your own in-app feedback screen, which is a nice feature if you’re looking for customizable tools.
However, if in-depth analysis of the bugs is a priority for you, you might want to keep looking for another tool because multiple reviewers on Capterra have complained about the lack of the capabilities for filtering bugs and crashes.
If you’re experimenting with debugging or want to check out what Bugfender looks like from the inside, you can sign up for the free version of the tool.
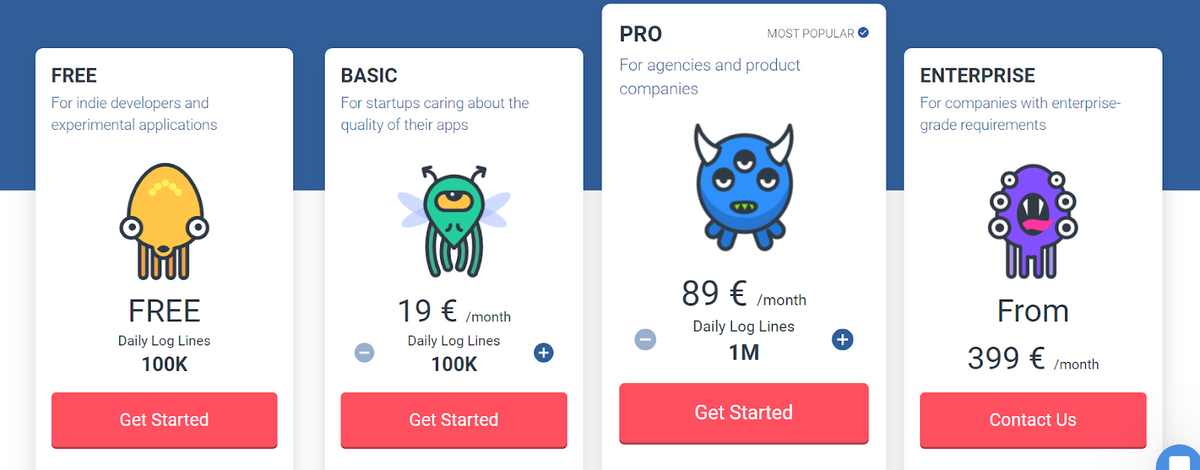
Paid plans start at €19 per month when billed annually, but such a low price means that you only get a seven-day log retention.
If you want to keep your records longer, you’ll have to upgrade to either the €89 or the €399 plan.
And in case your company has special requirements (and a bigger budget), Bugfender can create a custom plan for you.
Mobile apps may be all the rage, but desktop and website solutions aren’t going anywhere. To debug these successfully, you can consider using Fiddler, a tool developed by Progress Telerik.
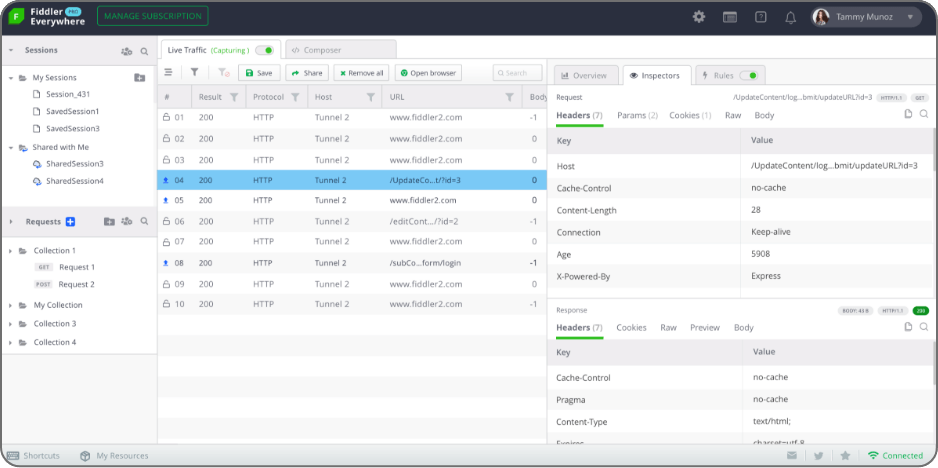
Fiddler is a web debugging proxy tool that lets you monitor web traffic, capture errors, and share them with your teammates.
G2 reviewers are fond of Fiddler’s design because it’s intuitive and easy to set up and use.
It’s worth noting that there are five products in the Fiddler family, and these are: Fiddler Core, Cap, Jam, Classic, and Fiddler Everywhere.
An overview on the main product website can help you determine which one you need according to your requirements.
For instance, Fiddler Classic only supports Windows, while Fiddler Everywhere supports Linux, MacOS, and Windows, so the operating systems you use might be one of your selection criteria.
The pricing also depends on the specific Fiddler product you set your sights on.
The screenshot below shows the two Fiddler Everywhere plans, at $10 and $25 per user, monthly, when billed annually.
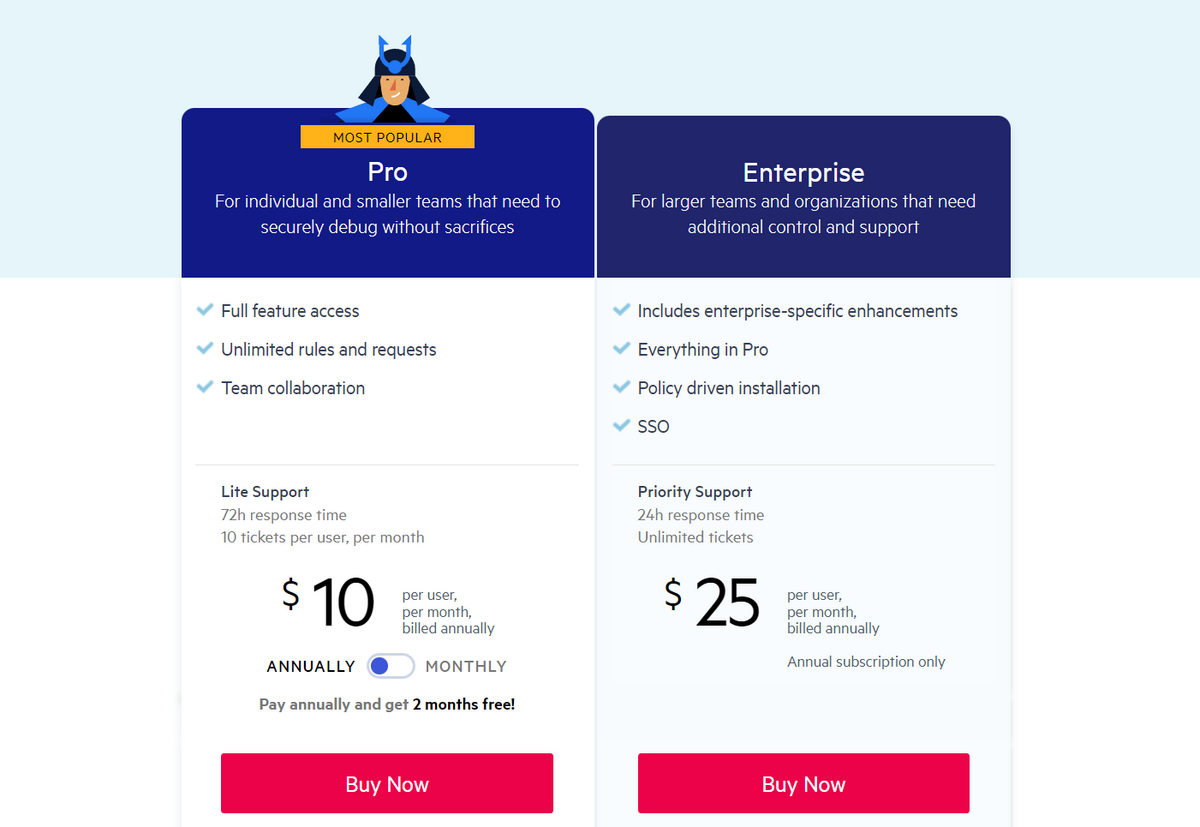
You can find the prices of other Fiddler products on their respective pricing pages.
And if you’re unsure about committing to a tool, you’ll be glad to know that each Fiddler version offers a free trial.
An interactive disassembler (IDA) is a tool you use to generate source code, or something close to it, from compiled programs.
But why would you need a disassembler for the software you’re building?
Well, hackers sometimes try to construct a target’s code and find vulnerabilities in it, and that’s where IDA Pro comes in handy.
IDA Pro is the industry standard when it comes to reverse engineering. It lets you research the vulnerabilities of your software so that you can ensure the safety of your product and users.
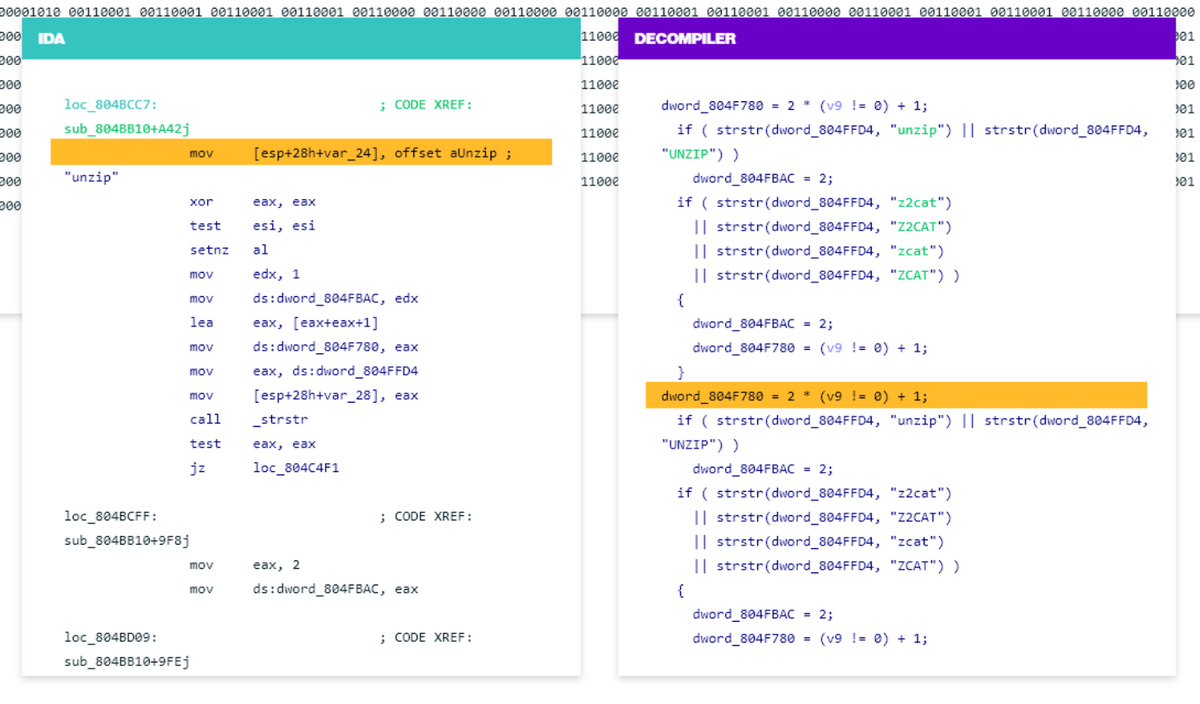
Although the tool relies on code to help you analyze malware, IDA Pro is also interactive and programmable because its creators are well aware of the fact that “no computer can currently beat the human brain when it comes to exploring the unknown”.
So, if you want to enhance your security and safety measures, IDA Pro is a reliable tool for that.
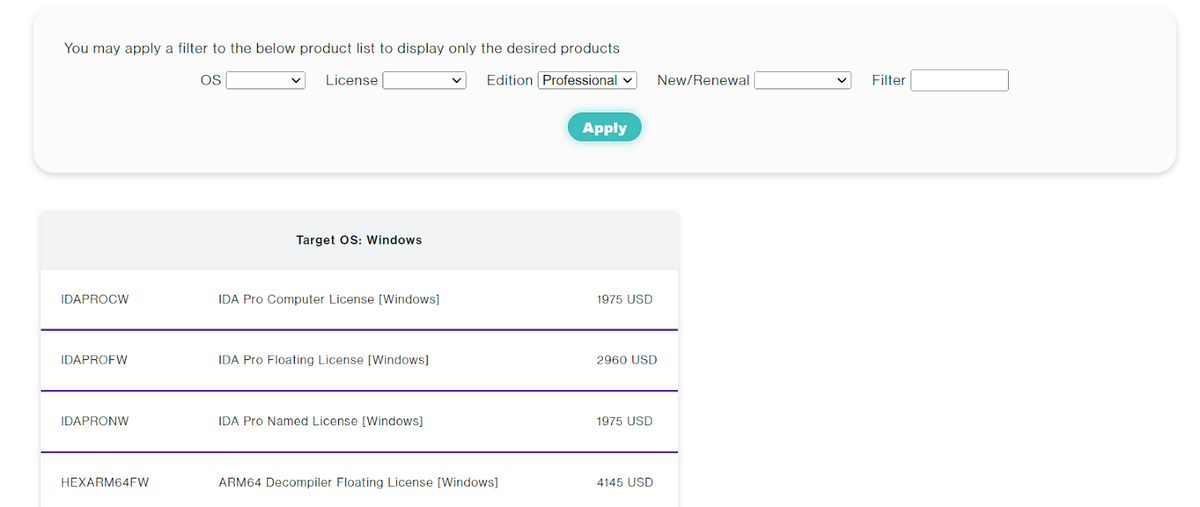
To use IDA Pro, you’ll have to purchase a license, the price of which depends on your needs.
The prices for professional use range from $1975 to $4145. You can calculate the exact price via the price list calculator.
If the price of the licenses seems a bit steep, don’t forget that there’s a free version of the tool called IDA Free that can let you see IDA in action.
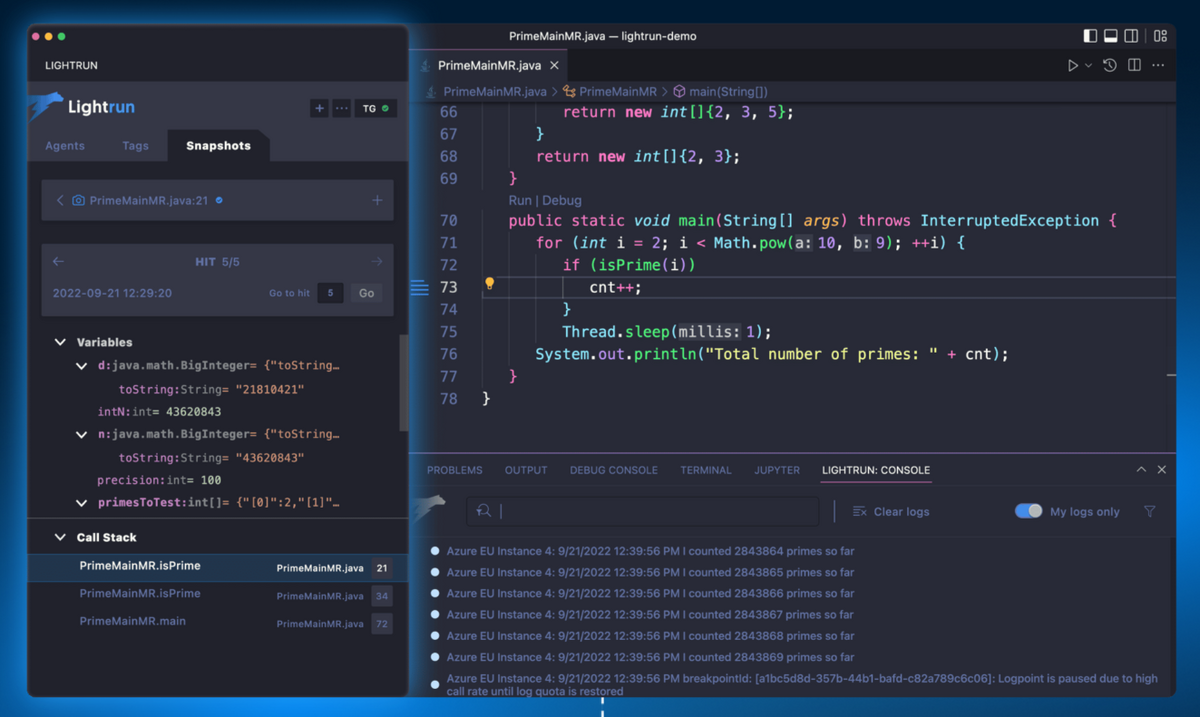
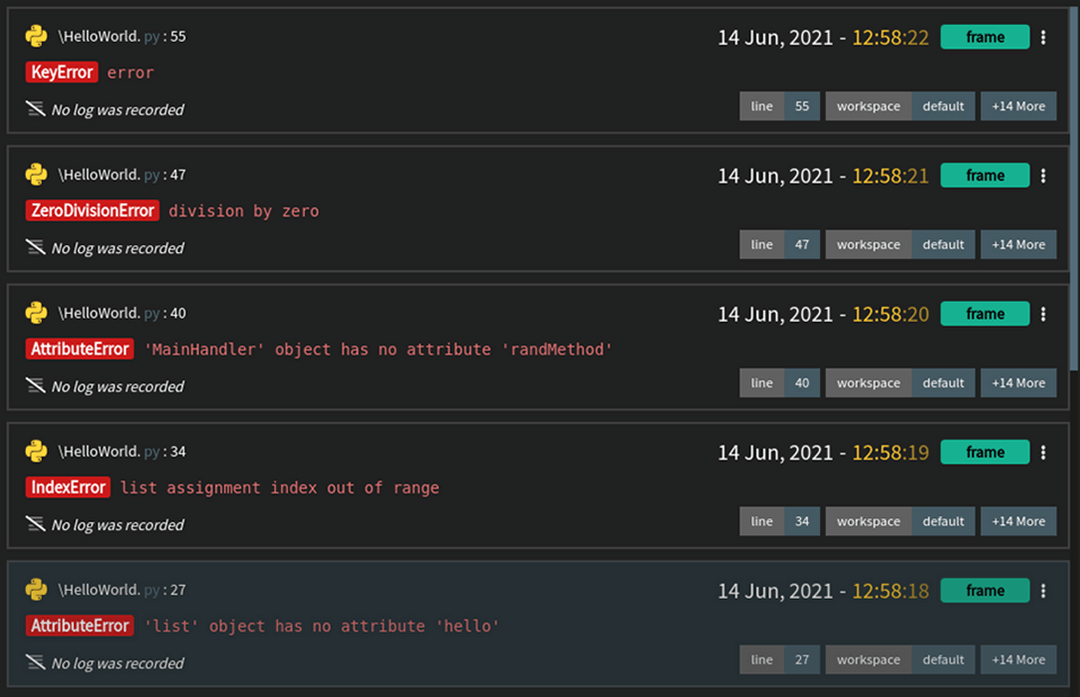
Lightrun is a continuous debugging and observability platform.
You can use it to debug a live application by securely adding logs and performance metrics to production and staging environments.
One of the benefits of using Lightrun for debugging is that you can troubleshoot your software directly from the IDE, without ever leaving it or needing to open an external interface.
You also don’t have to stop the running application—you can work your way through bugs in real time.
Although Lightrun boasts support for all major IDEs, there’s a specific area where the tool is currently lacking, and that’s collaboration.
According to a g2 review, sharing between teams is currently difficult, so that’s something to keep in mind if you have several teams working on your app.
The pricing of the tool is not that flexible, as there are only two plans you can choose between.
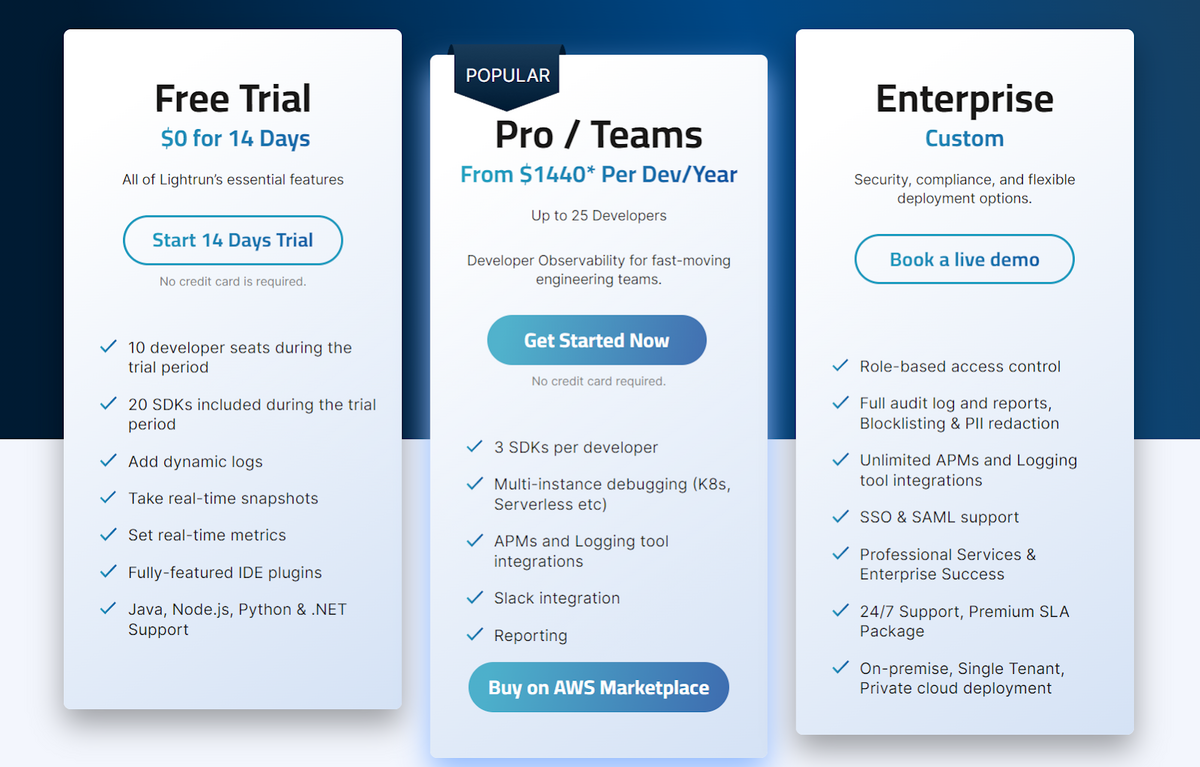
The Pro/Teams plan starts at $1440 per account per year, and you can include up to 25 developers in it.
If you’re running a bigger project that requires more seats, you’ll have to request a custom quote.
Either way, a two-week free trial can help you determine if Lightrun is a good fit for you.
NerdVision is another debugger on our list that you can use to comb through your app and analyze errors.
It boasts speed and simplicity, helping developers reduce the time spent on debugging.
Unlike Lightrun, NerdVision is advertised as a collaborative debugger.
Furthermore, NerdVision integrates with other tools widely used in software development, such as Splunk, Slack, Datadog, and more.
The integration with Slack and other communication tools means that NerdVision can notify you when an issue occurs, and you’ll immediately see what happened, when, and why.
Still, there’s a roadblock to getting on board with NerdVision, and it lies in the way the pricing is presented.
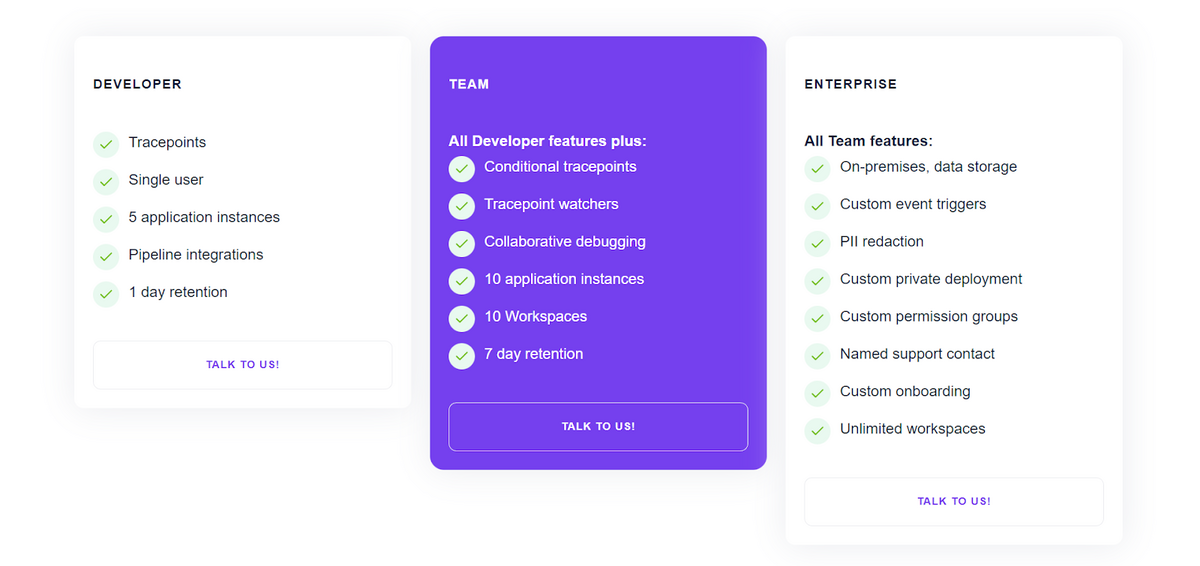
While the tool comes in three plans with different capabilities, the exact price isn’t specified anywhere on the NerdVision website.
Instead, you have to contact their team to get the offer and find the price.
If you want a tool for monitoring your app’s web performance, then New Relic might be worth considering.
New Relic is a real-time monitoring tool that lets you analyze errors, find the root cause of the problem, and debug errors decisively based on the insights you get.
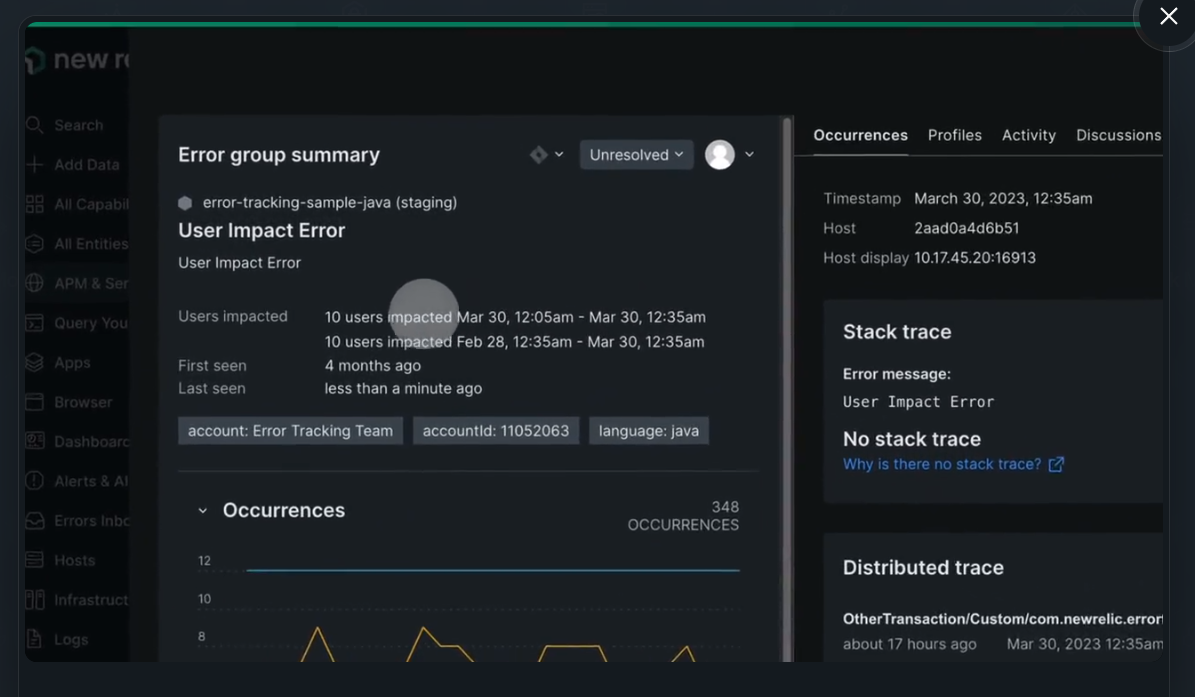
The tool has over 30 capabilities that help you catch and fix performance issues quickly.
There’s even an AI assistant capable of providing details about errors and the course of their development.
New Relic users are overall satisfied with the tool, the ease of the setup, and the results it provides.
However, a common complaint among the reviewers concerns the complexity of the interface.
Since there are so many features, new users can get overwhelmed when first using the tool, so keep the steep learning curve in mind if you decide to include New Relic in your debugging stack.
The tool pricing is calculated transparently, and it varies by the data and user requirements of a customer.
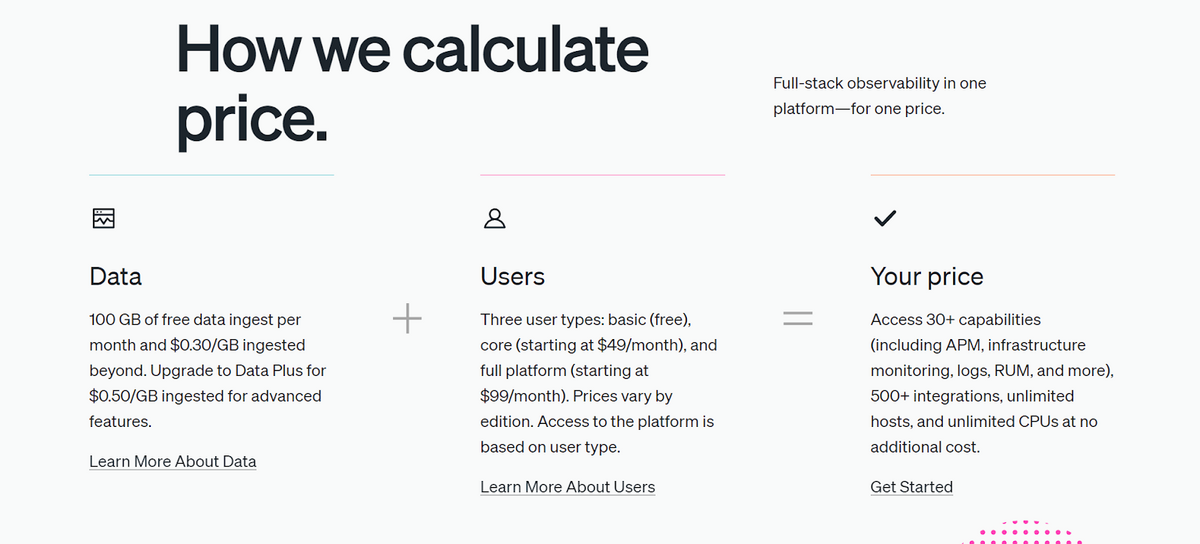
There are two plans (Pro and Enterprise) that you can pay for based on the figures from the screenshot above.
However, there’s also a free full-platform version limited to one user per company, so you can use this option to see how you like New Relic before purchasing.
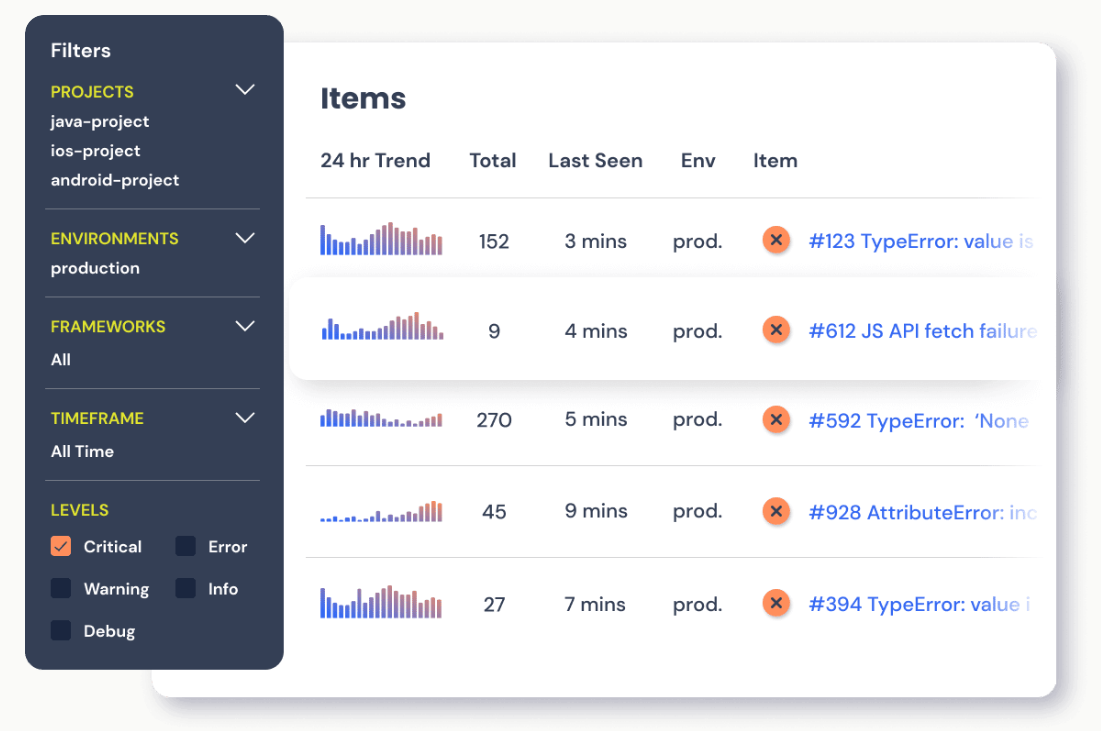
In case you prefer a proactive approach to debugging, Rollbar is a good bug-monitoring tool to consider.
It helps you see errors as they happen, in real time.
This is especially useful when it comes to critical errors that may happen infrequently, so you want to be aware of them as soon as they occur.
Unfortunately, Rollbar is only a good solution if you don’t mind working by the slow and steady wins the race motto.
Judging by the Software Advice reviews, some elements of the tool, such as the search feature, are so slow that they impact productivity.
So, Rollbar could be a good or a bad choice, based on your priorities.
The pricing of the tool is straightforward: there’s a free plan, and three paid plans that vary in capabilities.
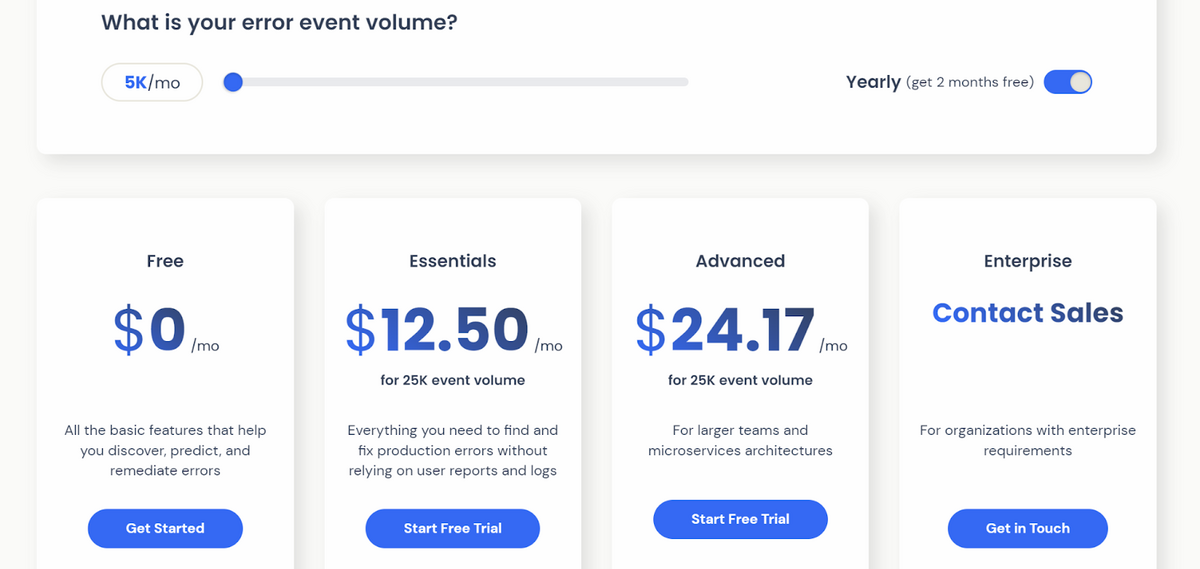
Bear in mind that the price rises with the increase in error events.
For instance, The Essentials plan can cost anywhere from $12.50 to $521 per month, billed annually, depending on the error volume.
In any case, you can sign up for a free trial and see how the tool fits your workflow before purchasing.
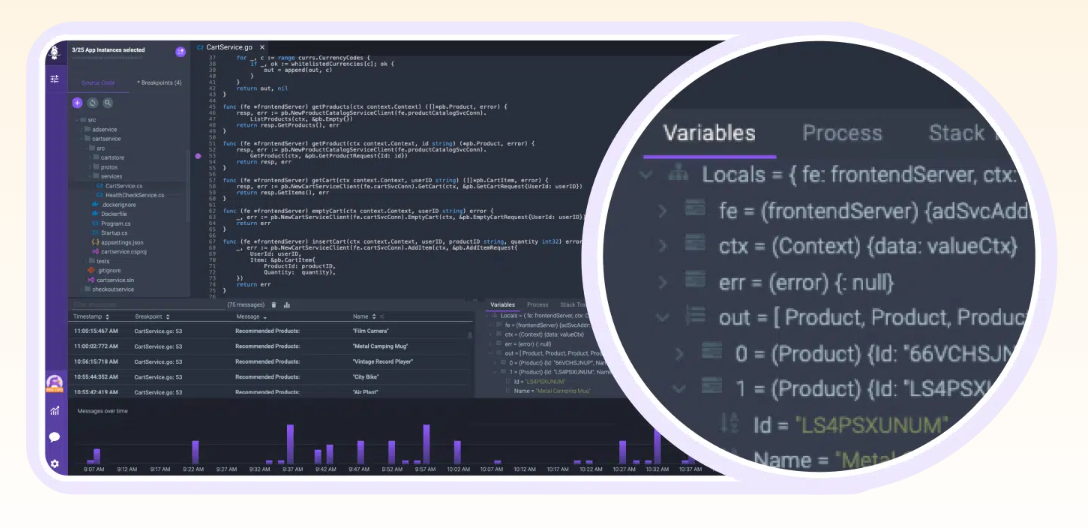
The last tool on our list is Rookout, a cloud-native debugging tool.
With Rookout, you can look deeper into issues that happen within the app.
The tool provides context for the problems you face, which can be a challenging thing to do manually or without additional coding.
It’s worth noting that Rookout has a somewhat confusing interface, according to g2 reviewers.
In other words, if you and your team are willing to invest time in learning the ropes of a new platform, only then will you be able to reap the benefits of Rookout.

Capture, Annotate & Share in Seconds with our Free Chrome Extension!
The tool offers a free version that has limited capabilities.
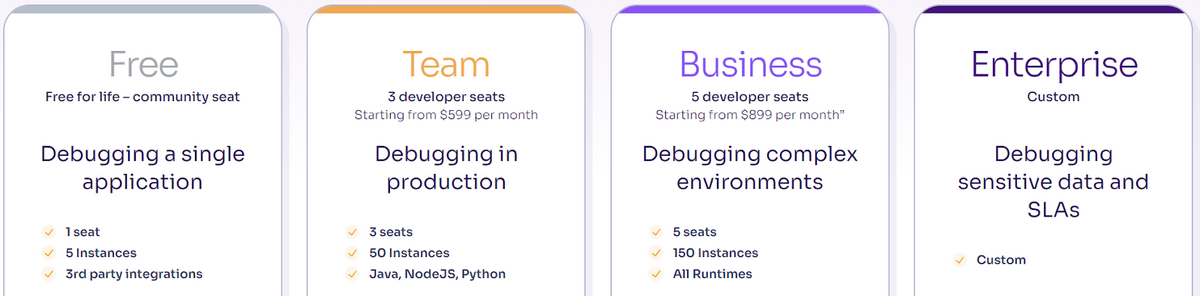
If you want to introduce Rookout company-wide, you’ll have to purchase one of the paid plans that start at $599 per month for three developer seats.
If you’re interested in trying out the tool but don’t want to bother with setting up a free version, you can play around in the Rookout Sandbox to see it in action.
The ten tools we’ve outlined have different purposes and capabilities.
While you probably don’t need all of them, it’s good to know what features there are so that you know what to look for in your debugging stack.
Still, all the tools from the list have a proven track record and satisfied customers, and we hope you’ll be able to find something for your team as well.
So, take advantage of free trials, and you’ll be one step closer to debugging your app version after version.
From internal bug reporting to production and customer support, our all-in-one SDK gets you all the right clues to fix issues in your mobile app and website.
We love to think it makes CTOs life easier, QA tester’s reports better and dev’s coding faster. If you agree that user feedback is key – Shake is your door lock.
Read more about us here.

Add to app in minutes

Doesn’t affect app speed

GDPR & CCPA compliant

Unexpected things pop up
Just like bugs in your app or web 🐛 Fix them now with just one reporting tool.