
Bug reporting takes time. Here’s how AI helps teams work more efficiently

Key Takeaways:
Do you ever feel like you’re just guessing why users aren’t engaging with your app?
This guide is for anyone who wants to stop making assumptions and start understanding what users actually need.
In the following sections, we will provide a clear, step-by-step process for analyzing app user behavior.
By the end, you’ll learn how to set goals, find problems, and use those insights to build a better product that keeps users coming back.
Table of Contents
Before you can begin analyzing user behavior, you need to step back and look at the bigger picture.
This means defining what you want users to do by setting clear behavioral goals.
Setting these up is a great initial framework for your analysis, ensuring you are not just passively observing behavior data.
This process can start with user goals like the ones shown below.
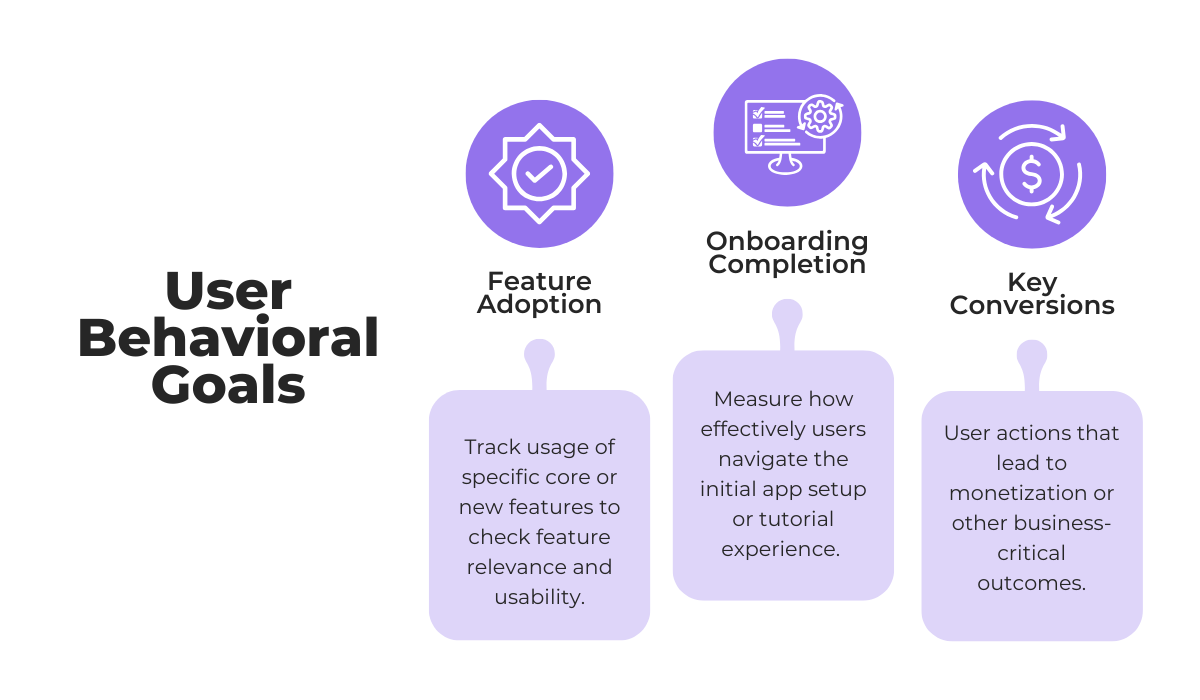
While conversions are an obvious and vital goal for many apps, it is also important to explore other key objectives, such as feature adoption and usage, and onboarding completion.
These metrics are often stronger indicators of the initial impression and actual value users get from your app and can act as leading indicators of long-term user satisfaction.

Get unreal data to fix real issues in your app & web.
The next step is to set measurable targets and implement a system to collect the data needed to track these behavioral goals.
According to Avi Siegel, co-founder of the product-led growth platform Momentum, teams often define how they will measure a feature’s success but then neglect to ever check the data.
This is a critical mistake because, as Siegel puts it, it leaves you guessing about the impact of your work.
To avoid this, you can’t be vague when checking in on your goals. So, you need to move from abstract ideas to concrete data.
This requires using software designed for this purpose.
Various platforms, like for example UXCam, specialize in app event tracking, which allows you to monitor specific actions users take within your app.
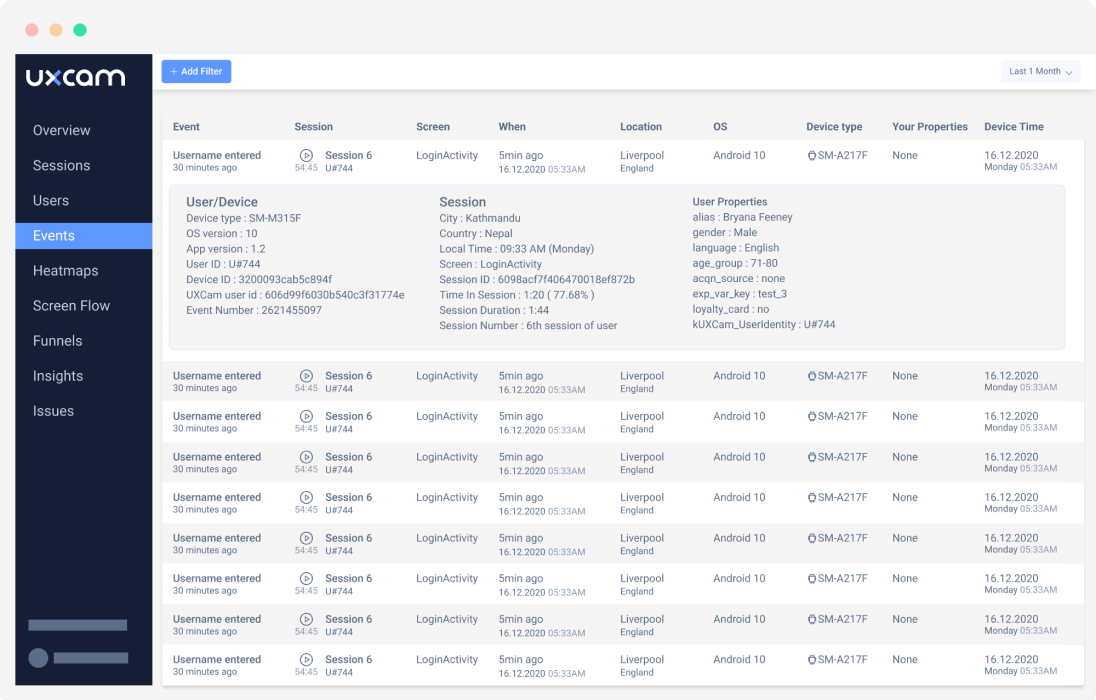
Each behavioral goal you set should be connected to one or more trackable app events like button clicks, form submissions, and so on.
You can then use these tools to measure precisely how users are performing against the targets you have set.
Do this initial step right, and you can give purpose and direction to your entire user analysis effort.
Tracking individual app events and key behaviors is a great start, but it’s only one piece of the puzzle.
To truly understand the user experience, you need to see how these individual actions connect to form a complete user flow, revealing the paths users take to get things done inside your app.
A classic example of such a journey is the app onboarding flow, like the simplified one illustrated below.
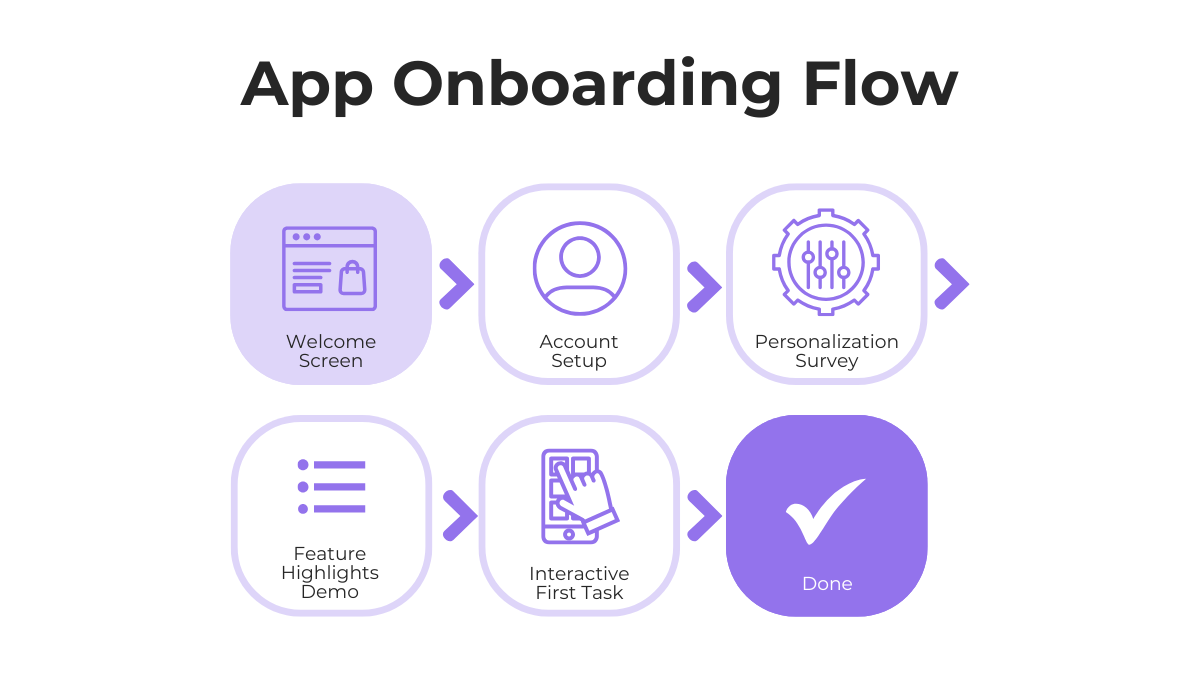
Even a basic flow like this can be a goldmine for insights.
Imagine you notice that a large number of new users have issues with the personalization survey.
This could be a signal that the survey is too long, the questions feel too invasive, or users simply don’t see the value in completing it.
When it comes to these user flows, you should also directly tie them to the specific user behavioral goals you have set.
For instance, a tool like Mixpanel offers a Flows Report, which visualizes the most common paths users take immediately before or after a critical event, like making a purchase.
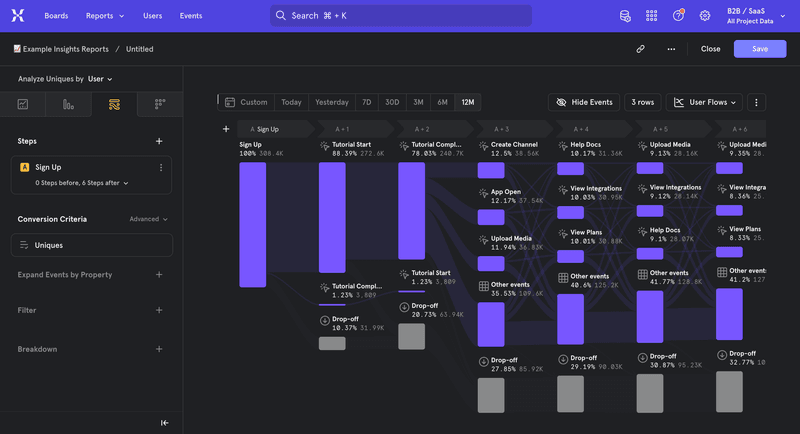
How this might look in a real-world scenario is that you might get insight that most users who complete a purchase first navigate to the customer reviews section.
That would instantly suggest that making this section more prominent could boost conversions.
Other than your key behavioral goals, former user experience (UX) designer Cynthia Vinney explains that every user flow should be designed with a specific user goal in mind.
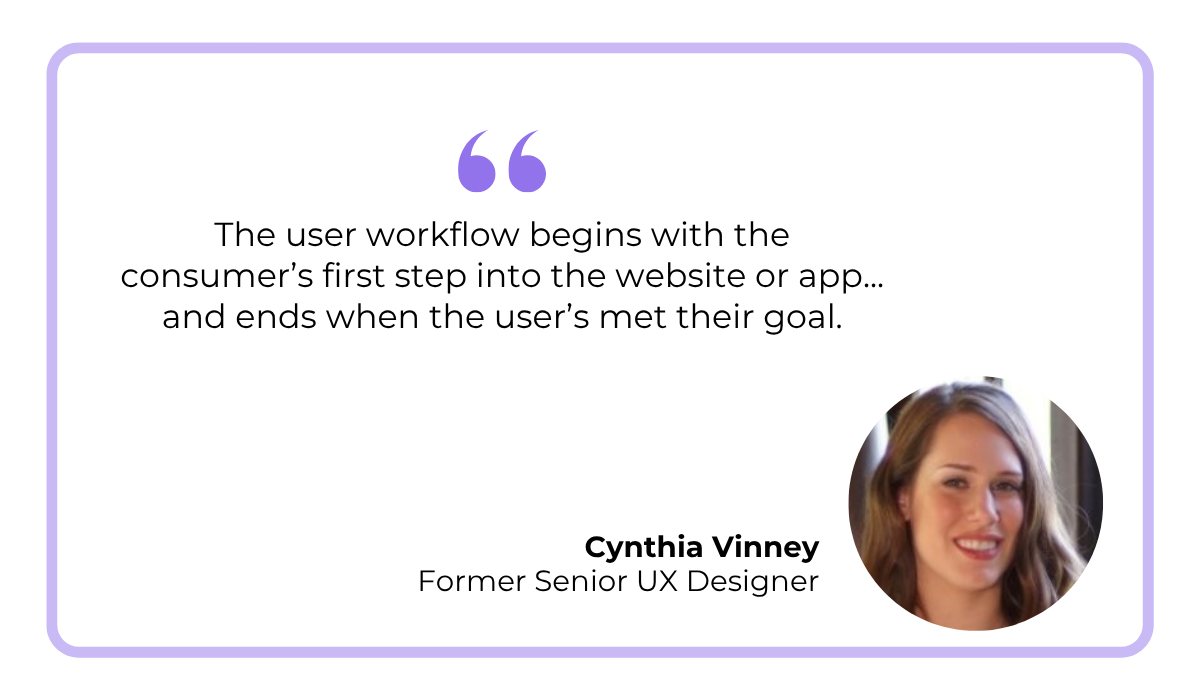
While a user’s immediate goal might not be one of your core business objectives, it is still essential to analyze and optimize that flow.
The end goal of user flow analysis is to remove friction and make it as easy as possible for your users to accomplish whatever they set out to do within your app.
That helps improve the user experience and ensures your app is more likely to succeed.
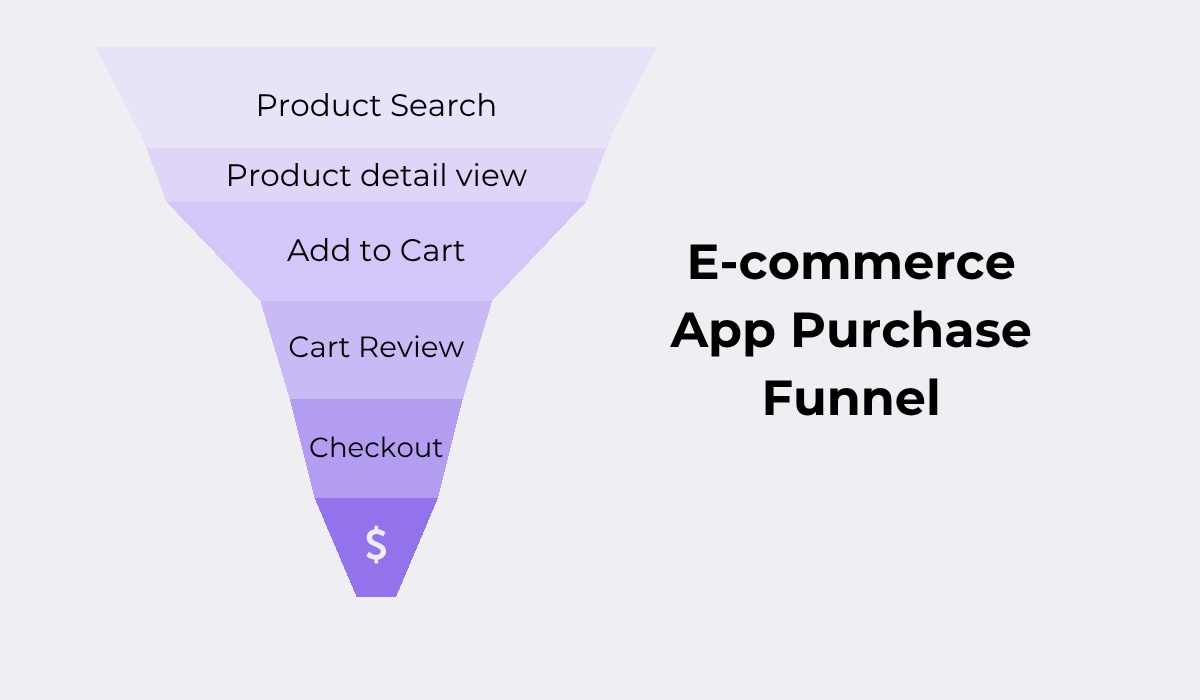
Once you begin to understand your key user flows, you can start to see them for what they really are: funnels.
For instance, you could imagine a simple funnel that starts the moment a user opens your app and ends when they successfully complete a desired action.
But this way of thinking is especially critical for funnels that are directly tied to a core behavioral goal, such as the purchase funnel for an e-commerce app.
At this stage of user behavior analysis, your goal is to pinpoint exactly where users are abandoning these funnels.
Identifying these drop-off points is crucial because it shows you the biggest areas of friction in the user journey, allowing you to optimize the experience and guide more users toward successful outcomes.
Of course, you don’t have to do this manually, as behavior tracking tools exist that can simplify this entire process.
For example, take a look at how this is visualized in VWO, a popular A/B testing and conversion optimization platform.
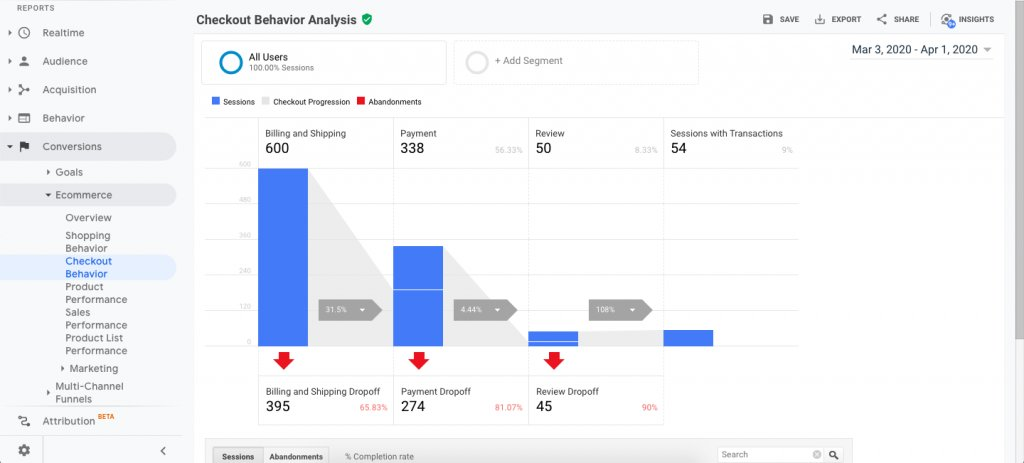
With tools like this, you get hard data and clear statistics showing where in the funnel users are dropping off most frequently.
This quantitative insight is invaluable because it helps you prioritize which problems to tackle first based on their impact.
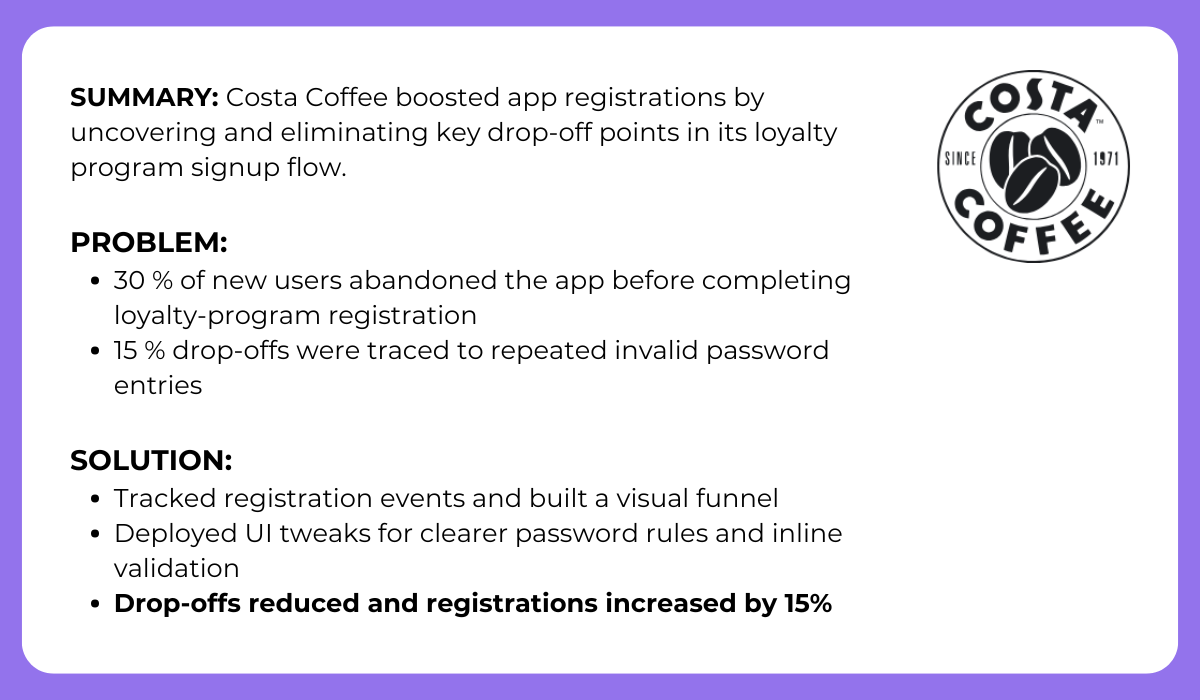
To see the powerful effect this process can have, look at the following case study.
As the analysis revealed, something as seemingly minor as a flawed password validation function was preventing many users from moving forward in their registration journey.
With a few quality tweaks to fix this bottleneck, Costa Coffee was able to clear the path for its users and improve new user registrations.
As you can see, by systematically analyzing your funnels, you can identify the most significant barriers your users face.
And fixing these drop-off points is one of the most direct ways to improve the user experience and drive conversions.
So far, we’ve viewed user behavior primarily through numbers and abstract flows.
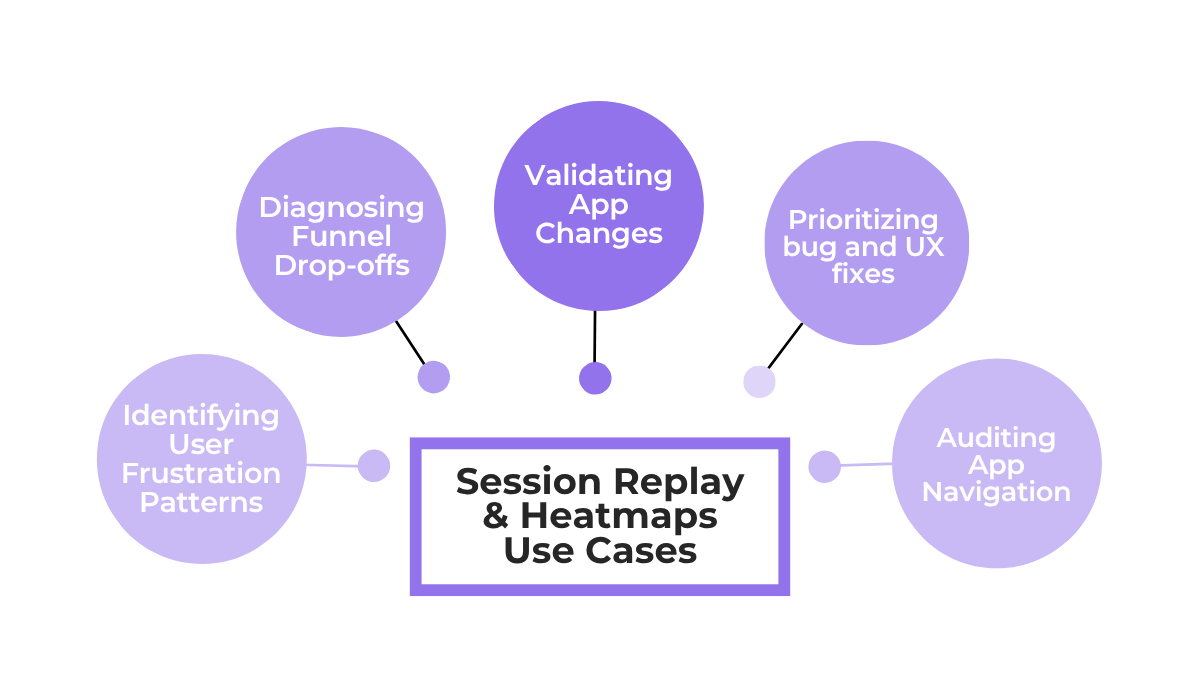
To get more granular data and truly understand the why behind the numbers, you can turn to tools like session replays and heatmaps, which show you exactly how users interact with your app’s interface.
There are many benefits to these two practices, some of which are shown below.
Let’s tackle heatmaps first.
With a heatmap, you can see aggregated data on where users tap, scroll, and interact.
But, more importantly, you can spot behaviors that traditional analytics would miss, such as repeated taps on non-interactive elements.
Seeing this data visually, as shown in the example below, helps you identify points of user confusion or frustration.
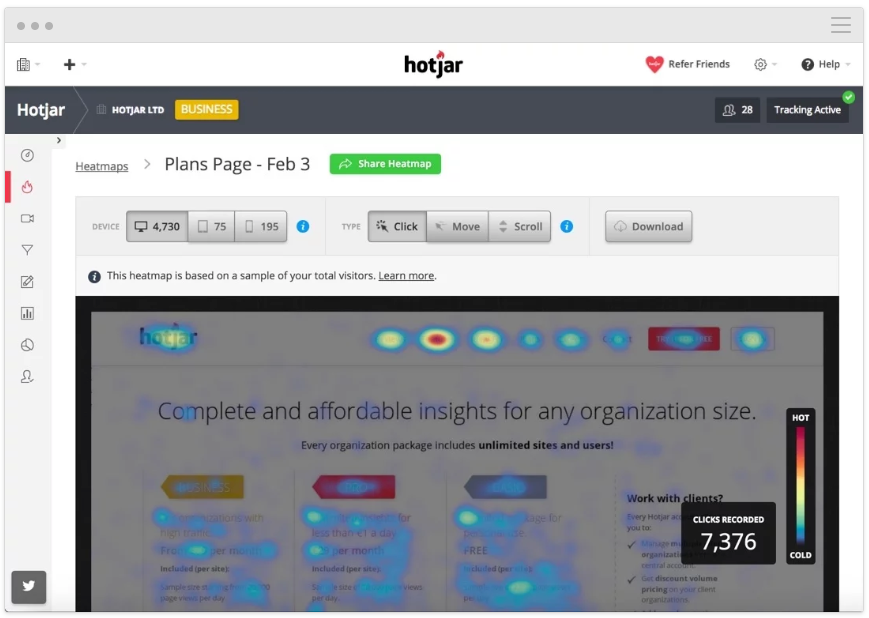
In the example heatmap, blue areas mean users engage less with that part of the app or page, while yellow and red areas see greater engagement.
So, a large red area on a non-interactive element would immediately be visible.
For an even more detailed perspective, you can explore individual user session replays.
An example is a tool like Shake that can automatically capture a session replay of a user’s interactions within your web app.
If that user decides to submit feedback or report a bug, these recordings can be automatically attached to their report, giving you instant context.
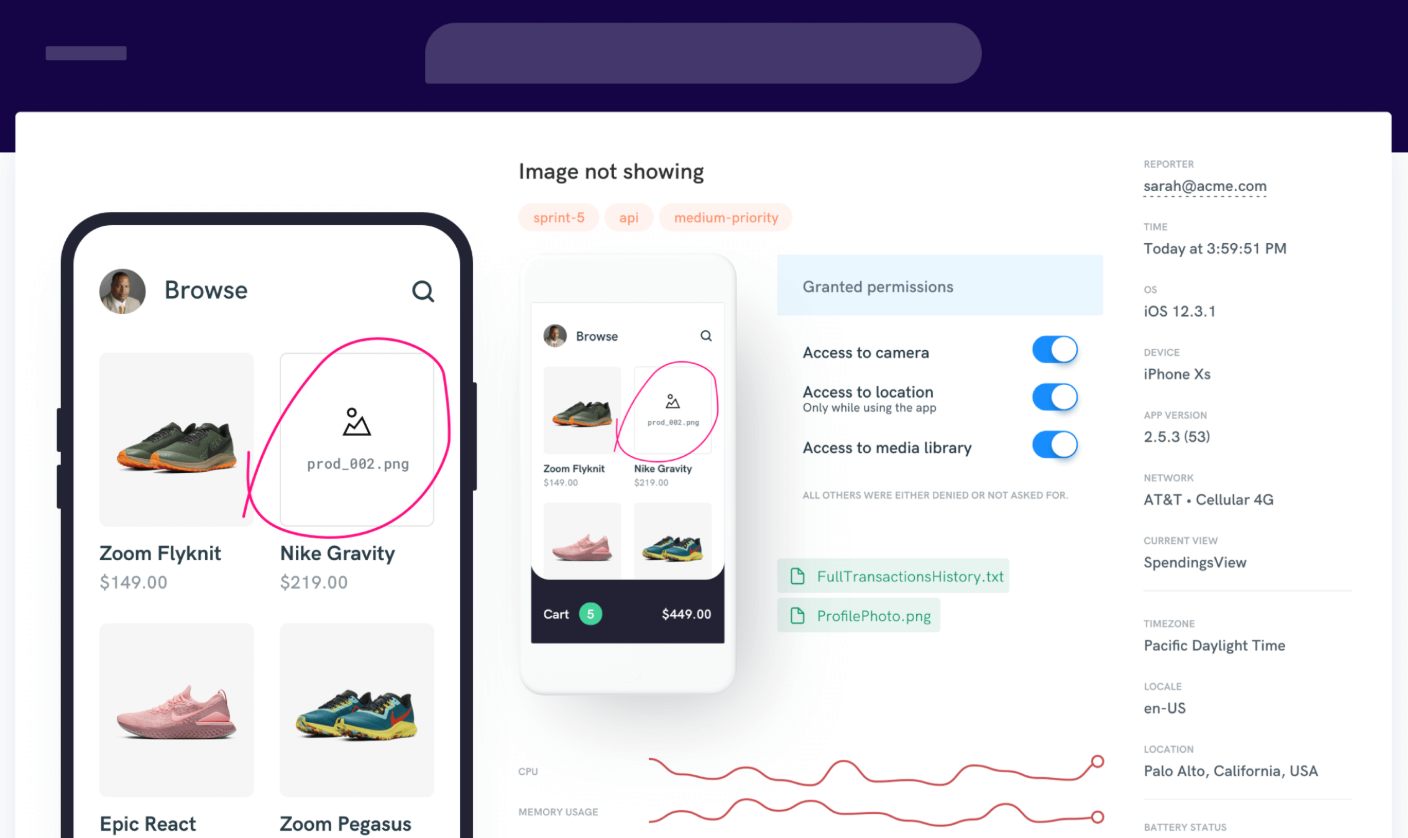
This use case is especially powerful for bug and crash reporting, an area where Shake excels.
In fact, beyond session replays, Shake helps track app user behavior by logging detailed device information, user actions, and app states leading up to an issue.
Developers can then review these comprehensive logs to understand precisely how users interact with the app and identify the patterns that lead to crashes or confusion.

Capture, Annotate & Share in Seconds with our Free Chrome Extension!
Ultimately, by combining the quantitative data from your funnels with the qualitative insights from tools like these, you can look at user behavior with a lot greater precision and depth.
No two users behave identically within an app.
Some might open it for a single, specific purpose, while others can be power users who engage with every feature available.
By grouping users into segments based on their shared behaviors, you can uncover powerful insights about who they are and what they need.
This, in turn, supports app optimizations.
As Carolyn Feibleman, principal product manager at Amplitude, explains, behavioral segmentation provides a clearer picture of your app’s overall strengths and weaknesses.
Consider, for example, the segment of app users who have churned.
Understanding the behavioral patterns that lead to abandonment is the first step toward improving retention and preventing other users from following the same path.
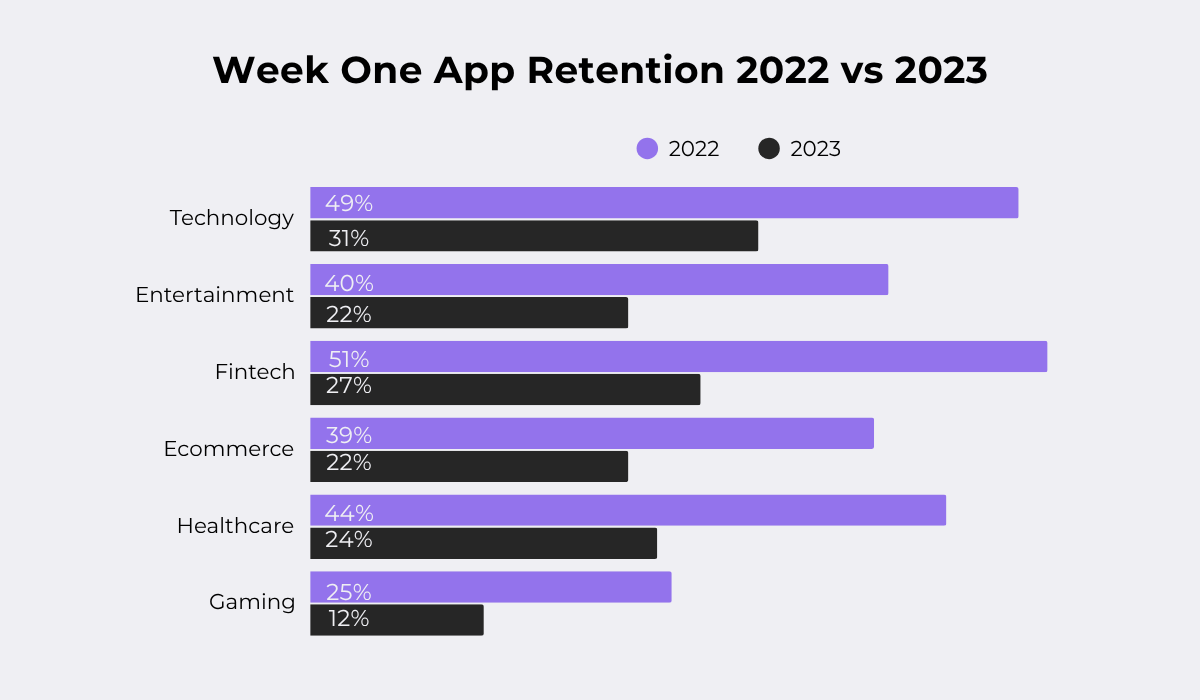
Recent research highlights how retention challenges are growing, with a noticeable drop in week-one app retention rates between 2022 and 2023 across multiple industries.
So, let’s say you have an app in a high-churn industry, like an e-commerce app, and discover that users in your churned segment almost always abandon their session after using the search bar.
This pattern would strongly suggest your search function isn’t delivering relevant results, creating a frustrating experience that you might want to check.
Some other types of behavior you can segment based on are illustrated below.
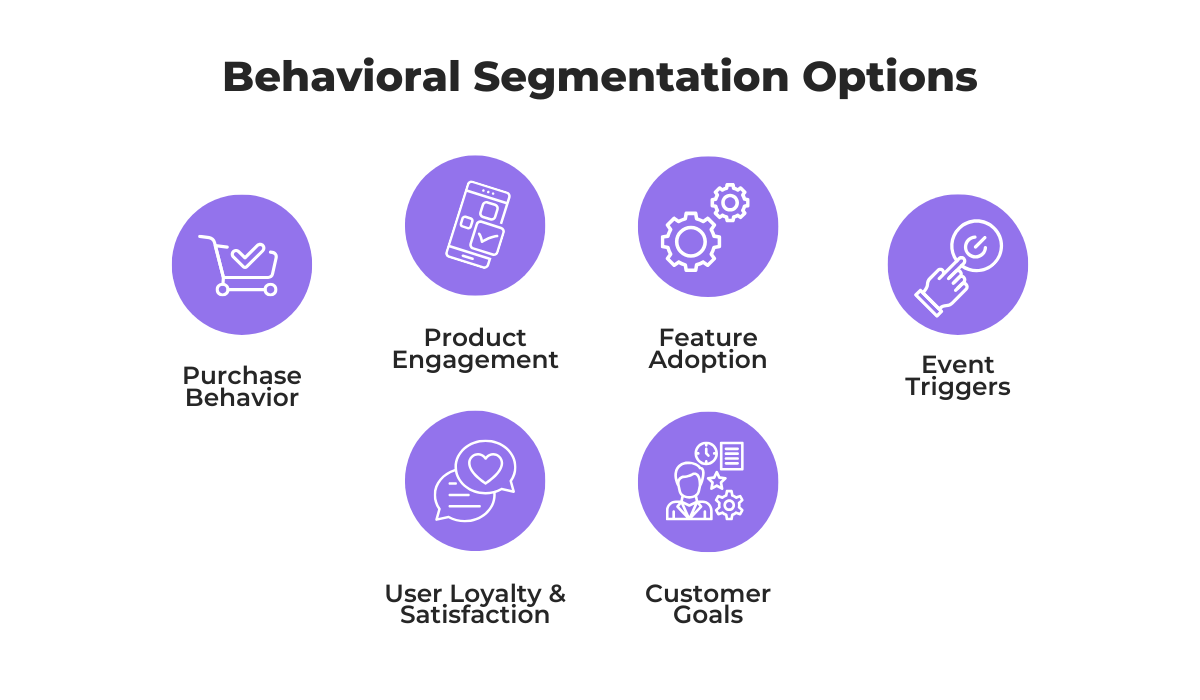
Within these segmentation options, you can drill down into users who show your desired behavior.
This allows you to isolate specific cohorts, like those who consistently make big purchases or users who abandon their carts.
By doing so, you can detect meaningful patterns in how users interact with your app, revealing both pain points and opportunities for optimization.
Through segmentation, you essentially transform all the raw user activity into actionable insights to personalize the experience for your user groups.
Finally, all the effort spent on user behavior analysis would be wasted if you didn’t actually use the resulting insights to create tangible improvements in your app.
The ideal scenario is for this stream of behavioral data to drive meaningful product iterations, but that means this process can’t be done haphazardly.
A more structured approach, like the one illustrated below, shows there are some crucial steps we need to account for.
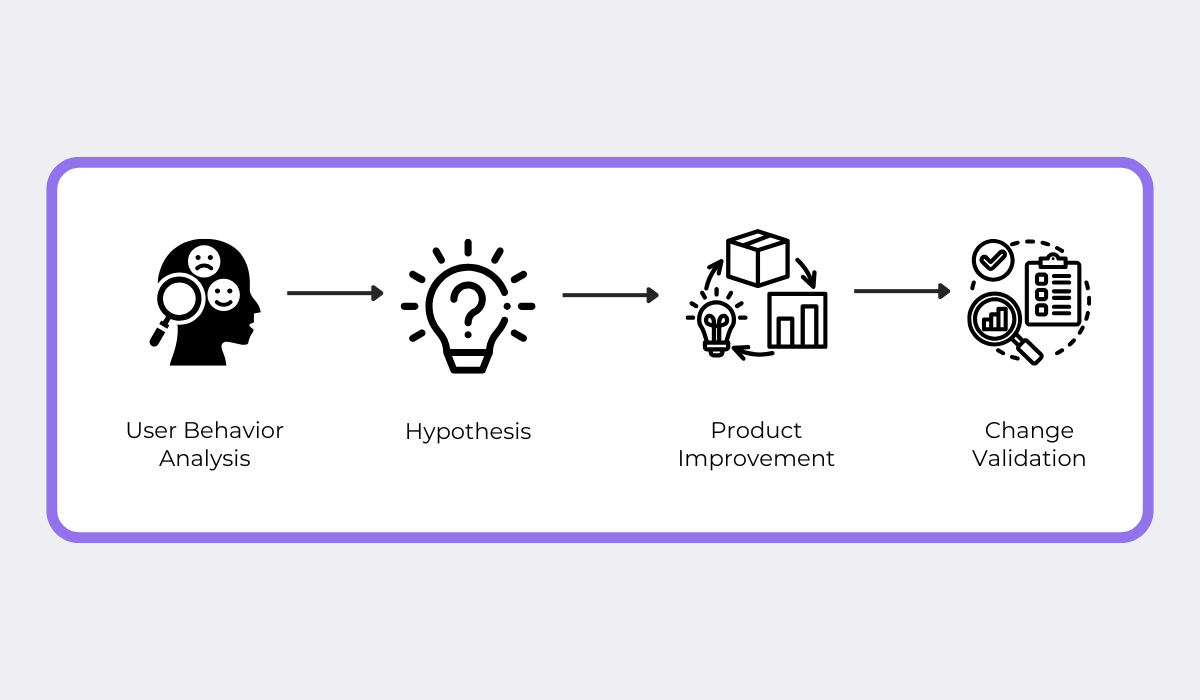
First off, based on your user data insights, you need to form a hypothesis.
For example, after seeing users struggle to find a key feature, your hypothesis might be: “If we move the feature button to the main navigation bar, adoption will increase because it will be more visible.”
Based on this hypothesis, you can go ahead and create the app change.
The essential next step is to validate that change and see if it confirms your hypothesis.
Building on our example, you would validate the change by measuring the impact of moving the feature button with hard data like clicks and feature usage.
When we examine this process, we can see that it’s really a framework for experimentation that tests out product iterations.
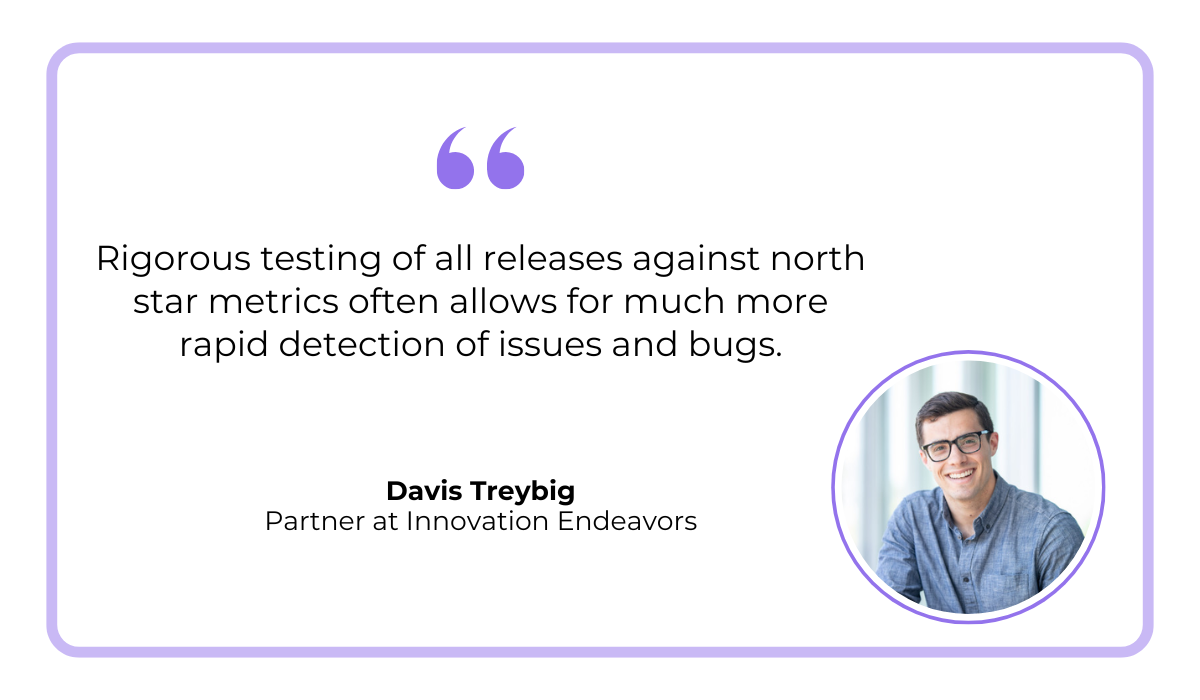
Davis Treybig, a partner at the early-stage venture capital firm Innovation Endeavors, talks about the importance of this experimentation in an article on the topic.
He says that trying out different variations of a change can not only quantify that the change worked but can even help reveal product issues.
Plus, experimenting with your app changes can provide even more useful behavior data.
Whether a change based on your hypothesis brings a positive or negative result, it’s a valuable learning experience, as you gather more information from your users on what works for them and what doesn’t.
This creates a powerful, continuous loop of improvement: insights from user behavior lead to a change, which in turn generates new user behavior data, fueling the next round of insights.
This concludes our guide on analyzing user behavior.
We’ve explored a six-step process from start to finish, from defining goals and analyzing user flows to applying your findings to improve your product.
It’s a practical framework that you can follow and build on, whether you use our tips to improve your existing process or if you’re starting from scratch.
By using the practices and tools we covered here, you can build with confidence, creating an app experience that truly resonates with your users.
From internal bug reporting to production and customer support, our all-in-one SDK gets you all the right clues to fix issues in your mobile app and website.
We love to think it makes CTOs life easier, QA tester’s reports better and dev’s coding faster. If you agree that user feedback is key – Shake is your door lock.
Read more about us here.

Add to app in minutes

Doesn’t affect app speed

GDPR & CCPA compliant

Unexpected things pop up
Just like bugs in your app or web 🐛 Fix them now with just one reporting tool.