
Top challenges every developer team lead faces

Although there are plenty of discussions about what it means for developers to be productive, that doesn’t change one clear ambition of team leaders—to have the ability to measure their team’s productivity.
And that’s understandable. In order to drive a development team to better results and more efficient work processes, it’s necessary first to understand where there is room for improvement.
That’s why, in this article, we’ll go through metrics for measuring developers’ productivity.
There are many out there, but these should be enough to give you an overview of your team’s productivity.
Table of Contents
Let’s kick things off with a metric that many in software development consider one of the most important—quality defects.
Whether you call it quality defects or code quality, which is also a common name for this metric, it means the same—the more defective the code, the lower its overall quality.
This is one of the metrics that can be considered a foundation for assessing the work of developers, as Angel Almada, 3Pillar’s Director of Enterprise Program Management, explains.
“At the team level, everything gets measured over a team’s velocity. At the individual level, we need to evaluate code quality and collaboration as primary metrics.”
Of course, the ideal number of quality defects in a code would be zero.
However, it’s futile to chase that goal because, in software development, there’ll inevitably be some occasional mistakes, bugs, and other defects.

Get unreal data to fix real issues in your app & web.
For example, according to data from Stepsize, a developer spends roughly one day a week dealing with technical debt, meaning they are improving someone else’s code quality.
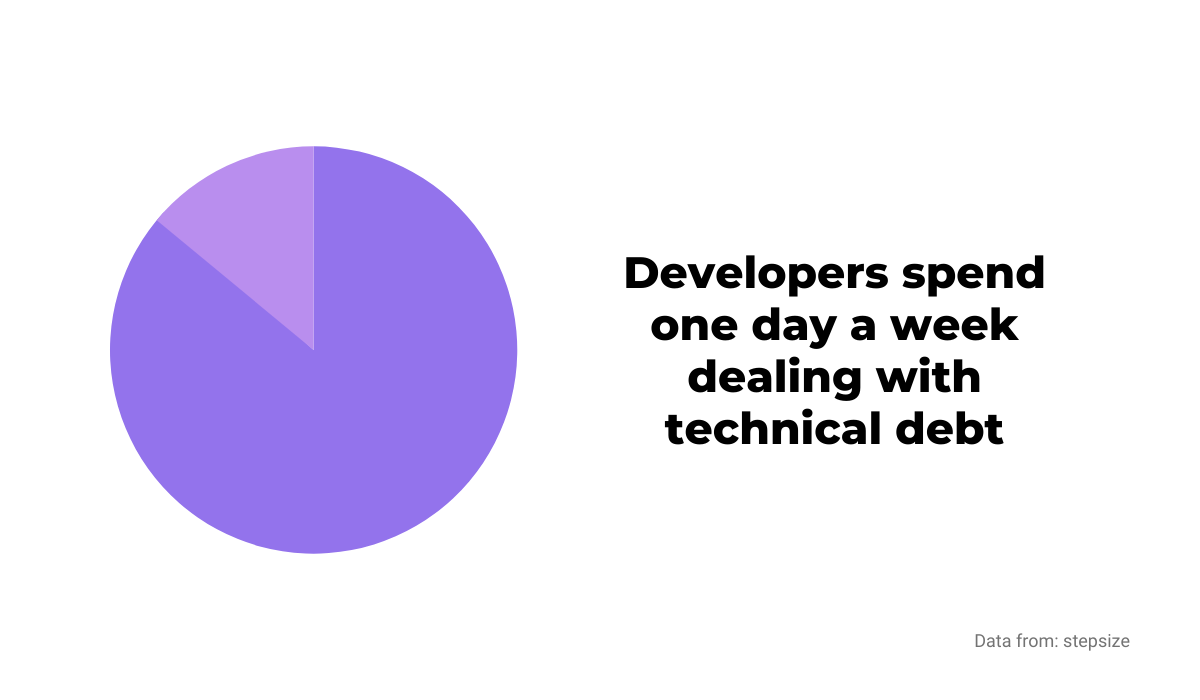
That’s a big hit to productivity, but the effort and time you would spend reducing defects to zero would be even more significant.
For productivity’s sake, it’s better to focus on analyzing those quality defects to learn from them and, consequently, write better code.
Also, if you want to deal with quality defects like bugs faster and more efficiently, you should check out our own product, Shake.
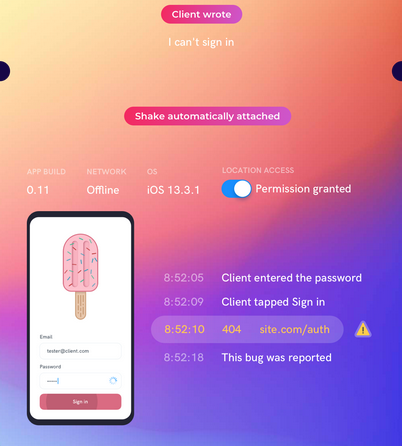
With Shake, both your users or a QA team can report bugs to your development team with one shake of the phone.
Shake automatically creates a report with over 50 pieces of data necessary to deal with bugs efficiently.
That can help reduce quality defects in your code and make your development team more productive.
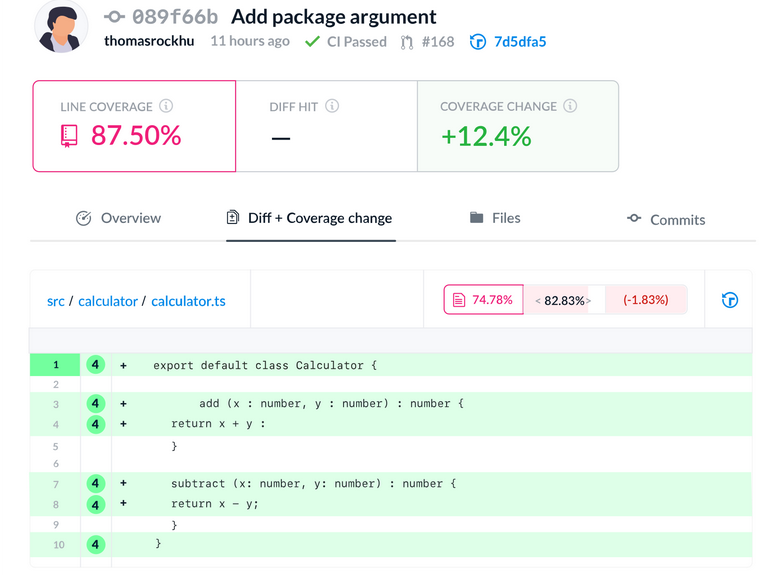
Code coverage is a valuable metric for tracking and monitoring your development team’s testing activities.
It determines the percentage of code lines validated by a test procedure.
In other words, with the help of code coverage reports, you can see how much code is tested and which parts aren’t, showing you the productivity of your development team in that area.
To calculate that percentage, you can use the following formula:
Code Coverage = (Number of lines of code executed by a testing algorithm/Total number of lines of code) * 100.With the amount of code that developers produce, it’s helpful to know how much is tested and which parts still need to be before they are deployed.
The example below shows what 100% code coverage looks like.
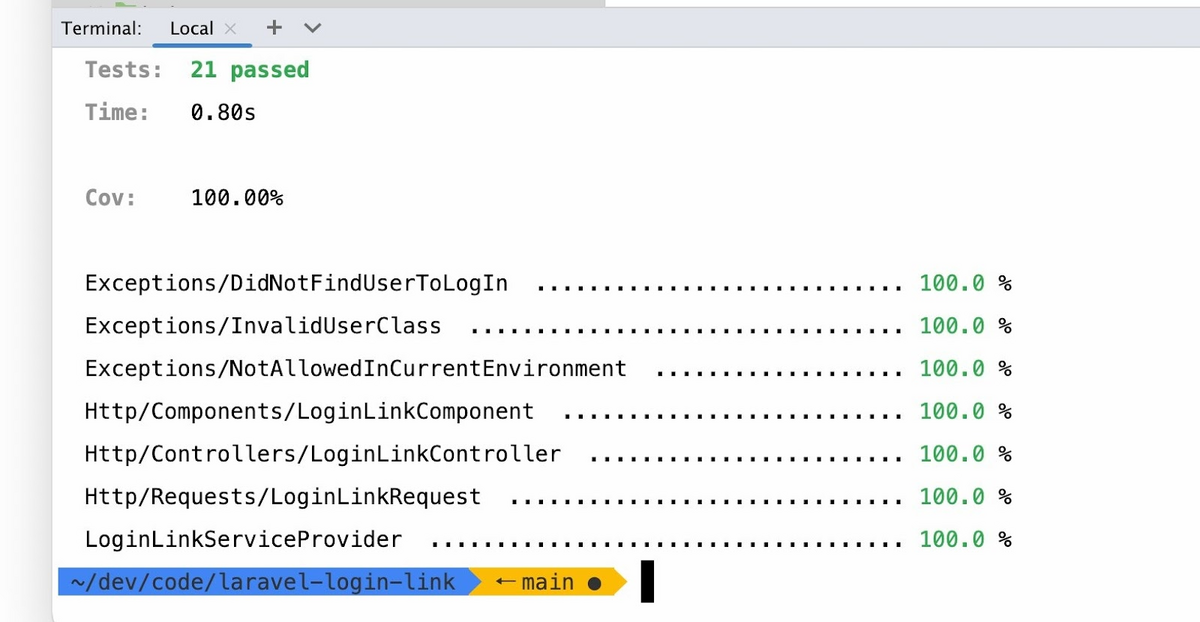
That means that every line of code is run through a testing algorithm and that developers are as productive as possible in that regard.
Code coverage also makes things easier for further development of the product.
For instance, the QA team can know what parts of the code to pay attention to so that, in the end, good code is shipped out.
Tools like Codecov can be useful for measuring code coverage. The tool highlights the parts that weren’t tested and generates reports.
A productive development team should have code testing as one of the priorities. Code coverage can show you if that’s the case.
Cycle time is a metric that can tell you a lot about the productivity of your development team.
It measures the time it takes for a task to move from one phase to another.
Since in cycle time development gets broken down into four stages, you can see which stage is problematic, where the bottlenecks are, and what to improve to make your team more productive.
Below is a breakdown of cycle time.
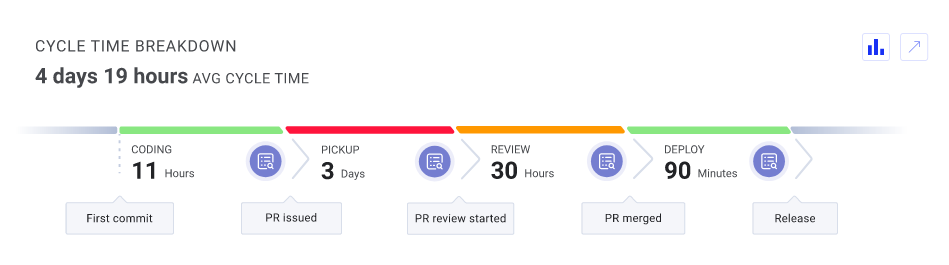
As you can see, cycle time consists of coding time, pickup time, review time and deploy time.
Coding time is measured from the moment a developer proposes a change to the codebase to the moment when they create a pull request.
Pickup time is essentially a waiting time; another person should inspect the code before the review phase.
In the reviewing phase, a reviewer addresses everything a developer should do; proposes rewrites, comments on the code, etc.
Review time is the amount of time the code spends in this phase.
Finally, the time to deploy is the time from merging the code to the moment it’s put in the hands of the users.
Tools like LinearB can help you see how much each segment of cycle time takes and how productive is your development team.
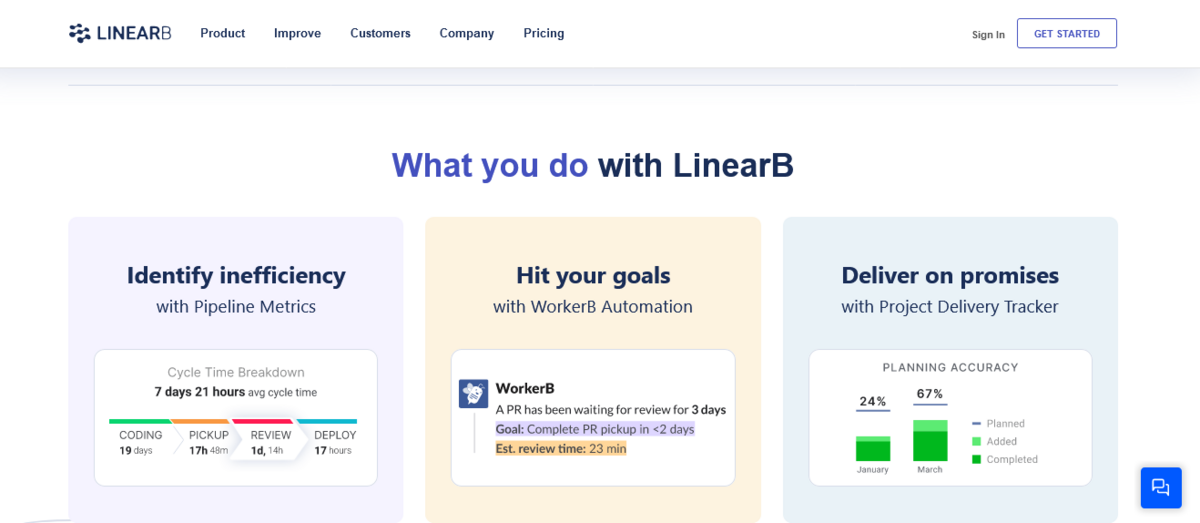
That way, you can measure how long your developers spend on each phase, from the code change proposal to the finished feature.
Lead time is a similar metric to cycle time, but it still has its own benefits, which make it worth noting.
This metric shows you how much time passes between task creation and work completion. In other terms, it measures the time between the beginning of development to customer delivery.
While cycle time measures your team’s time to complete a task, lead time is a broader metric.
It leans more toward user satisfaction; lead time can help you assess the time it takes for your users to get their requests sorted out, and, therefore, how productive your development team is.
You can use various tools to measure your team’s lead time.
Javier Hertfelder, CTO of FXStreet, explained that they calculate lead time with the help of Jira after each sprint to see how much time a task is in a particular state.
Jira is not the only tool, of course. Below is cycle time and lead time in Time Between Statuses, an add-on from Atlassian.
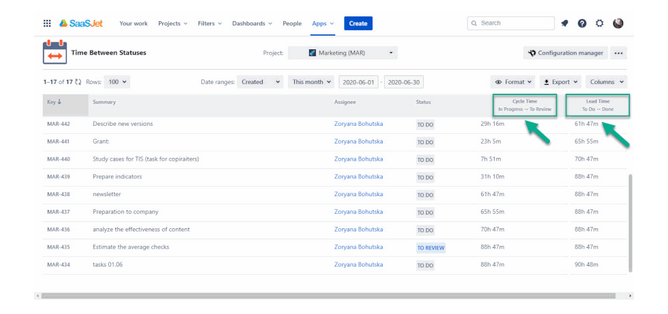
You can check out these tools to see which would be more suitable for your team to use.
When you have access to your development team’s lead time, you can see their productivity and predict how long it will take to deploy the product to the customers; that can help you create accurate estimates.
In conclusion, lead time is a valuable metric to measure and predict the time frame for tasks and projects. Similar to cycle time, it can also show you if there is room for boosting productivity.
If you want to have an overview of the project and your development team’s work process, a project timeline can be a very valuable metric.
It’s a combination of several metrics that show you how productive your team is in a specific time frame, whether a week, a month, or any time frame that suits your needs.
For example, if you’d use Waydev as a tool for creating project timelines, you’ll have access to several metrics.
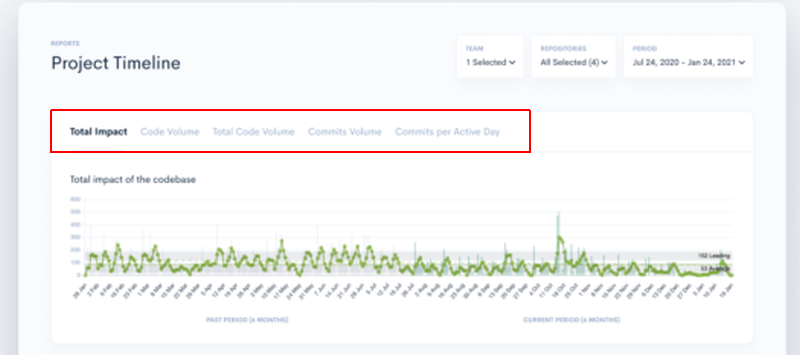
Commits per active day track the average number of commits per team in a day, and commits volume is the number of commits a team created on a specific day.
Furthermore, total impact indicates the complexity of the changes in the codebase, while code volume is the number of lines of code changed in the codebase.
With that data, you can assess how productive your development team is and track their progress throughout the project.
You can also use other tools for visualizing the project timeline. For example, Gantt charts are a popular solution.
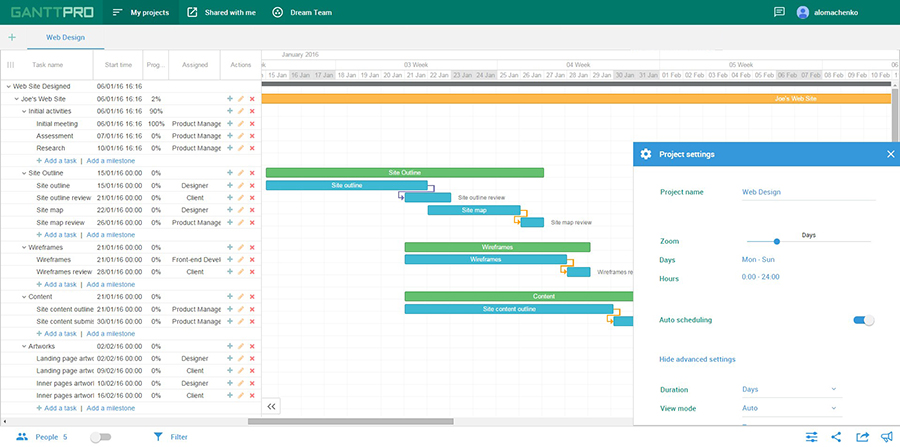
With a tool like GanttPRO, pictured above, you can easily create and track the project timeline.
Overall, it’s a useful way to see at a glance the duration of various activities and how the project is progressing.
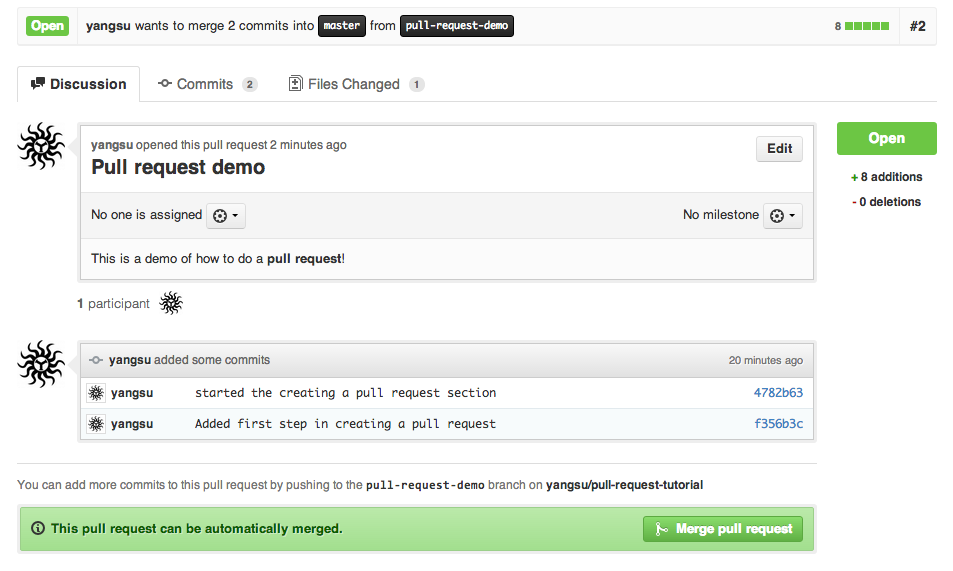
Open pull requests are a metric that can tell you how efficient your team is in working together.
As you probably already know, with pull requests, developers notify their colleagues that they’ve completed a task and now they want some feedback on it.
If pull requests are open for too long, that can mean that the productivity isn’t as it should be.
It might indicate that the work process is poorly organized or that developers are simply overwhelmed with work.
How long should it take for someone to review a pull request?
That depends on the size of it, the cleanliness of the code, the importance of code change, and other factors, but it should be measured in days—leaving it open for too long might create bottlenecks and stall the whole process.
For instance, your team should be able to handle pull requests faster than in the example below.
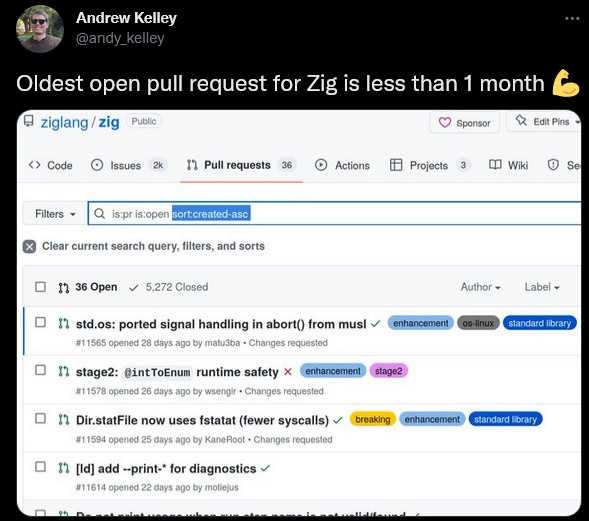
That way, the number of open pull requests shouldn’t become overwhelming.
This metric is especially useful if your development team works in one-week or two-week sprints because it’s easy to see if the metric changes and whether the productivity is rising or falling after a sprint.
According to that data, you can decide if changes in work processes are necessary, be it in allowing more time for developers, or adding more people to the team.
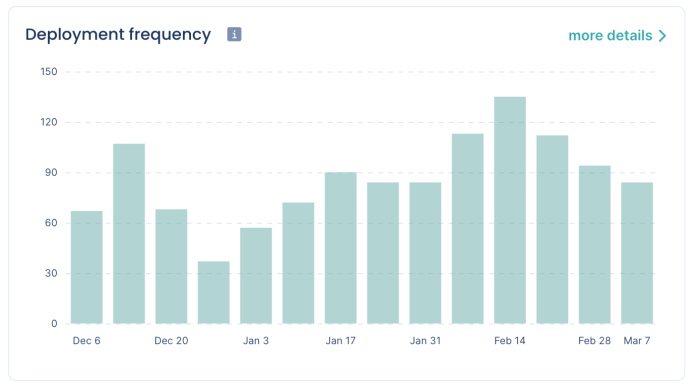
If you want to know how fast, efficient and productive your development team is, deployment frequency is one of the most valuable metrics.
It shows how often the code is deployed in production, measured within a specific period of time like a day or a sprint.
For example, below is a graph that shows deployment frequency in one-week sprints.
You can track this metric in tools like Pulse; the graph below is one of its features.
A high deployment frequency indicates that your development team is well-organized and efficient—in other words, productive.
On the other hand, a low deployment frequency can indicate problems that you should address.
Is the team’s work process inefficient, or is the amount of work too big for the team?
Or is it simply a matter of shipping too extensive features and code changes?
Deployment frequency can show you if you need to encourage smaller but more frequent deployments.
That’s worth considering since they’re easier to review, test, and fix than large ones.
If you’re wondering what you should aim to achieve with this metric, here’s a breakdown from Accelerate: State of DevOps 2021.
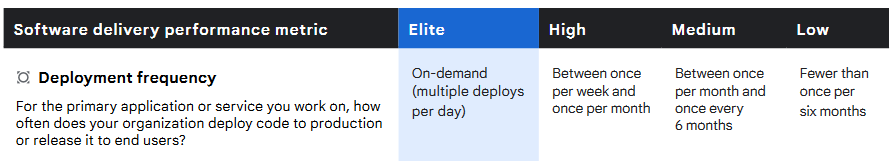
As you can see, an elite level of deployment frequency means multiple deployments per day, which means that you have a truly agile and productive team.
On the other hand, if your deployment frequency is less than once in six months, you should reevaluate how your development team is organized and what causes those issues.
Another metric that indicates the code quality is the change failure rate.
Change failure rate, as its name suggests, measures the percentage of changes (meaning deployment of the code to production) that fail.
In Google’s Accelerate: State of DevOps 2021 report, the change failure rate is considered a key metric:
“A key metric when making changes to systems is what percentage of changes to production (including, for example, software releases and infrastructure configuration changes) fail.”
In other words, the lower the rate, the better, as that indicates that the code is of good quality and failures such as bugs and errors are rare, requiring fewer patches and rollbacks.
The low failure rate also indicates that the team takes testing seriously and doesn’t ship code that isn’t reviewed and adequately verified.
A change failure rate up to 15% is considered elite by the already mentioned Accelerate: State of DevOps 2021 data.
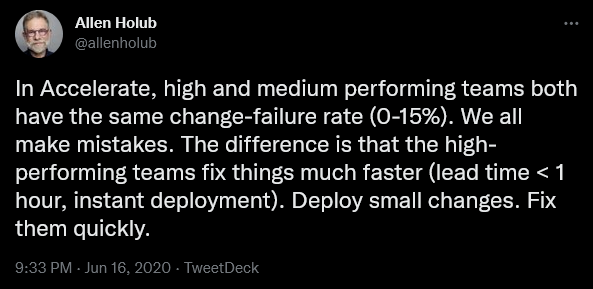
As you can see, high, medium, and low levels have the same range, from 16% to 30% of change failures.
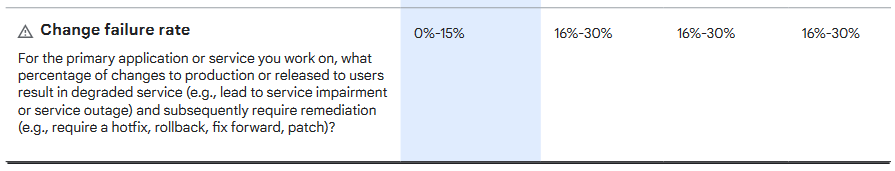
Allen Holub, a computer scientist, and educator commented that the differences in failure rates aren’t as crucial as at which speed the team deals with them.
In sum, the change failure rate is a good indicator of a team’s productivity; you should include this metric to see the state of changes that your developers push out into production.
Continuing the theme of failures from the previous section, we came to another metric that refers to unwanted situations and how the team deals with them.
Mean time to restore (MTTR) shows the average time it takes to recover from a critical situation like a product or system failure.
To measure it properly, you should track the time from the moment of failure to the moment a feature or system becomes operational again.
The metric is fairly easy to calculate even manually. You add up the measured time of outages during a specific time period and divide it by the number of outages.
Of course, the less MTTR, the better because low MTTR indicates that your team is productive in managing failures.
Here’s Allen Holub again, weighing in on the topic.
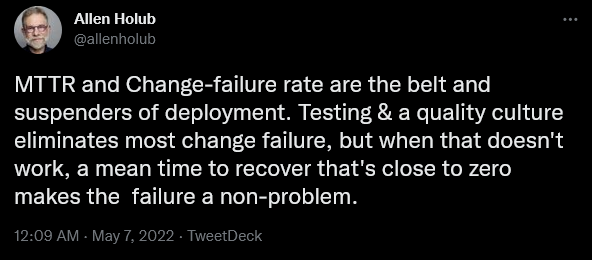
In order to reduce MTTR, your team should have procedures in place for instances when the outage happens.
They should be able to quickly respond, document the issue, engage the right people to fix it, and resolve the issue as fast as possible.
It’s also valuable to have a procedure like a blameless post-mortem, which can help your developers understand why the failure happened, how to prevent it in the future and what to do to respond even better—without looking for someone to blame.
A productive development team should score well on this metric.
Productivity isn’t measured only by the speed of writing code or deploying features. Knowing how to fix a major outage swiftly is also a big part of a productive culture.
Measuring developer productivity can be challenging, but it can also be very valuable.
The sheer number of metrics available to measure can be overwhelming, so it’s essential to choose the right ones—those which can precisely show you how fast, efficient and accurate your developers are in their work.
The metrics we examined in this article can do just that. If you find a way to measure them and use the results they provide you, you can have a crystal clear picture of your development team’s productivity.
From internal bug reporting to production and customer support, our all-in-one SDK gets you all the right clues to fix issues in your mobile app and website.
We love to think it makes CTOs life easier, QA tester’s reports better and dev’s coding faster. If you agree that user feedback is key – Shake is your door lock.
Read more about us here.

Add to app in minutes

Doesn’t affect app speed

GDPR & CCPA compliant

Unexpected things pop up
Just like bugs in your app or web 🐛 Fix them now with just one reporting tool.