7 best tools for tracking app user behavior

Have you ever wondered what people are actually doing when they use your app?
After all, you can’t just guess what they’re clicking, what’s making them leave, or what parts are confusing them.
That’s why this article will guide you through seven effective methods for tracking how users interact with your application.
We will explore different techniques, from looking at broad patterns to replaying individual user sessions, to give you a complete picture.
Table of Contents
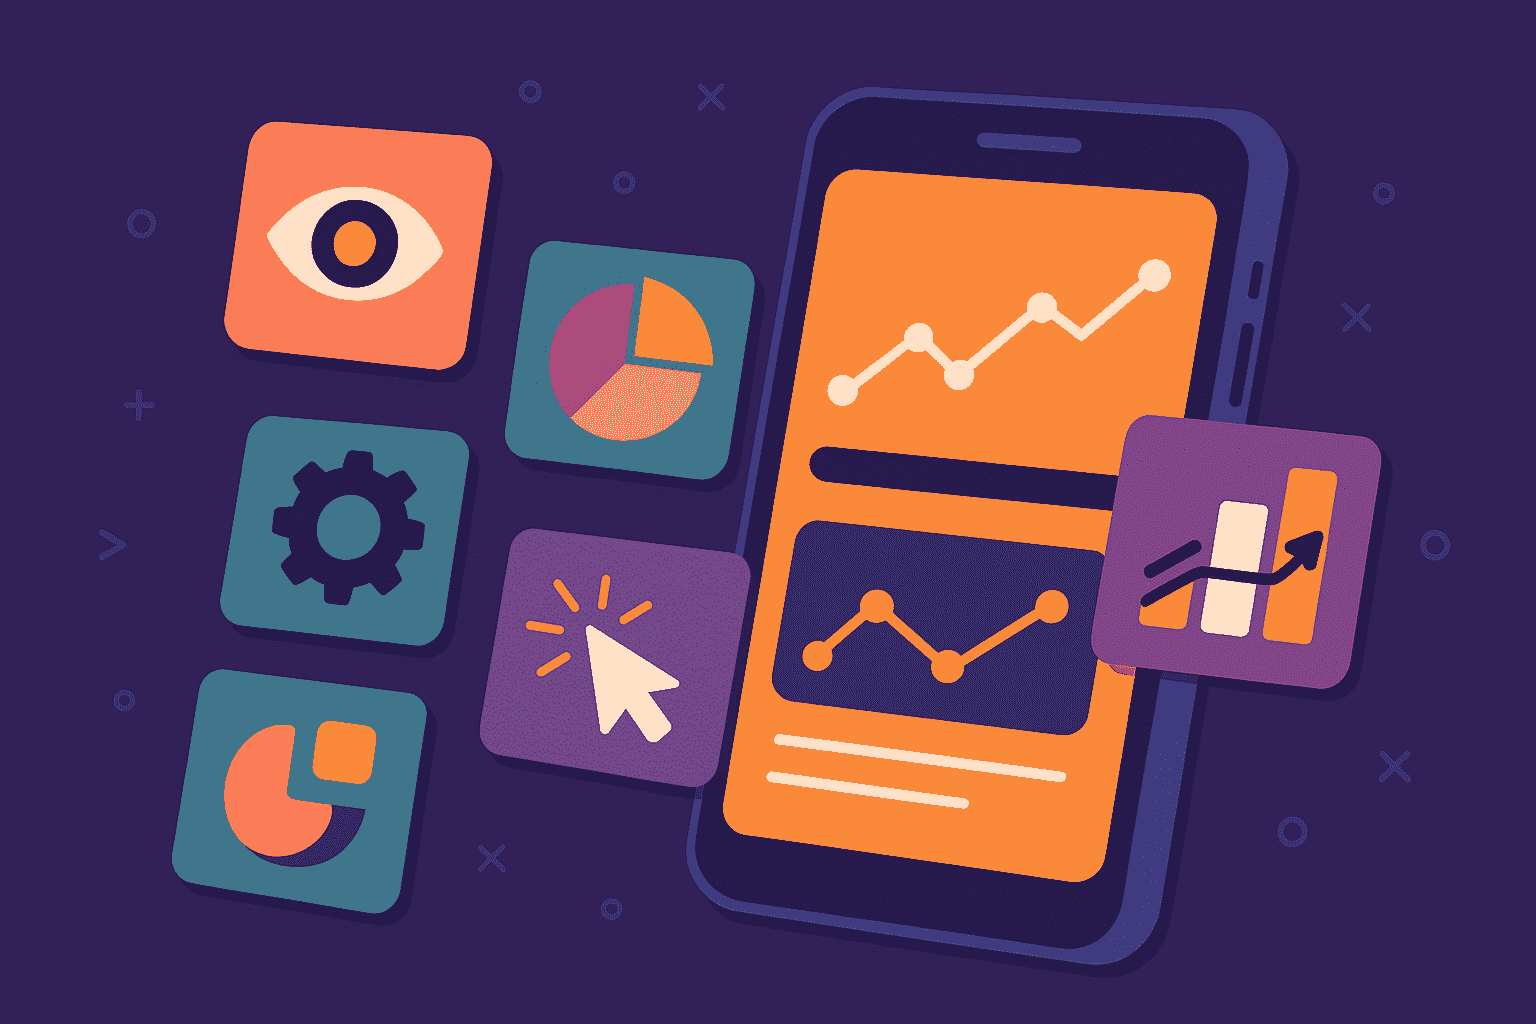
One of the most fundamental ways to monitor user behavior is through a method called event tracking.
This approach focuses on recording specific, individual user interactions as they happen inside your app.
It doesn’t concern itself with complex, multi-step journeys.
Rather, it focuses on single actions, with some of the “events” including button taps, form submissions, or even distinct gestures like swipes and pinches.
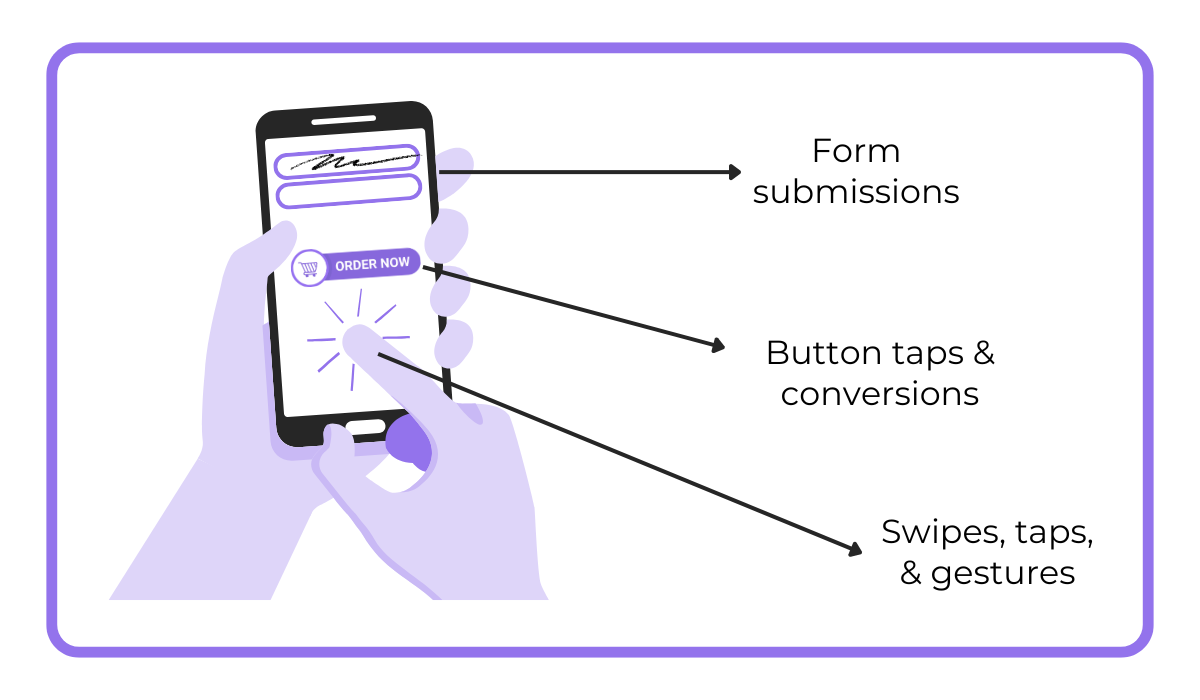
To clarify this, let’s use a button tap as an example.
With event tracking, you can measure exactly how many times a specific button is pressed.
You can see this data for all users or filter it for a specific group, and you can even analyze the dates and times when this event happens most frequently.
This method is straightforward, provides incredibly valuable information, and serves as a foundation for other user behavior analysis techniques.
For instance, if a button is a critical part of your business, like a “Buy Now” button, event tracking allows you to measure the conversion rate.

Get unreal data to fix real issues in your app & web.
You can also see how app updates or promotional periods affect the frequency of users completing this key action, and so on.
A variety of powerful tools are available to implement this method, including:
These tools consolidate all your event data into a single place, providing dashboards and features to help you monitor all of your app’s most important events.
Many of these tools, like Userpilot, even allow you to tag events and features without writing any code.
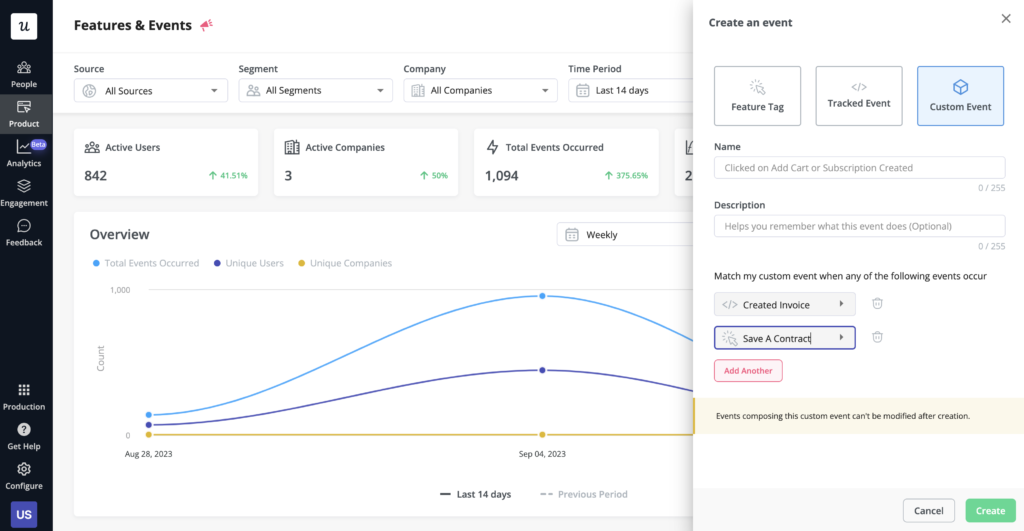
You can intuitively select the on-screen elements and interaction types—such as clicks, hovers, or text inputs—that you want to track and start collecting this valuable data immediately.
Ultimately, these tools allow you to define and track all your essential app events, giving you a solid foundation of key user behavioral data.
Unlike event tracking, which focuses on isolated user actions, user flow mapping takes the analysis one step further.
As the name suggests, with this practice, we aim to map out and analyze the complete paths users take within an app.
A simple example is a login flow, which covers the steps a user takes from opening the app and entering their credentials to successfully landing on the home screen.
But these flows can also be quite complex.
Take the user flow diagram for a hypothetical music player app, shown below.
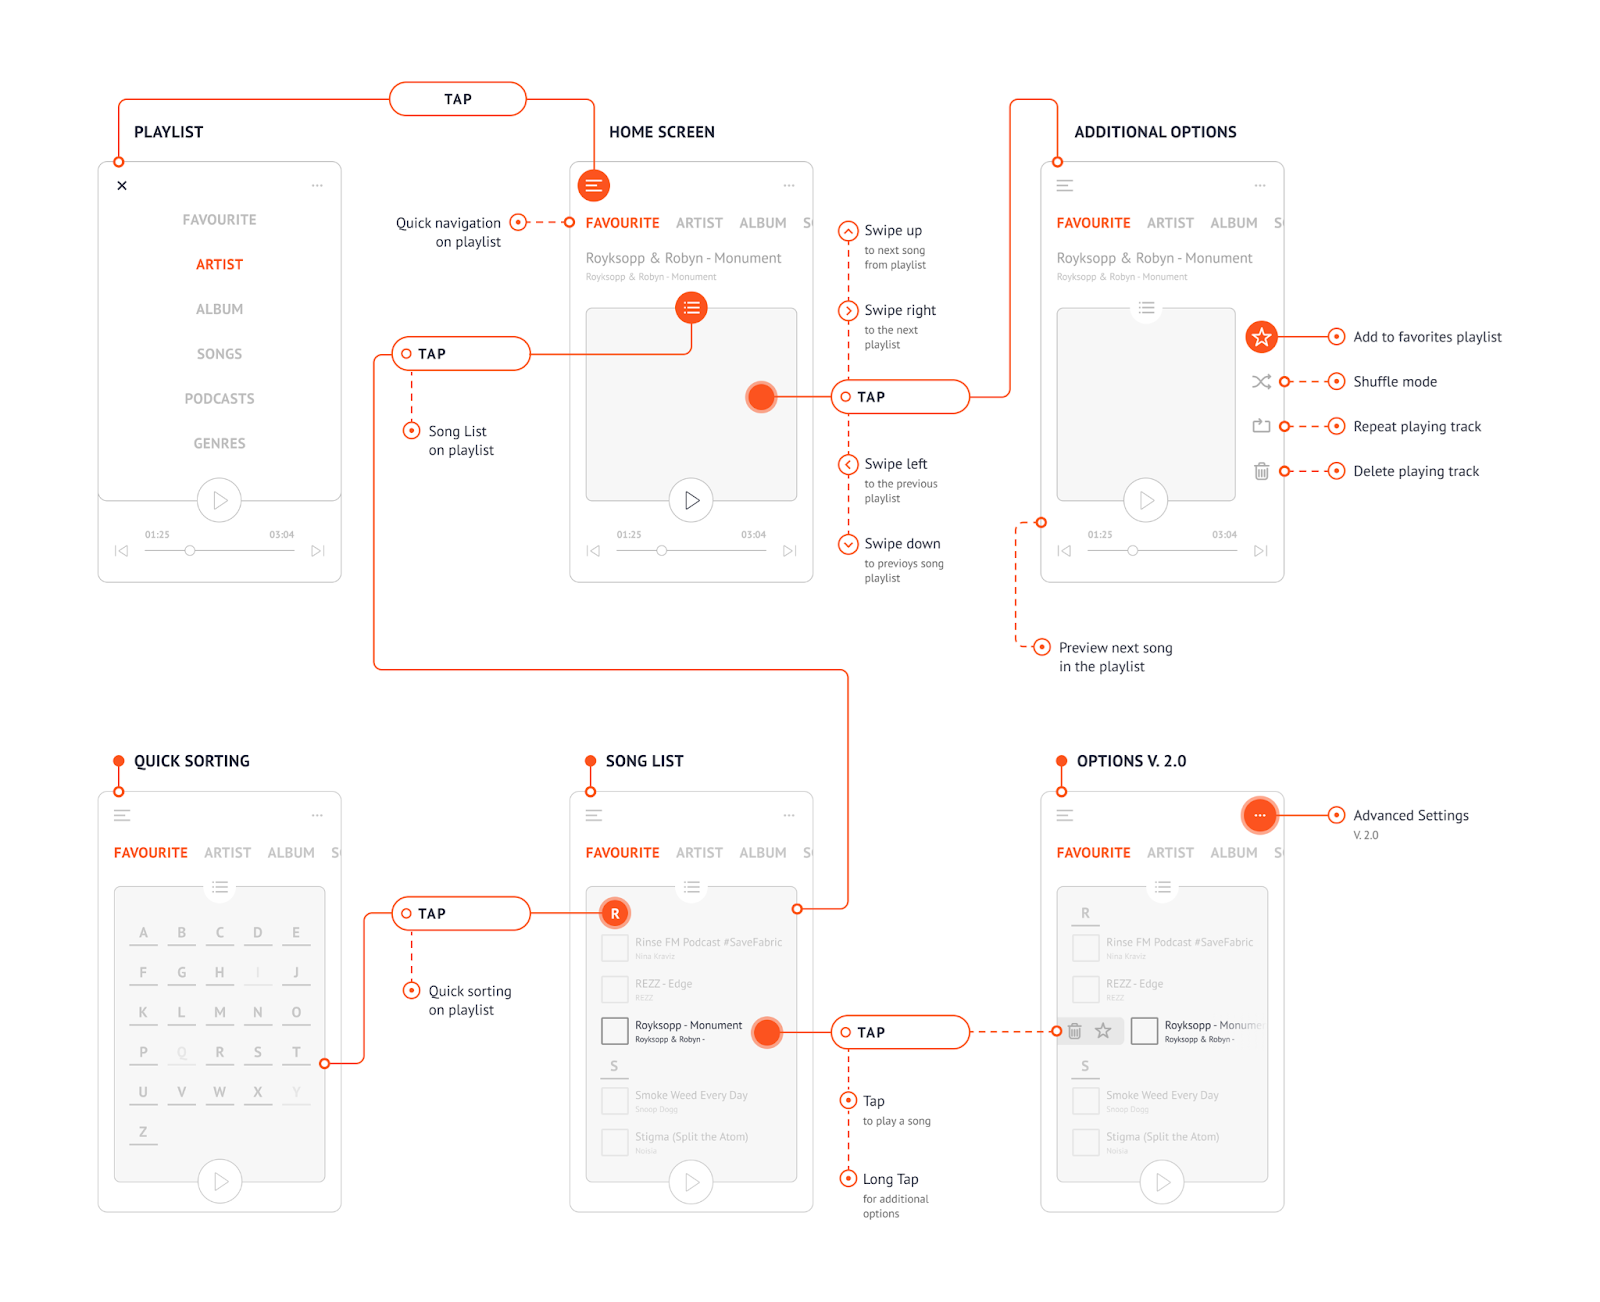
As you can see, this flow follows the user through various app functions like viewing and organizing the song list and the actions that trigger some key events.
Flow diagrams like these help visualize the entire user experience from start to finish.
This, in turn, allows you to focus your efforts on improving key actions within the flow and ensuring users have an intuitive journey without any friction.
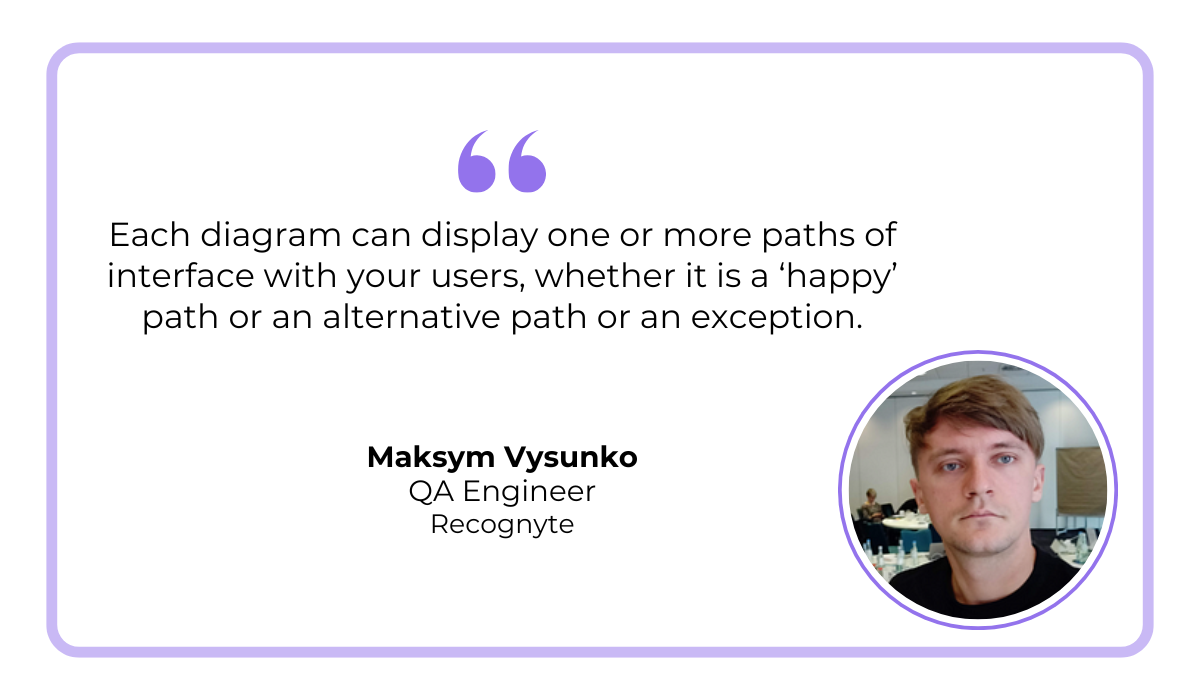
As experienced QA engineer Maksym Vysunko explains, to make the most out of this method, you want to map out the ideal user flow along with any alternative paths and exceptions.
Alternative paths are different, but still valid routes a user might take to reach a goal, whereas exceptions are error paths where a user gets stuck or something goes wrong.
It is critical to monitor all of these possibilities, not just the “perfect” journey.
By analyzing where users deviate or run into trouble, you can identify hidden pain points, fix confusing navigation, and discover opportunities to make your app more intuitive for everyone.
If user flow diagrams map out potential user journeys, session recordings give you a direct view of real user sessions.
Compared to the other methods we’ve discussed so far, this one is primarily qualitative.
This means you get visual insight into specific user gestures, moments of hesitation, accidental misclicks, or even signs of frustration like rapid tapping.
These kinds of nuanced insights are incredibly valuable and are often difficult, if not impossible, to understand from raw data alone.
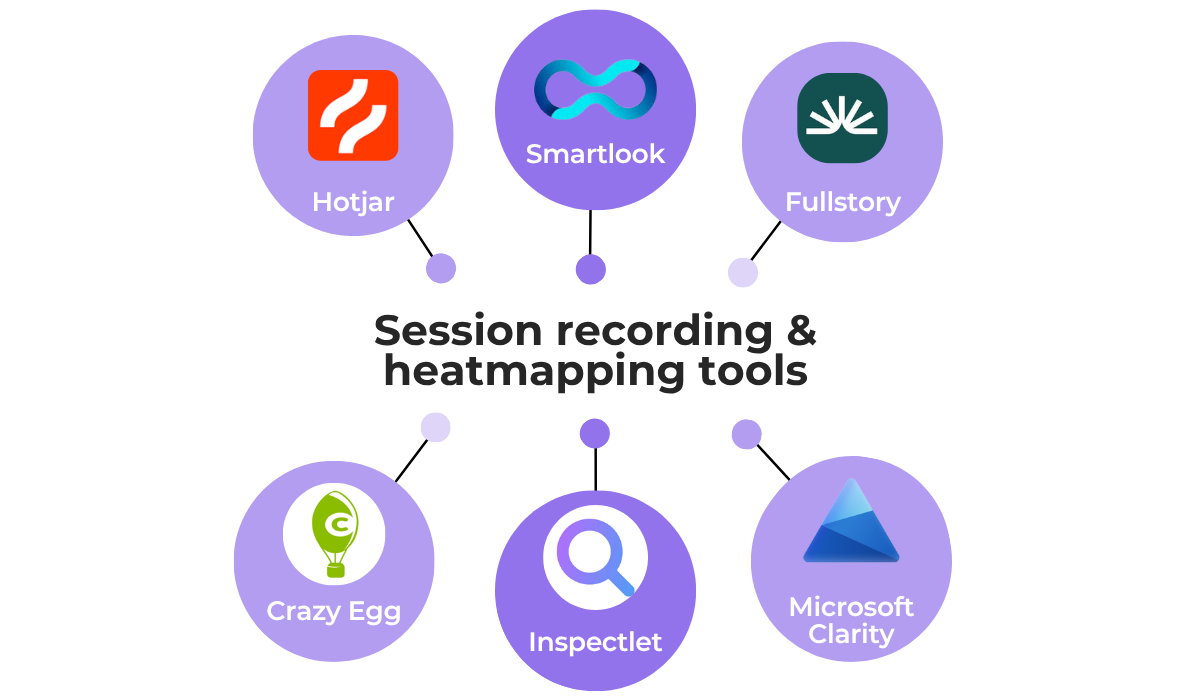
There are various powerful tools dedicated to session recordings and heatmapping (which we’ll cover in the next section).
Of course, watching these recordings can clearly reveal what users did.
But when it comes to figuring out usability issues or bugs, it doesn’t always explain why something went wrong.
Luckily, tools like Shake can fill the gap.
Shake is our very own bug and crash reporting tool that comes with its own automatic screen recording feature.
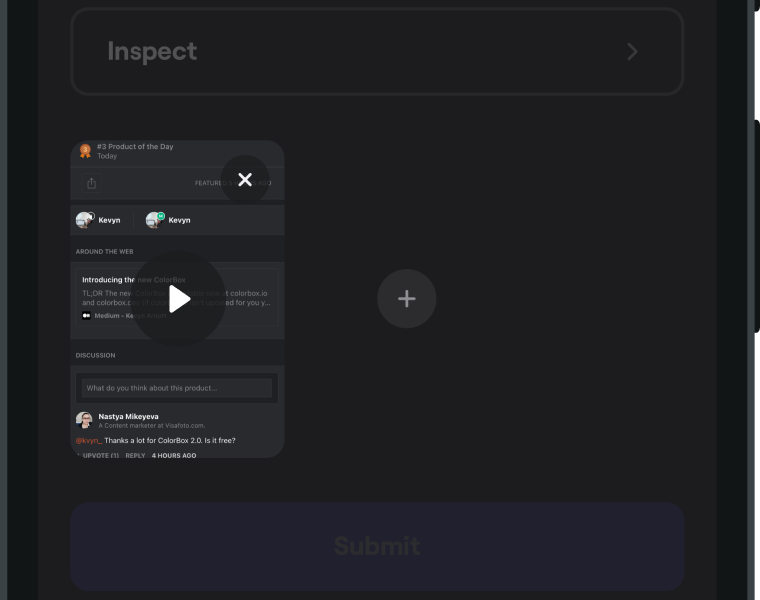
It records the user’s actions in the moments leading up to an app issue, and users can add these to feedback reports or issue tickets.
But the magic happens behind the scenes, where Shake automatically collects over 70 different data points.
You can see some of them outlined in the image below.
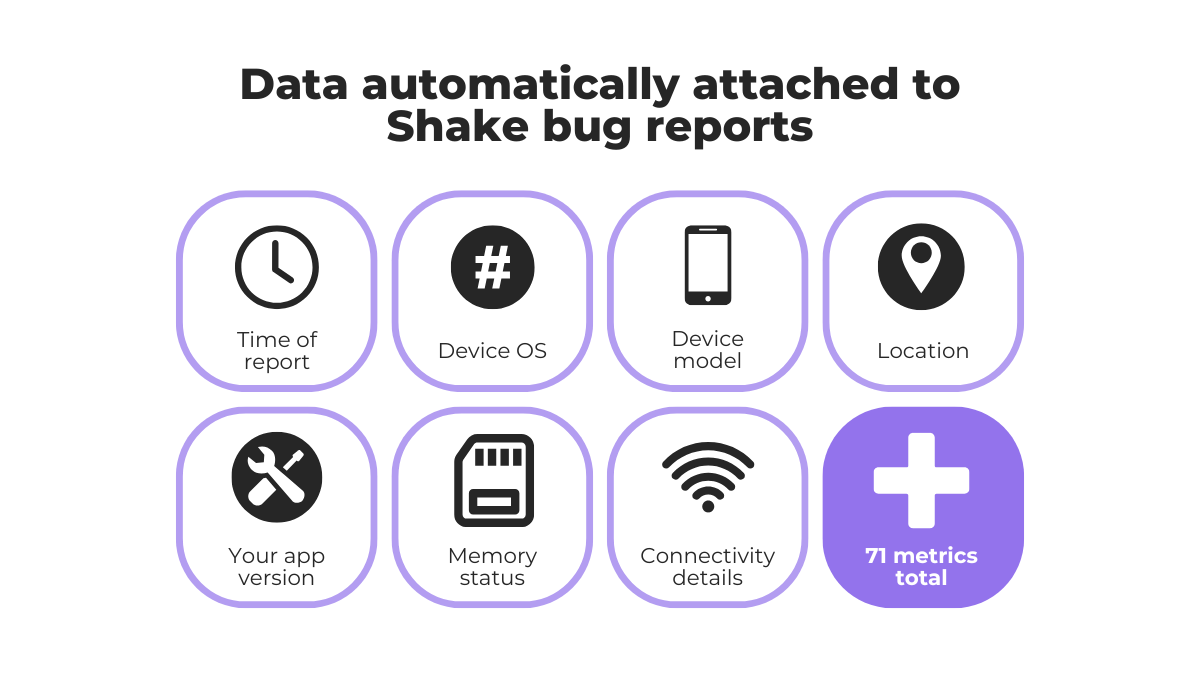
This means that, whenever a developer receives a ticket through Shake, they don’t just get the screen recording.
Instead, they also receive all the necessary technical metrics to start debugging the problem right away.
Overall, this combination of session recordings with hard, quantitative data from tools like Shake can give you a complete picture of your app issues.
While session recordings provide incredibly detailed, session-specific information, sometimes you need to aggregate this data to get more general insights.
This is where heatmapping tools come in.
They take the gesture and touch data from hundreds of individual user sessions and visualize where activity is most concentrated on a given screen.
To see what this looks like in practice, take a look at the image below.
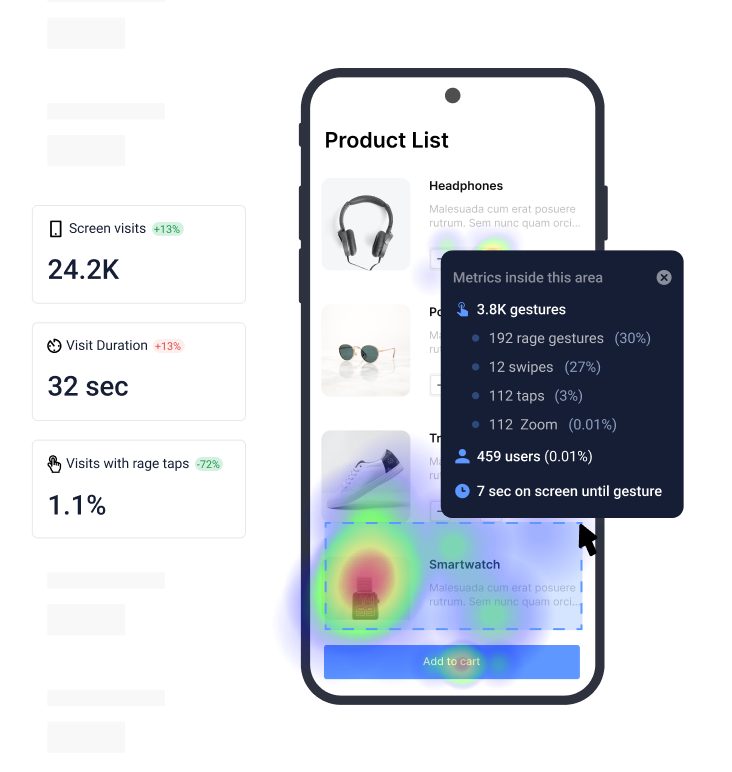
The concentration of activity is represented by color.
Typically, red, orange, and yellow hues show that a lot of user activity is present in a particular spot, while green and blue areas indicate much less interaction.
Similarly, many heatmapping tools can also generate scroll maps.
These show you how far users scroll down a page, revealing whether they explore the lower sections or tend to stick to the top section of the screen.
With this data, you can easily see high-level user experience trends.
But that doesn’t mean heatmaps are only for strategic planning: they can also help solve very practical usability issues.
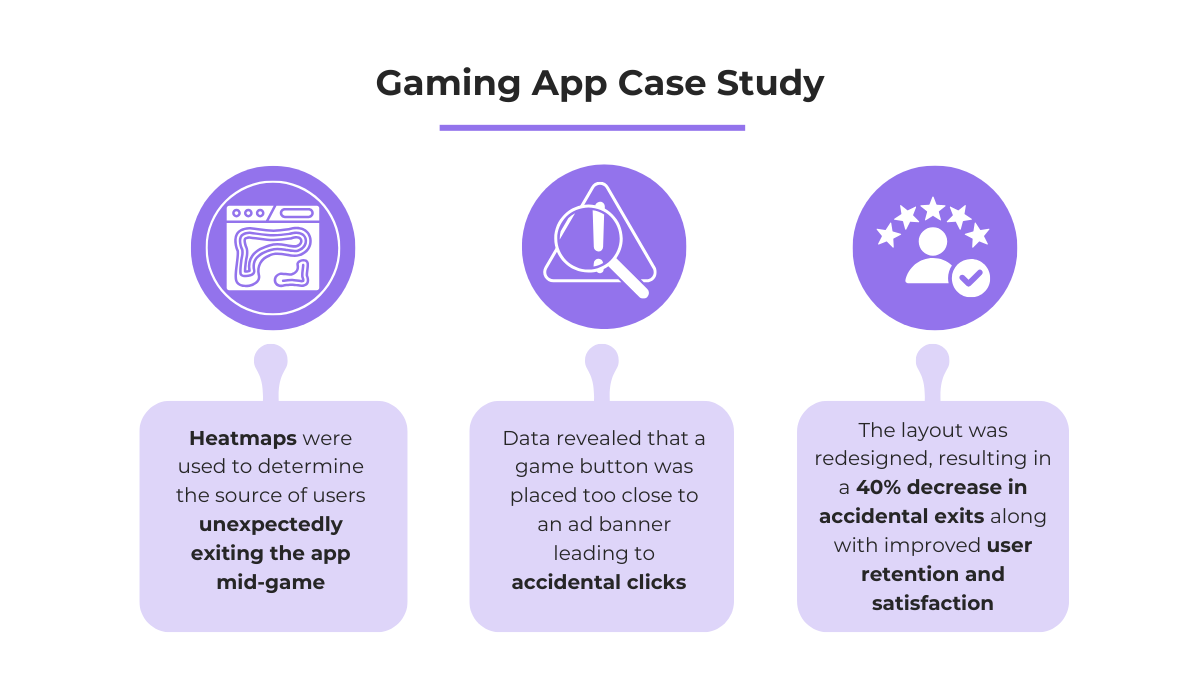
Take this case study from Plerdy as an example.
A mobile gaming app was struggling with users leaving the app without any obvious explanation, so they used heatmaps to investigate.
The heatmap analysis results clearly showed that a misplaced ad banner was causing the entire problem, as users were accidentally clicking the ad when they intended to interact with a game element.
And, simply reordering the elements on the screen fixed the issue.
Discovering higher-level usability issues like these is nearly impossible with other methods.
This makes heatmapping an invaluable tool to use alongside more data-oriented behavior tracking practices.
Returning to more quantitative approaches, we have feature usage analytics.
Simply put, this method helps your team track the frequency and intensity of interaction with specific app features—anything from the search bar to notifications.
By monitoring these interactions, you can see which aspects of your app are the most valuable or attract the most users, which is especially important in several specific situations, outlined below.
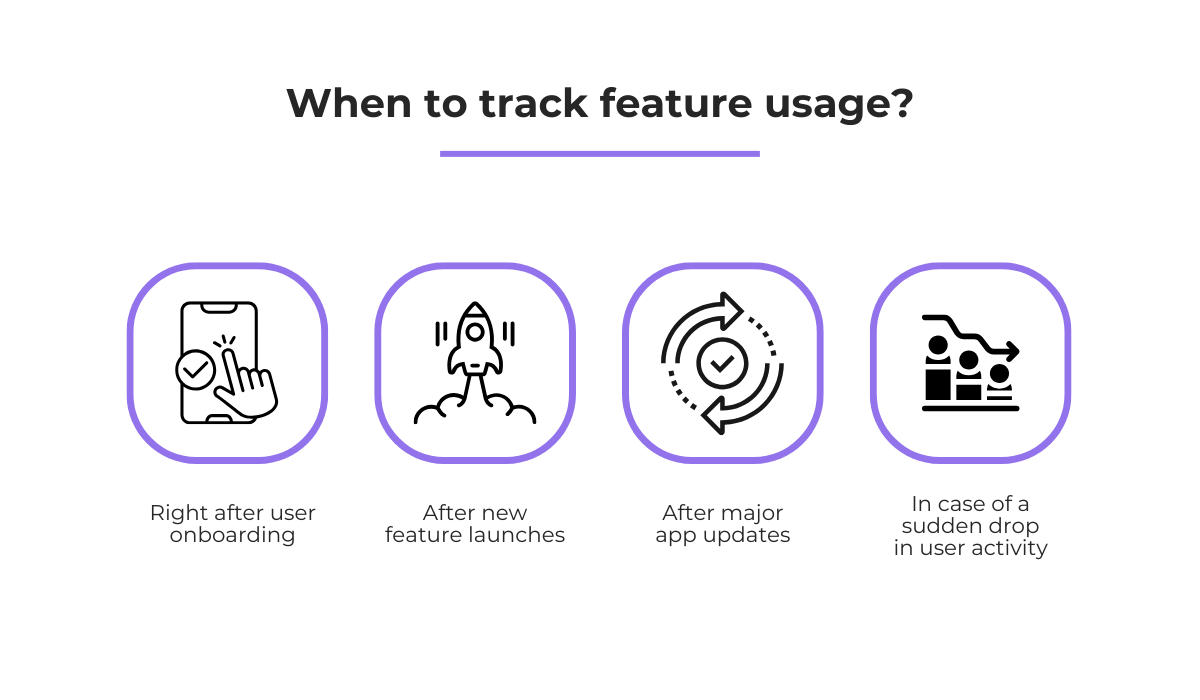
For instance, you might discover that a major feature launch has failed to gain traction, with only 5% of your user base trying it out.
Or you might find that a previously top-performing feature suddenly loses a significant number of users, pointing to a bug or another technical issue that has appeared within that feature.

Capture, Annotate & Share in Seconds with our Free Chrome Extension!
As with the other user behavior tracking methods on our list, various tools can help you track feature usage in your app.
For example, tools like Usermaven allow you to set up events that signify when a feature is being used, such as a user clicking on a specific button or visiting a particular screen.
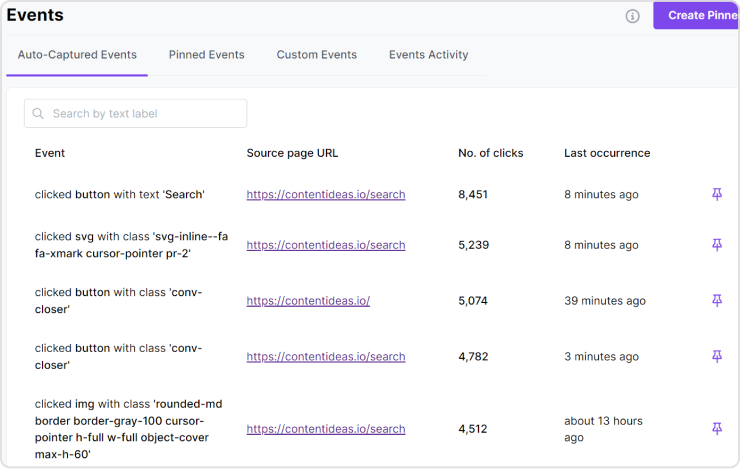
Once these are set up, you can track key metrics like the number of user interactions within that feature, including all the clicks and gestures, or the average time a user engages with it.
In essence, feature usage analytics provides the hard data you need to plan your product roadmap and monitor features that need improvement, promotion, or even phasing out.
The sixth user behavior tracking method we’ll cover is funnel tracking.
This is a goal-oriented form of analysis that tracks the specific steps users take as they move toward a desired action, which is usually a purchase or another key conversion.
Where user flow mapping deals with detailed diagrams and all possible paths, a funnel focuses on a single, critical journey.
For a purchase conversion goal, it might look something like the image below.
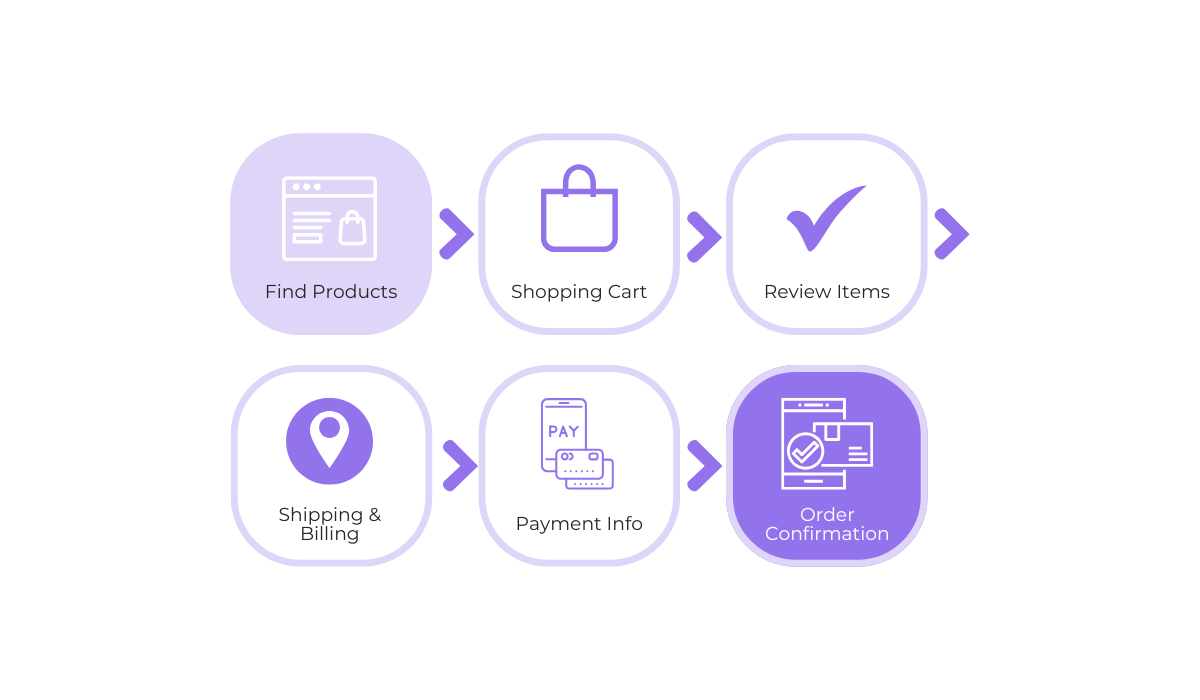
In this example, we would track specific stages in the purchasing journey, ultimately leading to a purchase order.
One of the most important things funnel tracking helps us see is whether some stages of the funnel act as bottlenecks, preventing a large number of users from proceeding to the final conversion.
For example, you might adjust the checkout form by reducing the number of required fields to increase purchases, or you might remove a mandatory survey that was blocking users from completing their order.
By seeing where users abandon a specific process and identifying areas where the journey flows exceptionally well, you can gain powerful insights and opportunities for optimizing your most essential conversion paths.
Finally, we have real-time user monitoring (RUM).
This method is all about tracking user activity and application performance data as it happens, in real time.
Unlike other methods on our list, which often use historical data to find trends over time, RUM gives us access to metrics almost instantly.
This immediacy enables teams to identify and react to performance issues, critical bugs, or unexpected user behavior the moment it occurs, rather than finding out about it hours or days later.
For example, take tools like LogRocket that combine powerful RUM features with other capabilities like session recordings.
This allows teams to pinpoint key issues in real time and provides them with instant session replays to visualize exactly what went wrong from the user’s perspective.
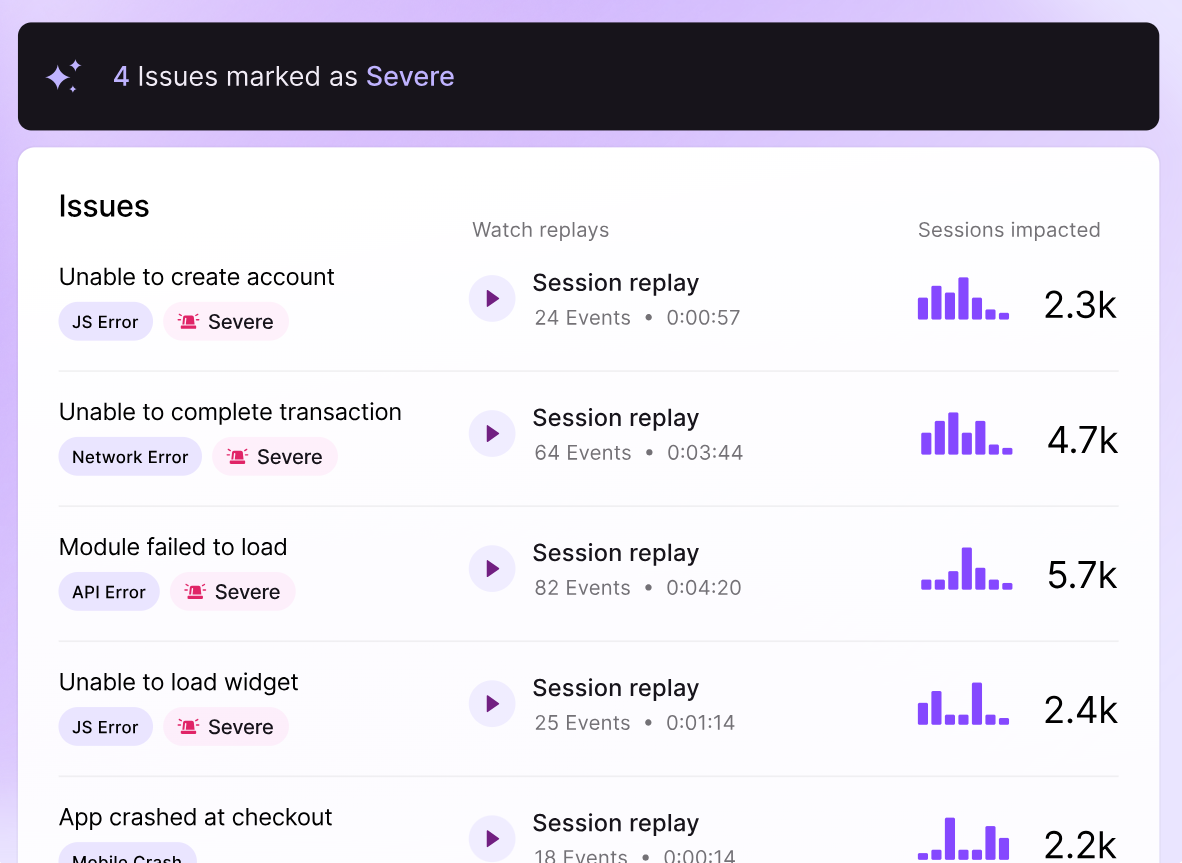
Imagine that after a new update, users suddenly can’t create new accounts.
A RUM tool would detect a spike in errors related to the sign-up process and alert your team immediately, allowing for a quick investigation and fix before it affects a large number of users.
Other than just tracking critical errors, RUM can be used to monitor a wide range of metrics, including the following:
Monitoring these core performance metrics makes RUM the ideal method for checking the health of new feature releases, running A/B tests, or seeing the effects of active marketing campaigns.
After all, you get immediate feedback and data so you can instantly see if a new release is causing performance to drop, or if users are responding positively to a change in an A/B test.
In summary, real-time user monitoring acts as a constant health check for your application.
It provides the live insights needed to maintain a stable, high-performing, and reliable user experience for everyone using your app.
And there you have it—seven ways to track app user behavior.
From analyzing broad user flows and visualizing engagement with heatmaps to watching individual session replays, these techniques offer valuable insights for various needs.
We also covered some of the powerful tools out there that can make tracking user behavior that much easier.
Your next steps?
Choose the methods that best fit your goals, select the suitable tools, and start gathering the insights that will help you build a better, more successful app.
From internal bug reporting to production and customer support, our all-in-one SDK gets you all the right clues to fix issues in your mobile app and website.
We love to think it makes CTOs life easier, QA tester’s reports better and dev’s coding faster. If you agree that user feedback is key – Shake is your door lock.
Read more about us here.

Add to app in minutes

Doesn’t affect app speed

GDPR & CCPA compliant

Unexpected things pop up
Just like bugs in your app or web 🐛 Fix them now with just one reporting tool.