Recommended
Troubleshooting vs. app debugging: what’s the difference?

Debugging is seldom fun.
First of all, nobody wants to be reminded of their mistakes. Furthermore, sometimes software defects can be challenging to solve and take up a fair chunk of the developers’ time.
For really complex defects, debugging can even take days.
However, luckily there are certain debugging methods that should significantly accelerate the process.
That’s why we’ve written this article—to introduce you to all the various strategies you can try out.
If you’re unsure how to go about debugging, keep on reading!
We’ll walk you through eight debugging techniques, so you efficiently and quickly resolve those pesky issues.
Table of Contents
The most common debugging strategy is likely the brute force method—despite also being the least efficient.
As the name suggests, this method lacks an organized, structured approach to resolving software bugs.
Instead, developers step through the code, trying various fixes until they stumble across a resolution.
The graph below visualizes the general process:
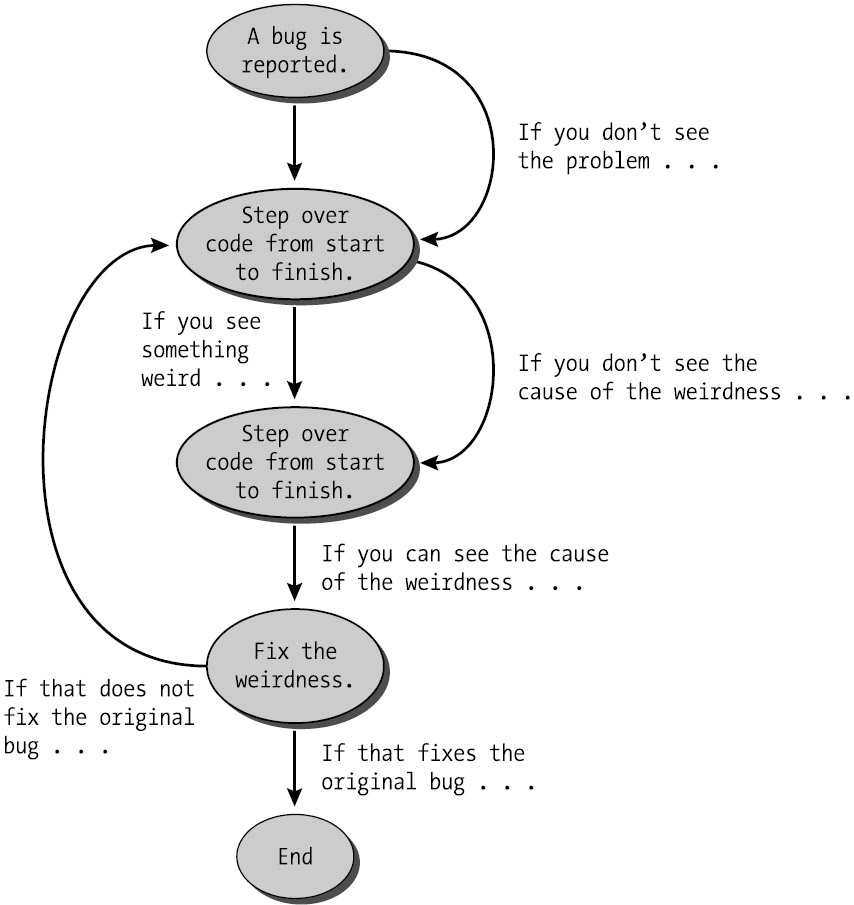
There’s no defined procedure. Developers tackle the code haphazardly, arbitrarily solving bugs until they uncover a viable solution.
As part of this uncoordinated debugging, developers often resort to the following techniques:
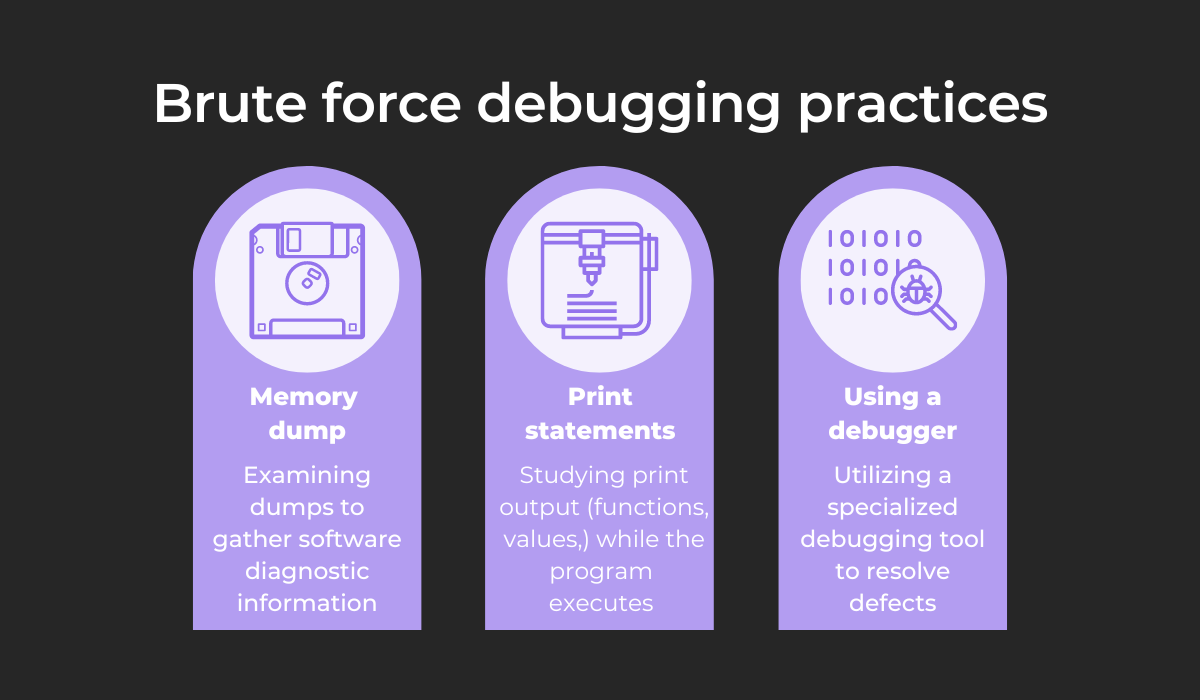
Memory dumps contain data on system states and memory contents, which is extremely useful for diagnosing bugs.
However, these dumps contain massive amounts of data, so finding this intelligence can be time-consuming.
A slightly more sophisticated technique is scattering print statements. Unlike memory dumps, print statements display the program’s dynamics and are easily read.

Get unreal data to fix real issues in your app & web.
That being said, you’ll need to be careful. This approach requires changing the code, which might conceal the bug.
Finally, brute force debugging is accompanied by debuggers. Although these tools are hugely helpful, it’s important not to rely on them too heavily.
While useful, they’re no replacement for the critical thinking debugging requires.
Because brute force debugging lacks a structured approach, it’s often inefficient and is best used as a last resort—when time is short or no other debugging method is working.
In a recent Reddit thread, one user posted a photo of their CTO‘s debugging process.
Here’s the image:
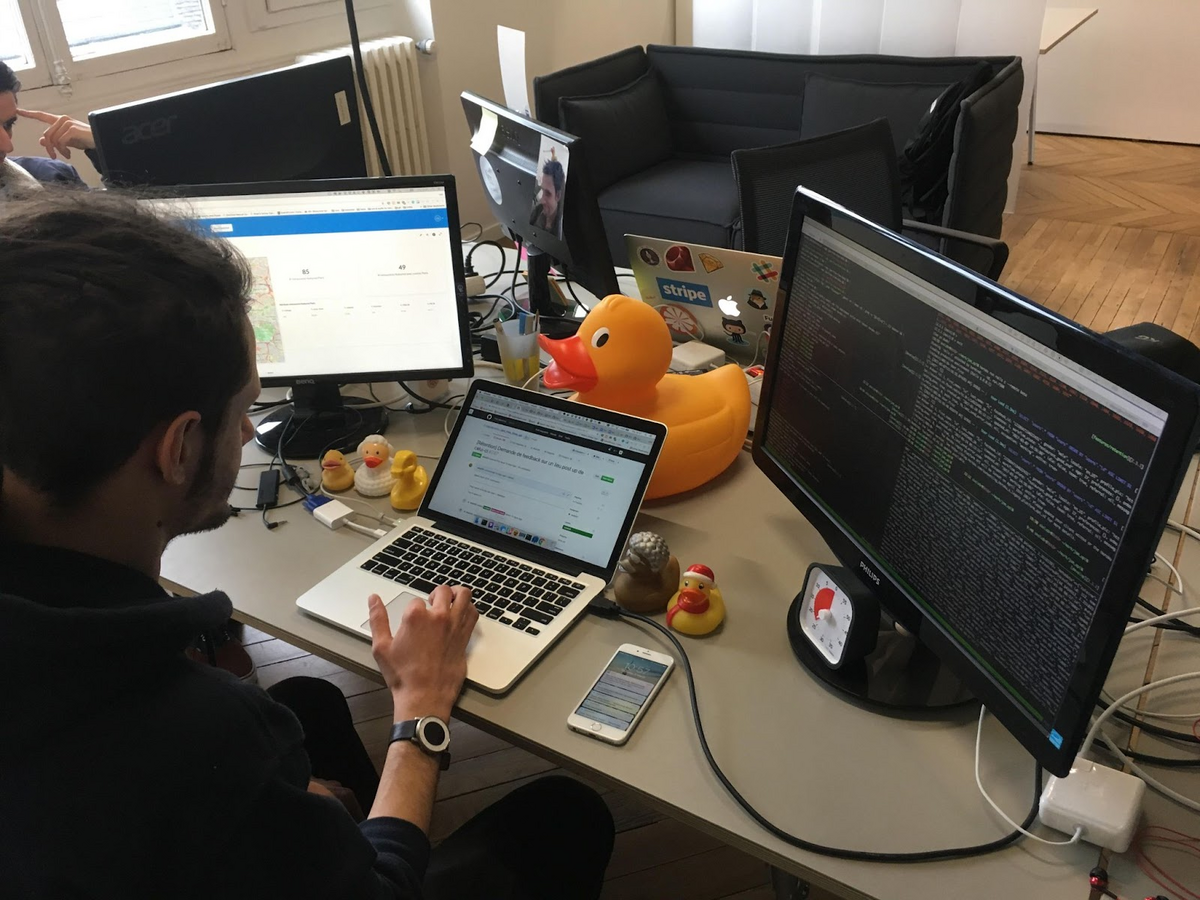
Although this picture seems absurd to those who aren’t in the know, there’s a good reason behind it.
This developer is employing rubber duck debugging—a debugging technique where you explain the bug to a rubber duck, or at least someone who has no prior knowledge of the issue that’s troubling you.
Sometimes the easiest way to get to the bottom of the problem is to attack it from a new angle. Rubber duck debugging facilitates this, as you must use plain language to describe the defect.
As you articulate the issue to the rubber duck, you’ll walk through all its particulars and hopefully realize your mistake in the process.
Experienced developer David Hayes has also commented on this, emphasizing the differences in how humans and computers operate:
When you hit a roadblock when programming, it’s likely that you’re not thinking the way a computer does. Computers are painfully precise. Humans are, generally, forgiving and loose in their understanding. So many of the “bugs” and issues you have when solving a problem in your program originate in not being clear and explicit enough in your instructions.
By explaining your logic to a rubber duck and thinking out loud, you’ll likely identify the miscommunication between you and your computer and, consequently, solve the issue.
In case you don’t own a physical rubber duck, don’t worry. There’s a website that provides a digital alternative: Cyberduck.
Here’s a screenshot:
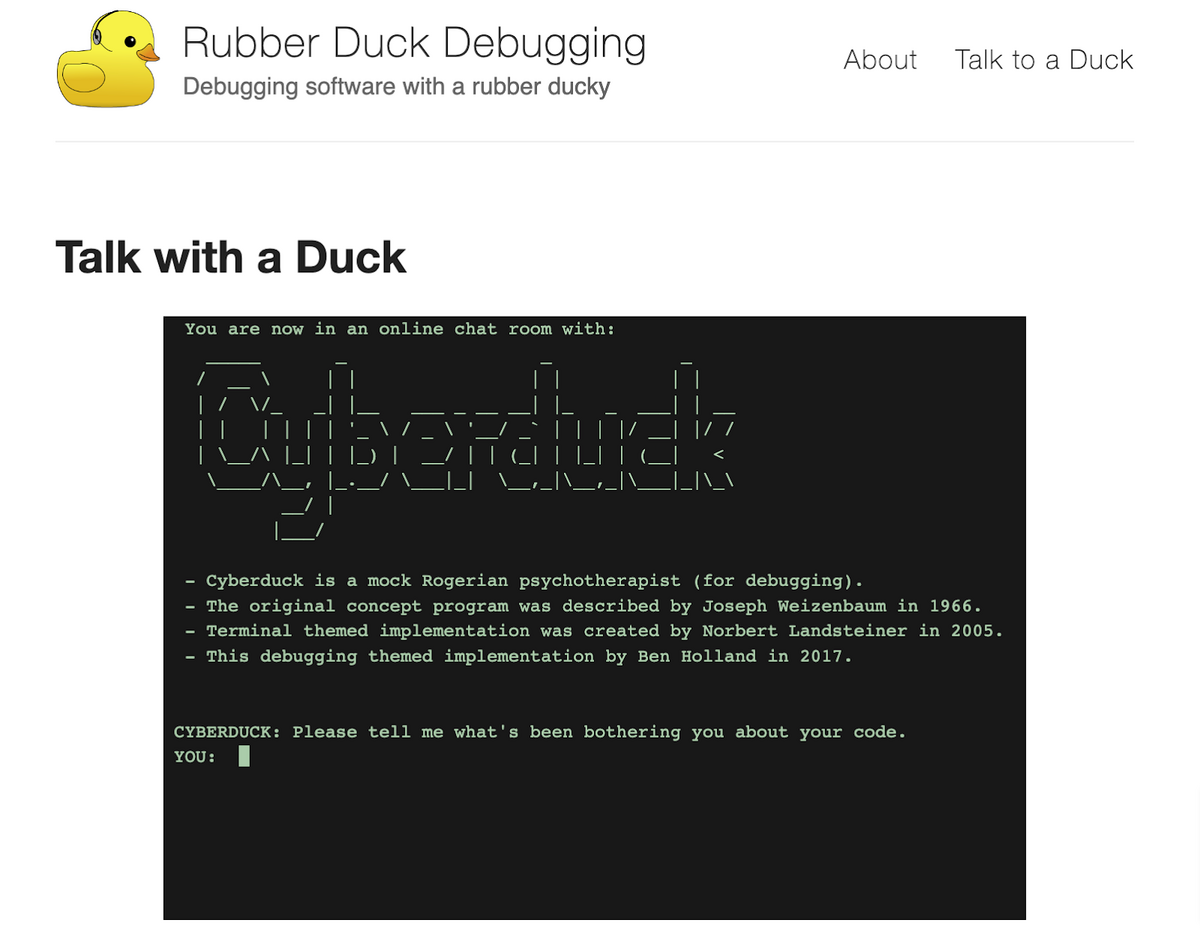
Cyberduck stands in for a physical rubber duck, encouraging you to explain your code and attentively listening to your dilemmas.
The software serves as a support system for developers who need to organize their thoughts—and what better way to do so than talking to a duck?
You’ll likely encounter similar errors in your software (e.g., your app crashing in several different locations).
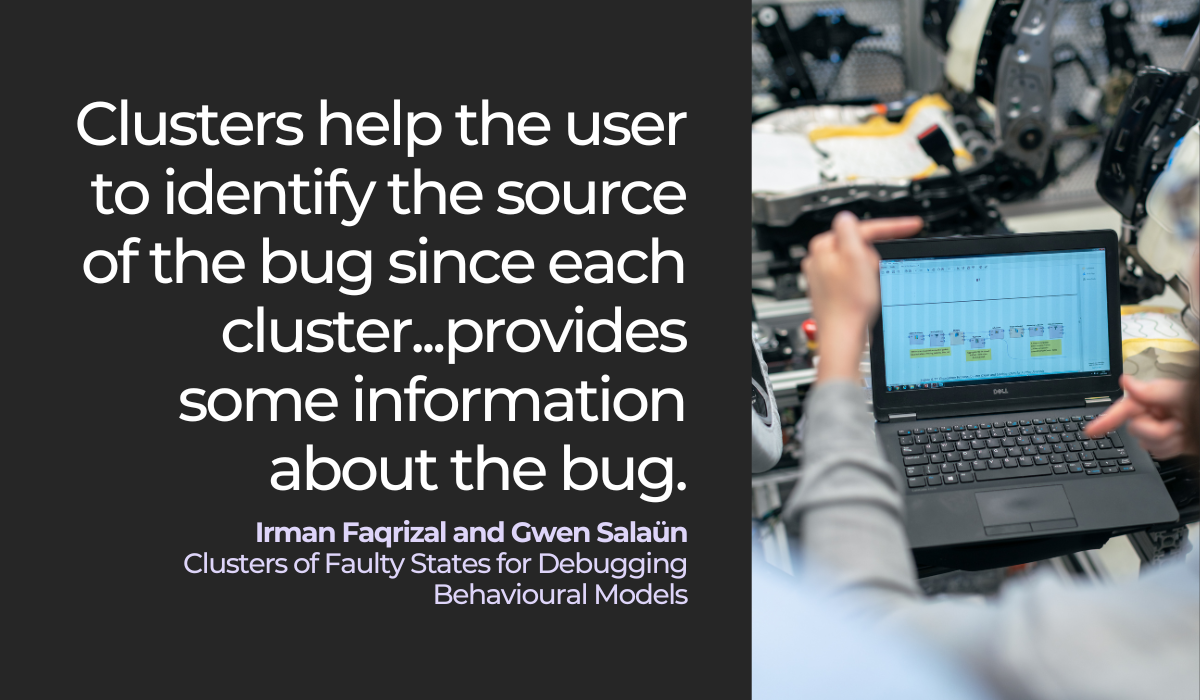
While debugging, it’s helpful to group these comparable bugs together—a practice known as bug clustering.
The reasoning is simple: by examining seemingly-related defects, you should quickly arrive at their resolution.
A recent publication can explain why:
Every bug in a cluster will contain some clue as to how to resolve the error causing that cluster.
Therefore, by analyzing each cluster’s characteristics, you should be able to arrive at the source of all these bugs.
Then, once that source is identified, you can resolve multiple errors with one simple bug fix. A single concentrated change in the code can fix an entire assembly of problems.
If you’re wondering what these clusters typically look like, the image below shows the most common varieties:
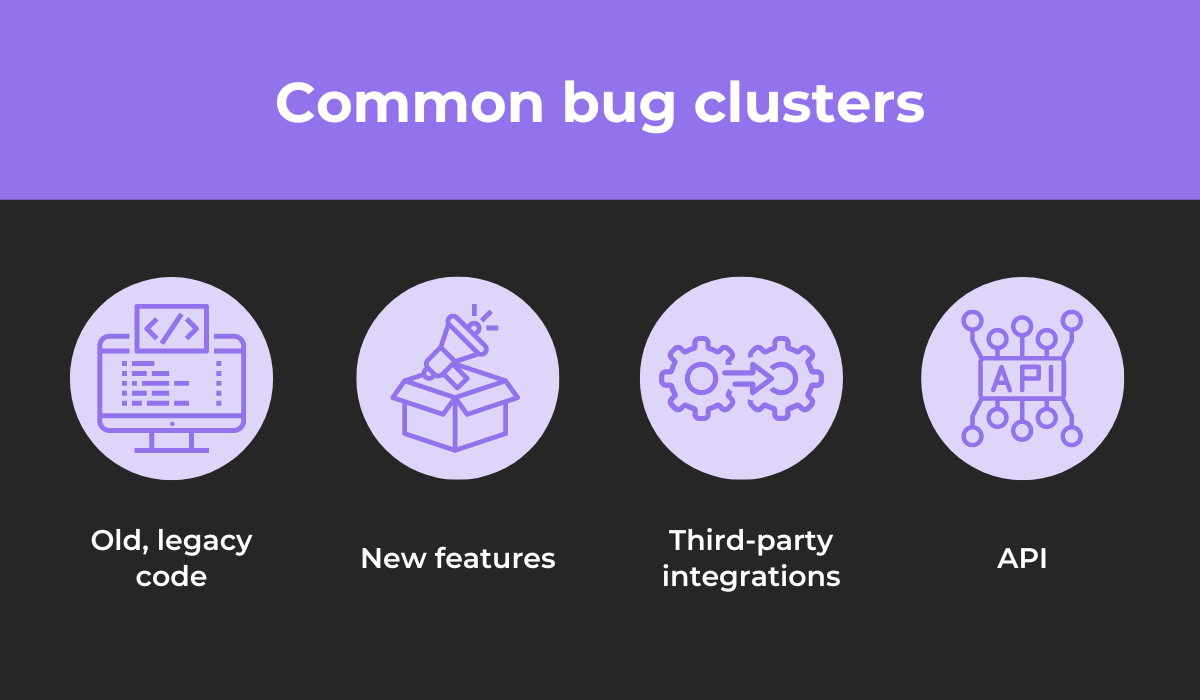
Related bugs typically appear in one of these four areas, as they’re the most variable, dynamic codebase sections.
If your Jira bug tracking integration won’t save defects and also hosts unresponsive buttons, the two issues are likely connected.
In the same vein, too-big images on your new login page might have something to do with the malfunctioning e-mail address autofill.
By clustering such similar defects together, you can easily assess your software’s errors and debug more efficiently.
Perhaps the most scientific debugging strategy, the cause elimination method employs deductive techniques to resolve software bugs.
The first step is creating a list of all possible reasons for the defect. They don’t need to be entirely rationalized—they’re just theories to help assess the situation.
Then, test each hypothesis one by one. As you analyze your codebase, you’ll eliminate possible causes as you go and should be left one with one sole possible reason.
If that remaining theory is vague, now is the time to refine it further. After that, you should be able to prove it and solve the software bug.
The image below visualizes the process:
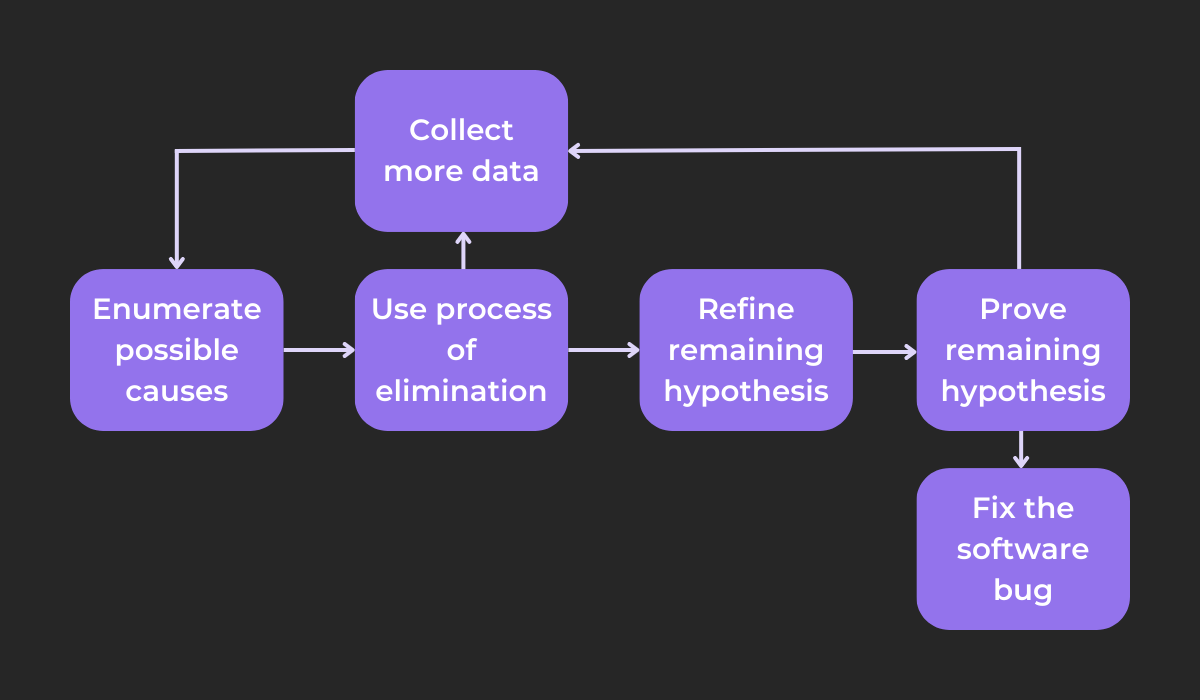
While eliminating possible causes, you might eliminate them all. In that case, you’ll have to collect more data and devise additional theories.
The same is true if you cannot prove your one remaining hypothesis—you’ll have to examine the codebase once more and start over.
Because this method is so scientific, it’s often highly efficient. Wisen Tanaka, a respected developer consultant, has noticed the same:

Although the method requires some preparation (writing the list of theories, testing them, etc.), this extensive, structured groundwork pays off later, guaranteeing speed.
With so many options available and all the information clearly laid out, the cause elimination method is often the quickest way to debug.
If you’re working in a smaller codebase, backtracking is your ideal debugging method.
To solve bugs via backtracking, start your debugging efforts where the program gives the incorrect result. From there, retrace your steps, mentally executing the program in reverse.
That way, you’ll determine the state of the software (or values of all its variables) during the preceding steps.
With this strategy, you should find the bug’s exact location: between where the program’s state was as expected and the initial starting point, which gave the incorrect result.
Equipped with this information, solving the defect should be much easier.
This topic was also discussed on a Reddit thread, with one user providing a great backtracking metaphor:
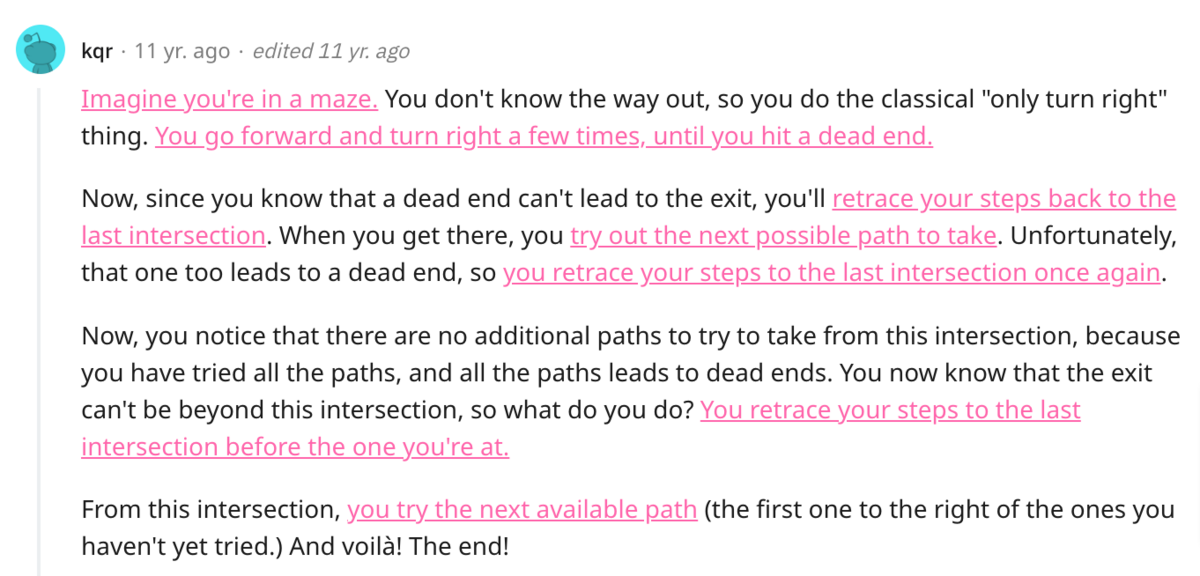
This is precisely how backtracking works—you try out all possible options until reaching the point where the software functions properly.
However, it’s worth noting that this method is most efficient when working with a smaller codebase when there’s less code to traverse.
For a real-life example of this technique, look at the visual below:
The code is backtracked from line 46 to line 43, and the printed values are entirely different at these two locations.
This then indicates that the reason behind the defect is between these two lines.
Thanks to backtracking, you’ll immediately have a huge clue to help solve the software bug.
Another code-heavy debugging method, program slicing divides your software into more manageable sections, therefore facilitating debugging.
The strategy is based on variables. First, find the lines of code relevant to a chosen variable’s value.
Then, remove all code irrelevant to that variable. You’ll have a clean program slice to concentrate your debugging efforts on.
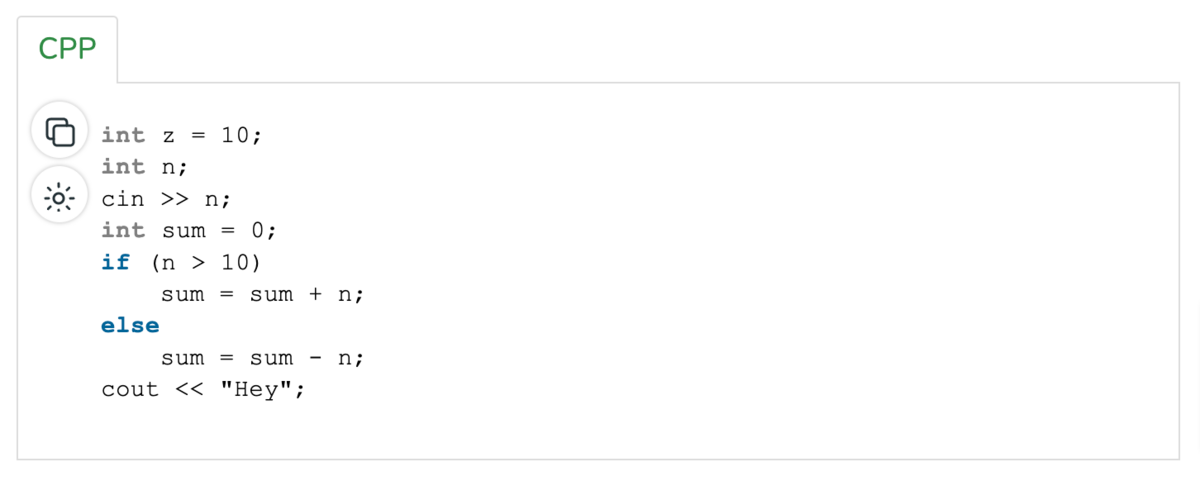
Consider the following code:
If sliced according to the variable sum, the result is:
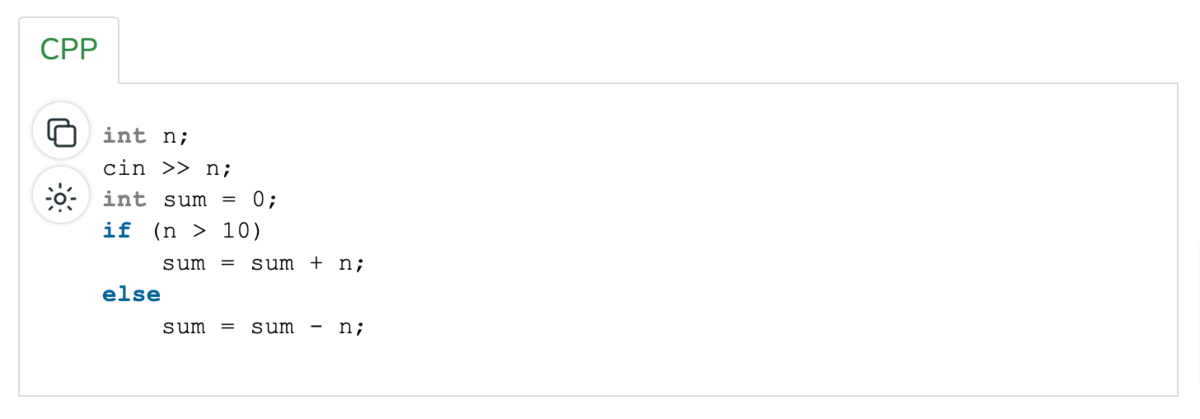
The code snippet is automatically smaller, making finding and resolving the bug more manageable.
This above code is called a static slice—a type of slice incorporating all statements that might affect a variable’s value, for any arbitrary program execution.
Its direct opposite is a dynamic slice. This slice variant incorporates all statements that actually affect a variable’s value, for a particular execution of the program.
Returning to our original code, let’s say the sum n is 22. Here’s the dynamic slice:
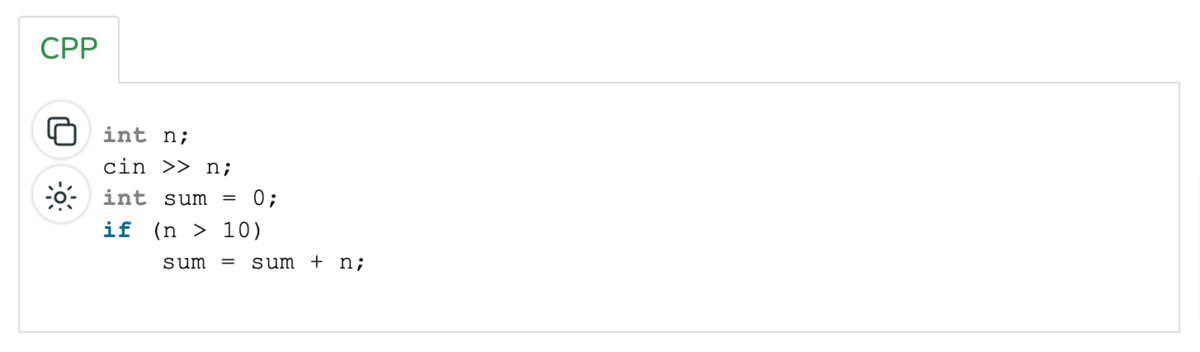
This slice differs significantly from the static version. In fact, since dynamic slices consider only one execution, they’re usually smaller than static slices.
The graph below outlines all the differences between the two variants:
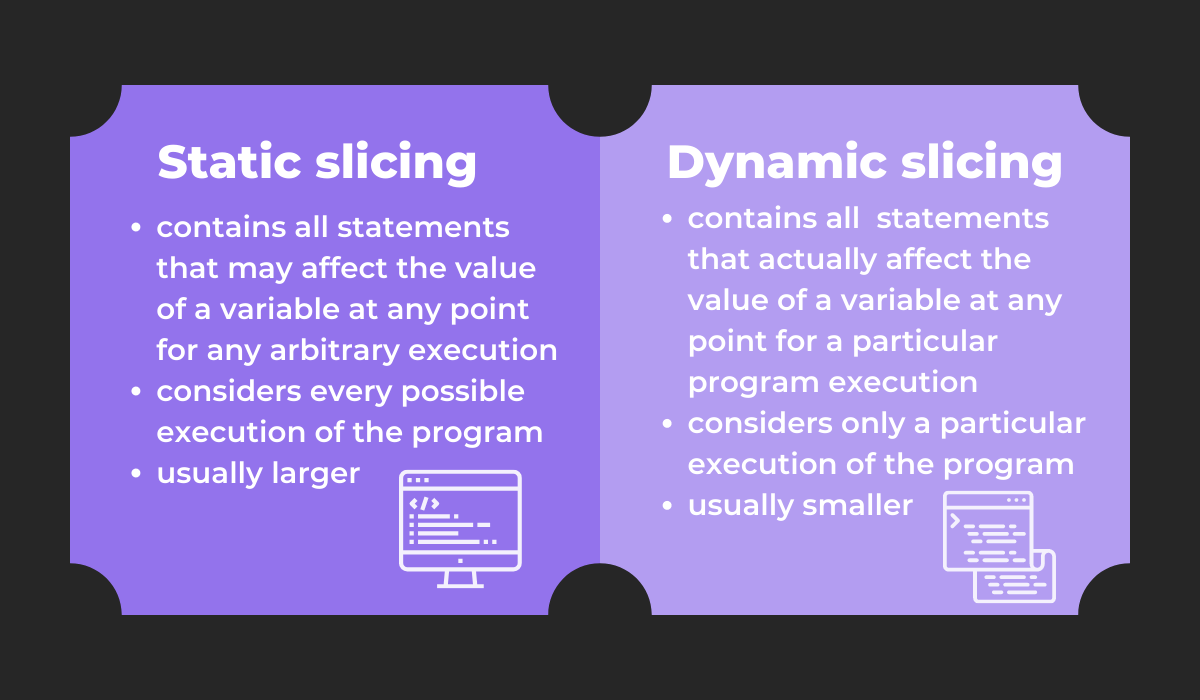
Both methods are useful debugging practices, each with its own benefits and recommended use cases.
If one program slice isn’t helping, try the other—one method will surely assist you.
Similar to program slicing, binary searching also dissects your code into sections. However, instead of focusing on variables, you’ll search the codebase in halves.
The first step is determining the part of the program hosting the bug—its surface area.
Once you know that, divide the affected code into two halves, and identify which half contains the bug.
From there, repeat the process, again splitting the code into halves and again diagnosing the half with the bug.
Then just repeat the procedure until the code portion is small enough it’s obvious where the defect resides.
The visual below depicts a simplified representation of the process:
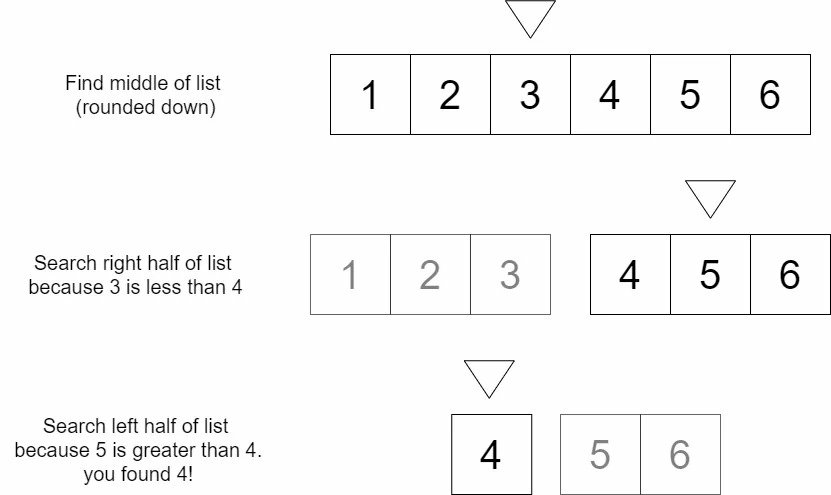
The list is cut in two until the exact numeral is located, applying the same principles used in binary searching.
To facilitate this debugging method, you can also utilize a specialized command: git bisect.
First, tell the command a bad commit (containing the bug) and a good commit (functioning correctly). Here’s some sample code for those operations:
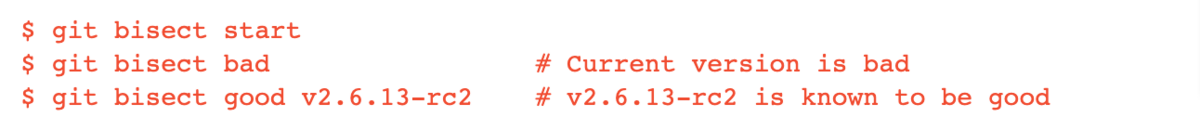
Using this input, git bisect selects a commit between the given endpoints and asks for its status (good or bad).
As you provide such details, the command narrows down the range until locating the exact commit that caused the bug.
With this command, binary searching will be greatly facilitated, and you’ll locate the defect in no time.
Last but not least, static analysis is our final, and perhaps most theoretical, debugging method.
When using this strategy, developers examine the code in a static environment—without executing the program or running it through any compilers or debuggers.
While doing so, they also compare the code against coding rules and best practices.
By evaluating how compliant the code is to these suggested strategies, they can then frame hypotheses for possible reasons behind software bugs.
For example, this is a C coding standard:
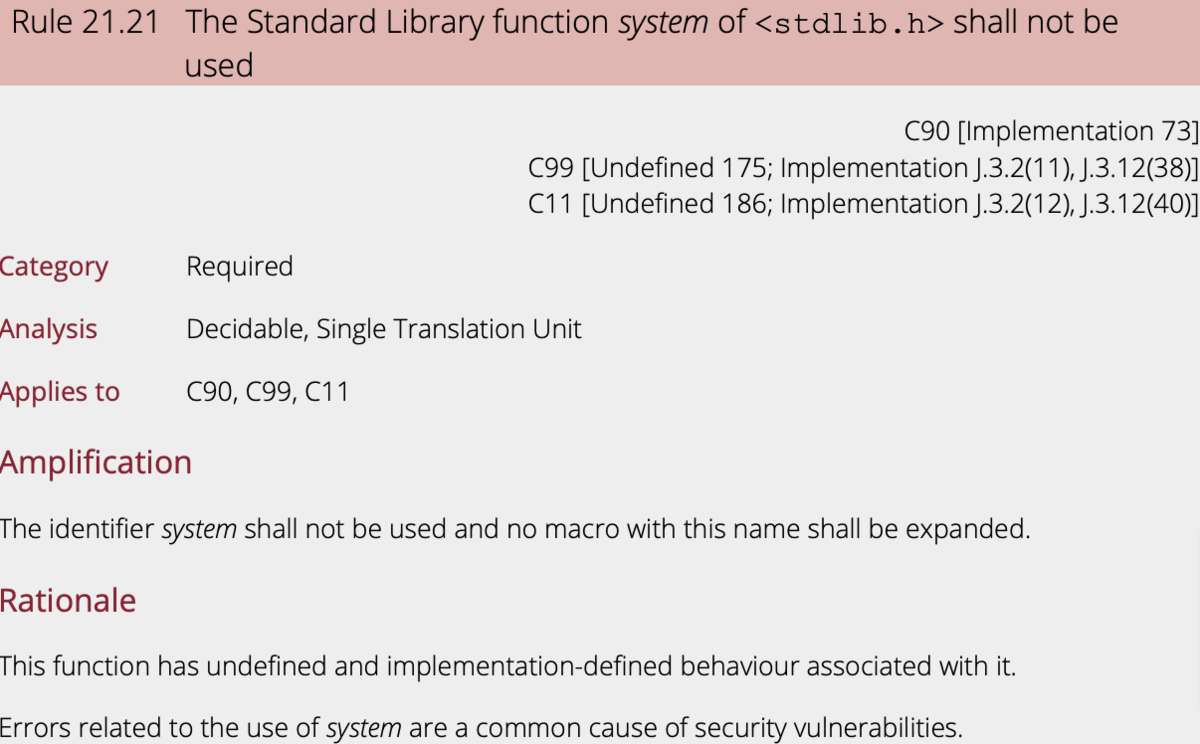
Seasoned developers will know such rules like the back of their hands and can scrutinize the codebase for any deviations from these guidelines.

Capture, Annotate & Share in Seconds with our Free Chrome Extension!
By examining the code against these suggestions, they’ll notice non-standard code and probably find the reason behind software bugs.
To facilitate these efforts, there are several static code analyzer tools available. Here’s one example:
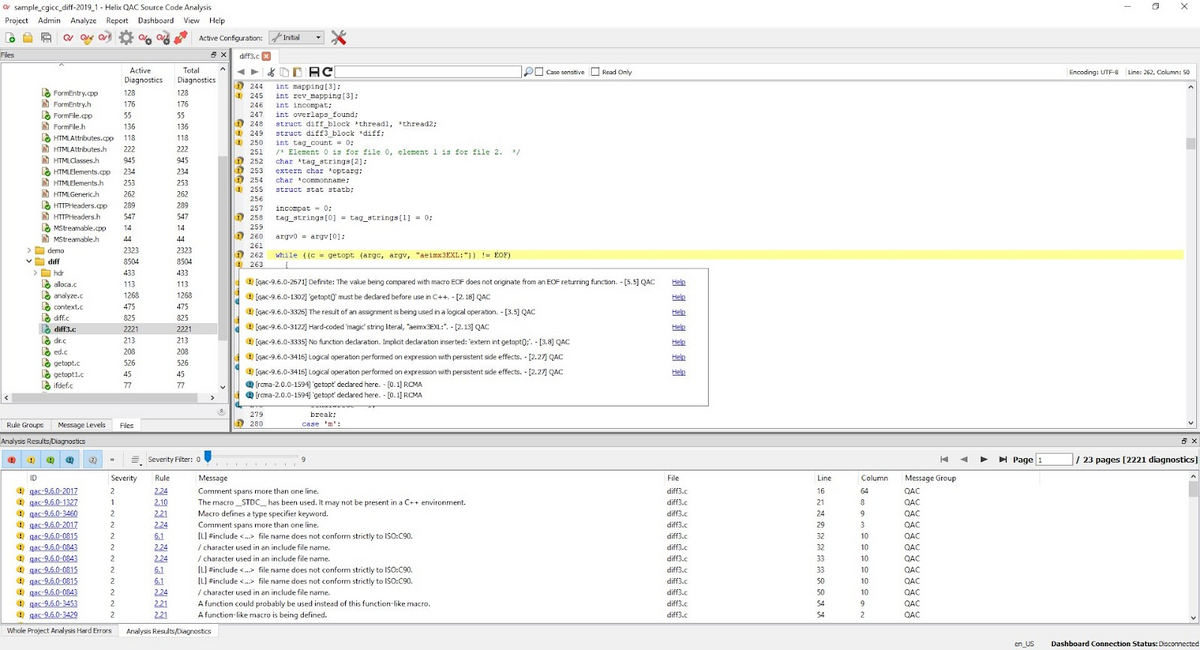
This screenshot displays an in-depth code analysis courtesy of Helix QAC. The tool flags down unrecommended coding practices, highlighting any code that could be further improved.
For instance, here Helix QAC cautions against using the macro _STDC_, and how it might not be present in a C++ environment. Such a slip-up could very well be the cause of a bug.
Therefore, with in-depth static analysis, you can easily uncover possible reasons for software bugs and then solve them more efficiently.
Solving software bugs should instantaneously become easier by utilizing a structured, organized debugging method.
Except for the brute force method, each debugging strategy employs logic and a scientific approach to resolving defects.
Instead of haphazardly poking around the code, you’ll have defined guidelines to guide you.
As a result, you’ll become much quicker at fixing these errors and, therefore, faster at releasing software. The entire development process should accelerate.
Try out a couple of approaches, and see which strategy works best for you. Each method has its benefits and is sure to help out your debugging efforts.
Check out what a full-service partner to the world’s most ambitious companies has to say about it.
From internal bug reporting to production and customer support, our all-in-one SDK gets you all the right clues to fix issues in your mobile app and website.
We love to think it makes CTOs life easier, QA tester’s reports better and dev’s coding faster. If you agree that user feedback is key – Shake is your door lock.
Read more about us here.

Add to app in minutes

Doesn’t affect app speed

GDPR & CCPA compliant

Unexpected things pop up
Just like bugs in your app or web 🐛 Fix them now with just one reporting tool.