
Recommended
4 app logging best practices to follow

When faced with a seemingly never-ending record of app events, it’s hard to gather the motivation to examine, filter and dissect those exact app logs that could help you improve the application.
Such extensive log management requires well-oiled organization and firmly-decided procedures, and those can easily fall to the wayside in light of more exciting prospects.
Nevertheless, when done correctly, app logging can deliver countless advantages.
That’s why we’ve written this article—to show you why you should perform app logging and how your organization would benefit from it.
Table of Contents
If there’s anything you want to learn about your application, start by examining the app logs.
A comprehensive record of all events in your application, app logs note every action related to software performance.
You’ll find user sign-ins, system crashes, data requests, and countless other events.
Adam Wiggins, the CEO of Ink & Switch, explained the significance of such continuous data quite well:
Each running process writes its event stream… During local development, the developer will view this stream in the foreground of their terminal to observe the app’s behavior.
To the well-trained eye, all these incremental event streams come together to paint a picture of the app’s complete behavior.
Developers can use this data to infer insights regarding the app’s overall usage.
For example, consider the following log:

This snippet shows an Apache access log, a great resource for analyzing app usage.
The primary resource here is the timestamp. By noting the time of all your access logs, you can deduce when users use the app most often.
Then, after identifying these peak times, it’s the perfect opportunity to configure your infrastructure to be more robust at these times, bolstering it to meet the demand of such connections.
With this strategy, you’ll significantly reduce the dangers of the app crashing under higher traffic.
Similarly, you can also discover how long it takes to execute procedures. Simply consult the log for the action’s starting and ending timestamp, and you’ll know the process’s execution time.
From there, verifying if the duration complies with company standards is easy.
In fact, you can even use this strategy to measure latency.
Look at the excerpt below:
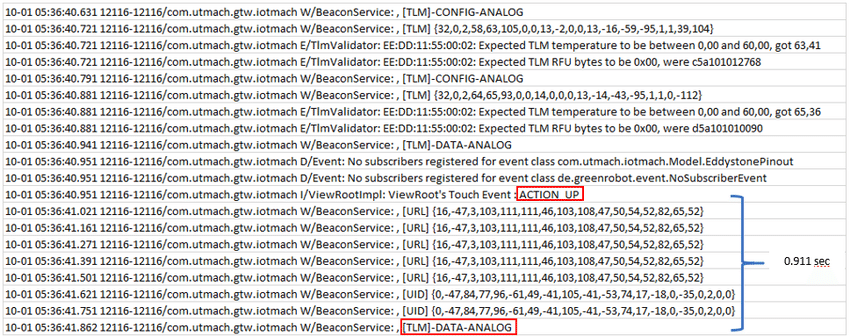
This is an Android log, with the ACTION UP message indicating when the user pressed the button. It took 0.91 seconds for the software to respond—a fairly rewarding result.
With this method, you can also check your application’s response time. Consequently, the logs will verify if your software is fast enough to fulfill the end-users’ expectations.
This is a vital usage metric, as customers frequently abandon slow apps.
However, while these methods are helpful, manually collecting app usage data from logs can be challenging.
Consequently, it’s worth investing in a log management tool such as Log Analyzer to help you.
This resource offers a powerful search engine that can filter the exact log data you’re looking for.
You won’t have to slog through countless logs looking for user login events—instead, these events will be neatly presented to you.
Here’s a preview:
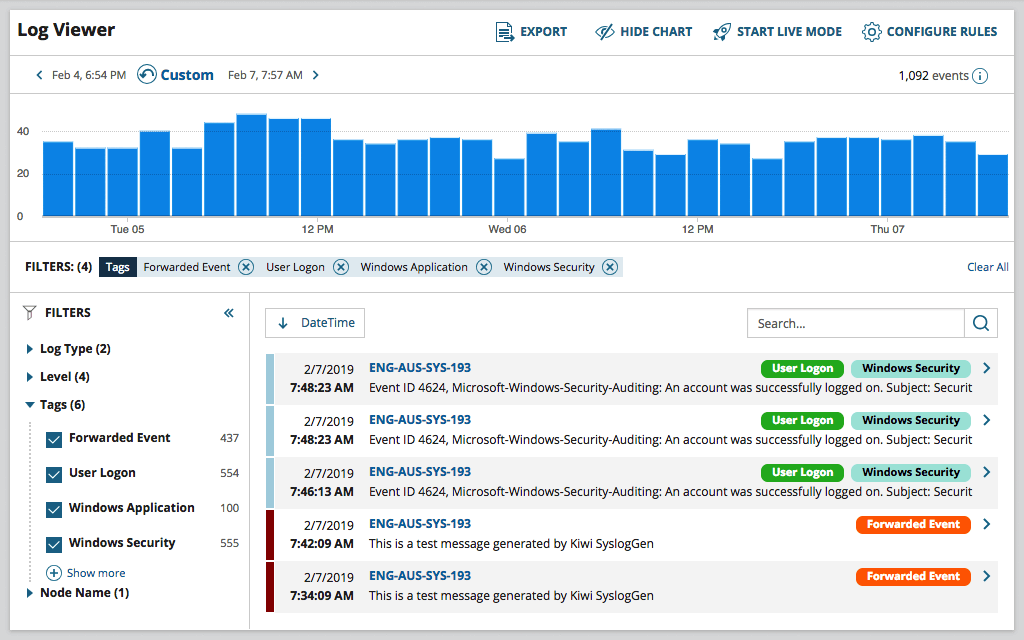
The logs are sorted based on their characteristics, categorized into color-coded categories such as User Logon, Windows Security, and similar.
With these tags, you can easily pinpoint the events important to you and carefully examine their data to obtain more thorough and nuanced insights into the app’s behavior.
Since app logs capture every application event, they’ll also record all malfunctions.
Let’s say your application has a memory leak or loses network access—you’ll find these events in the app log.
Furthermore, because logs are so detailed, they’re also the perfect place to uncover additional details about these errors.
Instead of guessing the cause of the bug, you’ll find tangible clues inside the app log.
For example, look at this log:
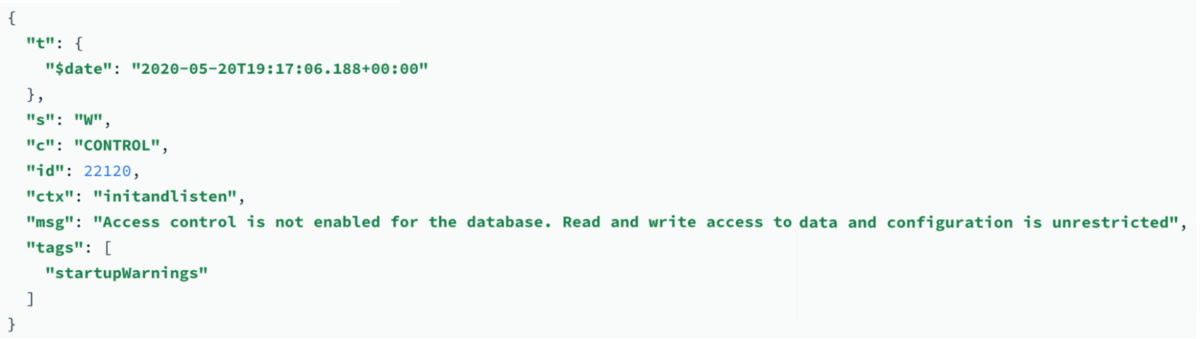
The log warns about a startup, stating that access control is not enabled for the database.
This is precisely the type of information you’ll appreciate while debugging. If you’re tackling any bugs that occur during startup, they’re likely related to this irregular incident.
You immediately have a clue to solve the error.
Consequently, examining the app log for such strange events is a good idea, as they’ll likely assist your debugging process.
In fact, by using log levels, you can even filter out particular logs that might be useful for bug-fixing. Log levels are tags that indicate urgency and are a way of prioritizing your app logs.
The graph below shows the most common categories:
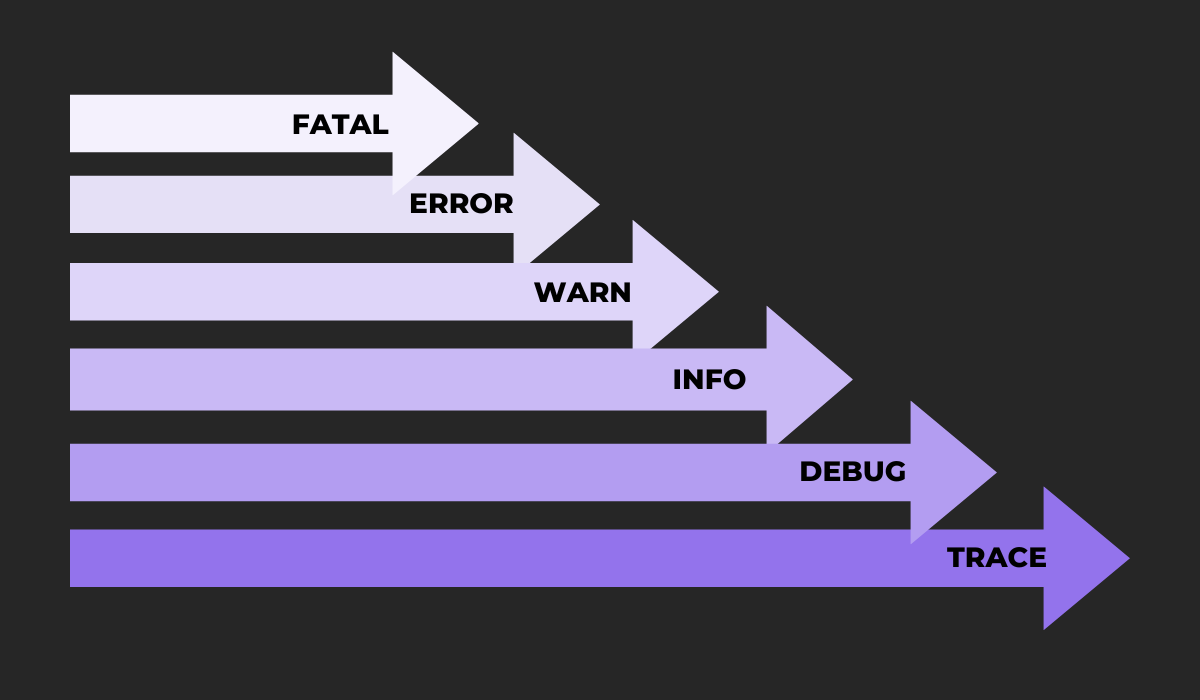
The three top levels (FATAL, ERROR, WARN) indicate a problem inside the application.
These levels signal the presence of bugs that require your attention and are a surefire way to find issues in the software.
For instance, our previous MongoDB log example would be categorized under WARN.
However, you should also pay attention to the DEBUG logging level.
This log type delivers granular, diagnostic information you won’t need in day-to-day activities but would facilitate debugging procedures.
Here’s a great example:
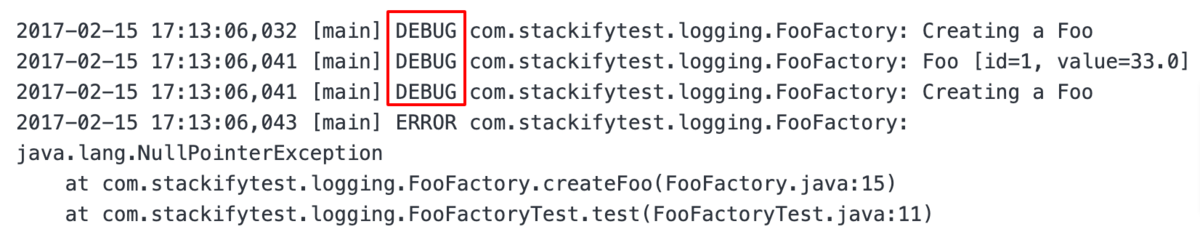
Whereas the ERROR log captures an exception, the DEBUG logs give information about the exception.
We learn how the object was logged in terms of ID and value—a handy clue to resolving the error.
App logs clearly provide detailed insights that assist with correcting software issues.
Consequently, attaching them with every bug report is a good idea, as they might contain the clue to solving a pesky problem.
That being said, manually including app logs in each bug report can be pretty time-consuming.
As such, it’s worth investing in a bug reporting tool such as Shake, as these resources usually automatically retrieve the relevant app logs.
For example, with Shake, simply shake your device, and a bug report will be instantly generated, complete with all app logs.
Here’s a preview:
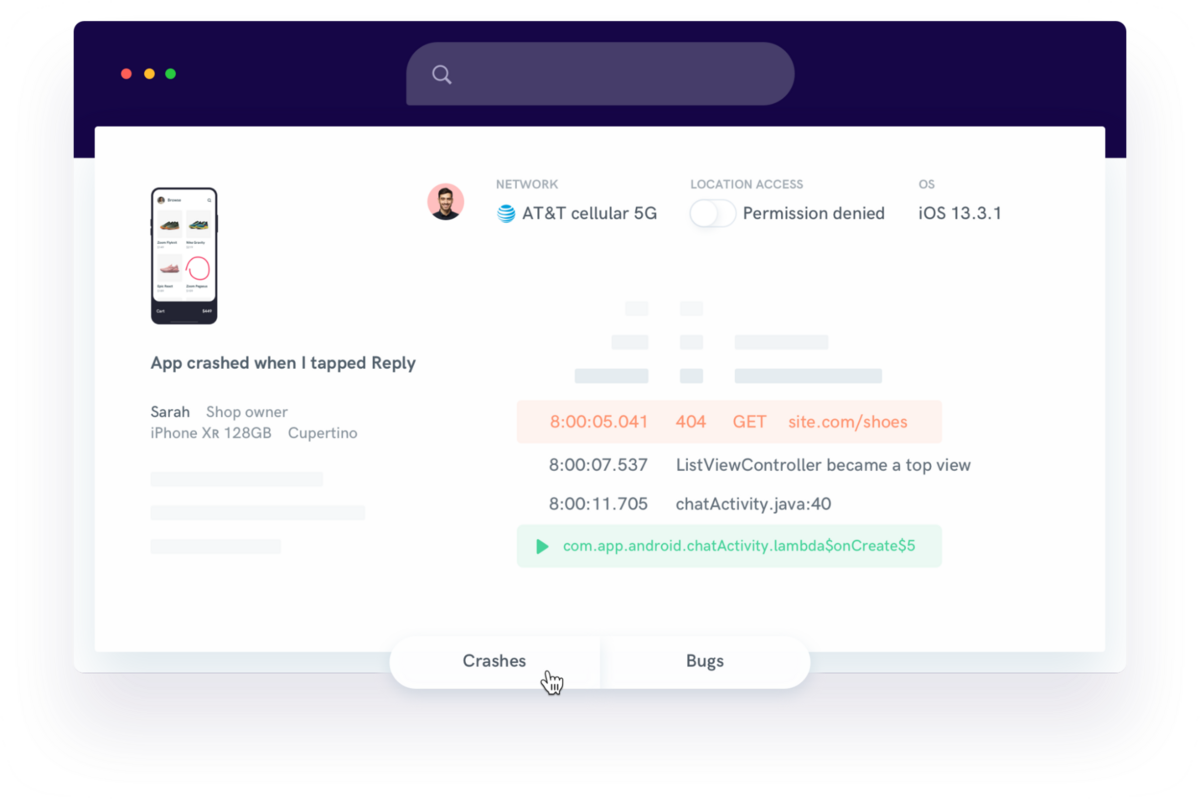
In addition to user activity and network details, Shake also automatically includes app logs in its bug reports.
That way, your developers will have a clear overview of all the bug details and should solve the issue in no time.
No matter how skilled your developers are, there’s always a chance your system will experience an outage or unplanned downtime.
When these incidents occur, there are four crucial metrics commonly employed to gauge how well you respond to these roadblocks.
They’re presented in the visual below:
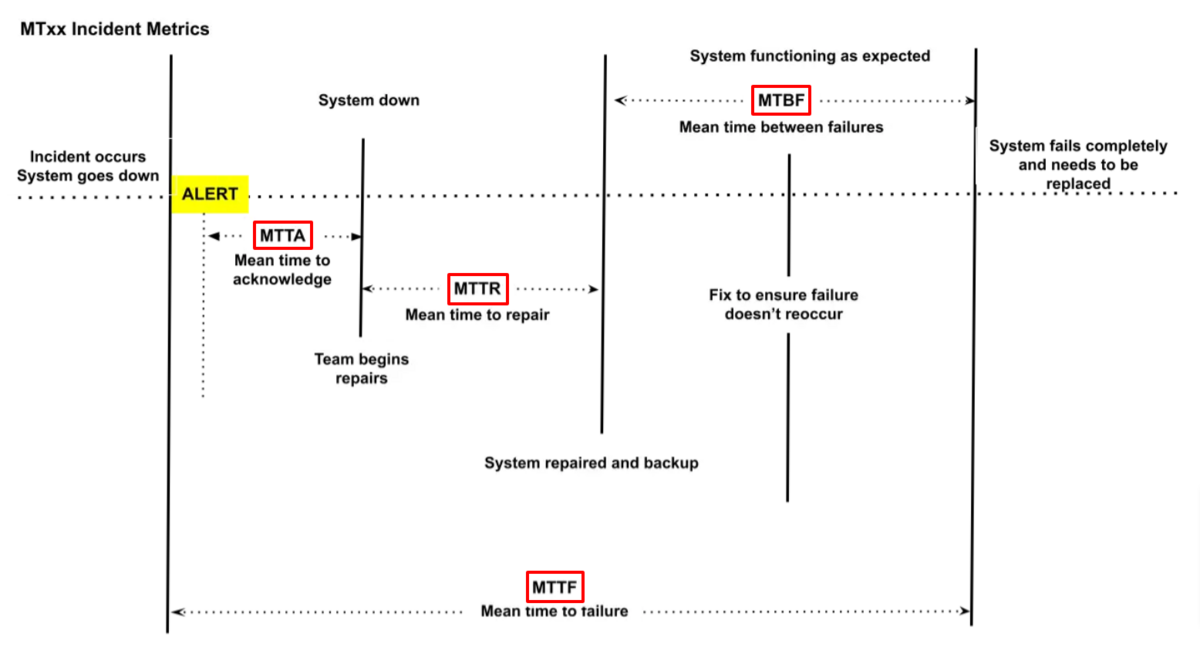
The graph displays the metrics’ full names and their relation to the outrage alert. Further on, we’ll examine each individual metric in more detail.
However, generally speaking, you want the gathering of these metrics to be brief. The shorter the measurement, the sooner your software will be back online.
One surefire way to reduce these incident metrics is to leverage your app logging intelligently.
By routinely analyzing your logs, you’ll notice unusual behavior indicative of errors and nip future potential problems in the bud.
For example, if you see an increased amount of failing HTTP status codes, this is an incentive to immediately investigate the root cause of the issue.
By working on the problem as soon as it occurs, incident metrics should decrease.
Peter Christian Fraedrich, Ally’s Director of Digital Site Reliability Engineering, offered similar advice:
Collect everything, alert on four things, correlate everything. We can take this “shortcut” because if there’s a problem — a real problem — on one of our app hosts, the symptoms will bubble up into one of our four key metrics.
By continuously examining app logs and identifying irregularities, you’ll reduce each incident metric.
Our previous example regarding noticing heightened HTTP failure status codes would, for instance, be ideal for reducing MTTA.
Here’s the formula:
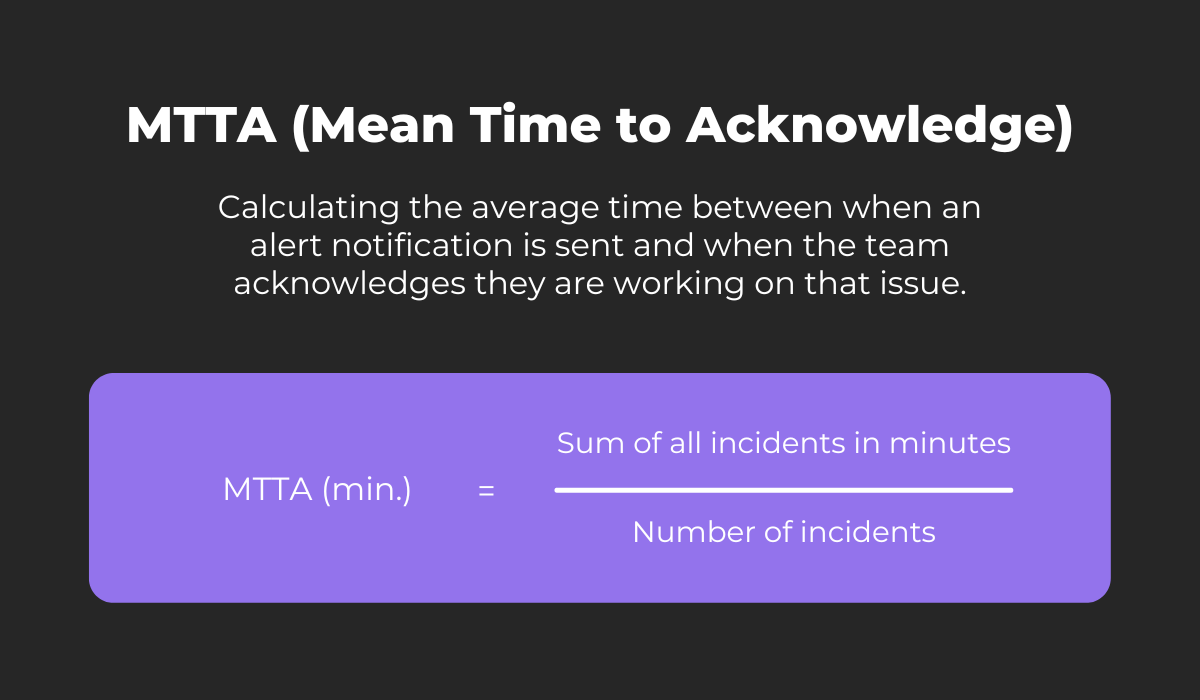
By preemptively addressing failure status codes, incidents should take less time and occur less often. Consequently, the MTTA will fall.
It’s a similar story with MTTR. Consider how that metric is calculated:
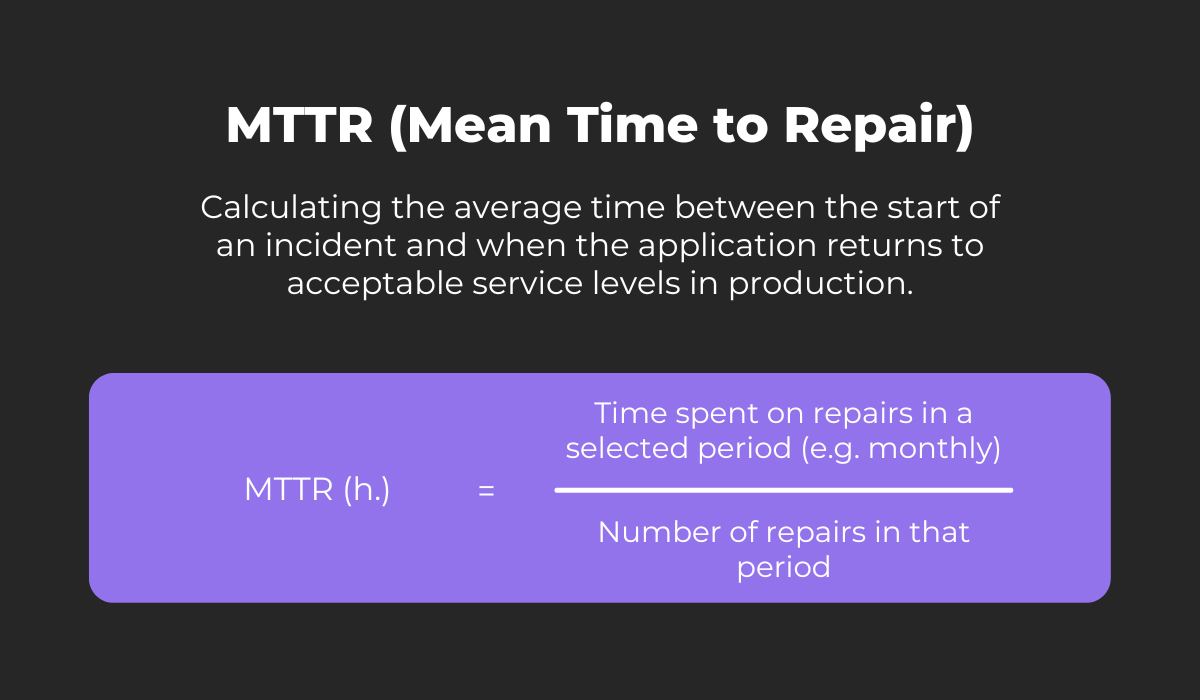
With effective app logging, you could easily filter out your most vulnerable hosts and then increase surveillance for those components.
That way, if an incident occurs, you can immediately devote yourself to these endangered hosts.
Yet another metric logs help reduce is the MTBF.
Here’s how to calculate it:
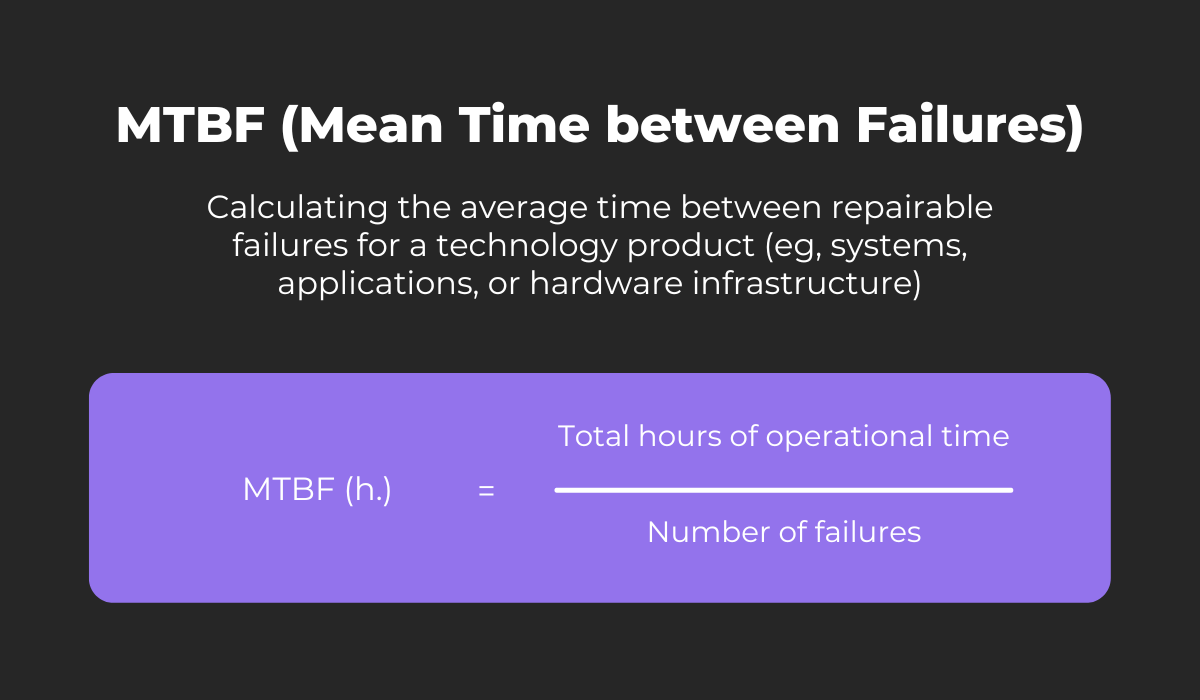
With MTBF, you calculate the average time between software failures, making it instrumental for gauging failure frequency.
Logs are hugely helpful in improving this metric, as they capture details about the reason for these failures.
By leveraging this data to proactively address the root cause, you can prevent such failures from happening again.
Finally, our last incident metric is MTTF. This is how you calculate it:
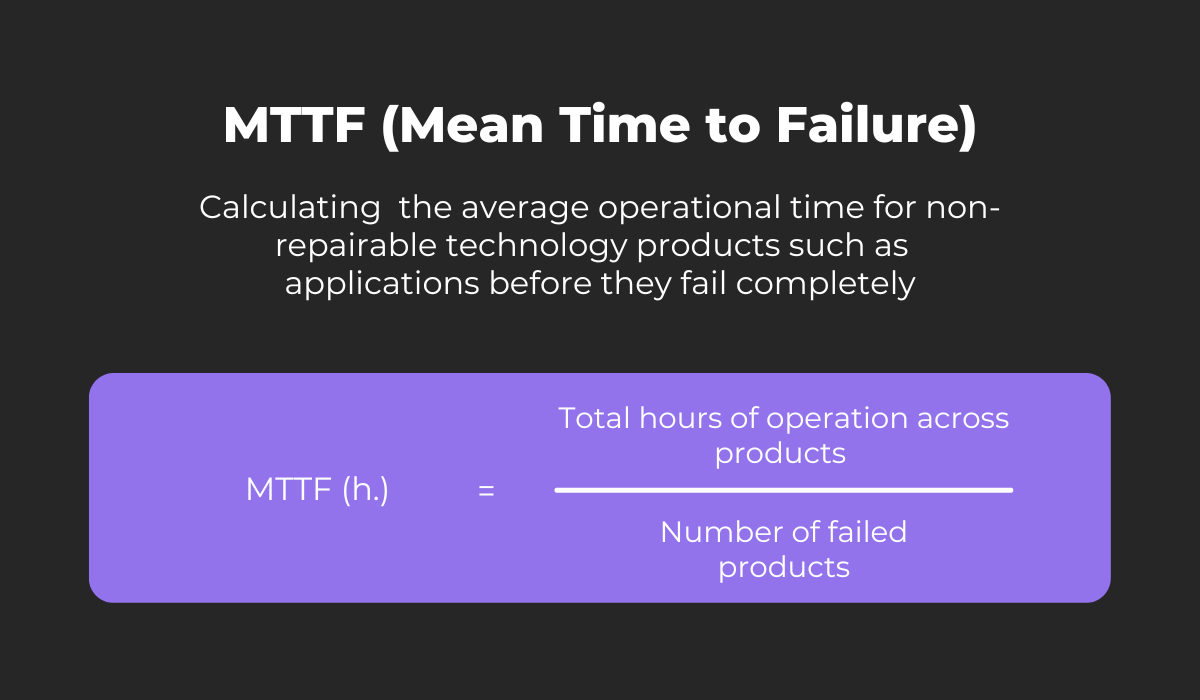
MTTF signifies the average time until an application fails beyond repair, making it perhaps the most critical metric to address.
To reduce this metric, try assessing why your previous products failed and then identify warning signs in the logs signaling the same scenario happening again.
With this strategy, you should decrease your MTTF.
As you can see, app logging can significantly reduce all incident metrics, guaranteeing a better-performing application.
Large-scale software is rarely built by one individual. A single developer might design a fun, rudimentary app, but enterprise software is usually the result of a team effort.
However, collaboration between these departments can be challenging, considering everyone’s responsibilities and business processes.
This is another situation where app logs come in handy—they help keep everyone on the same page.
App logs function as a single source of truth for everything happening within the application.
Therefore, if anyone has questions about the software’s behavior, the logs will provide a definitive answer.
Generally speaking, app logs have three different audiences. They’re illustrated in the visual below:
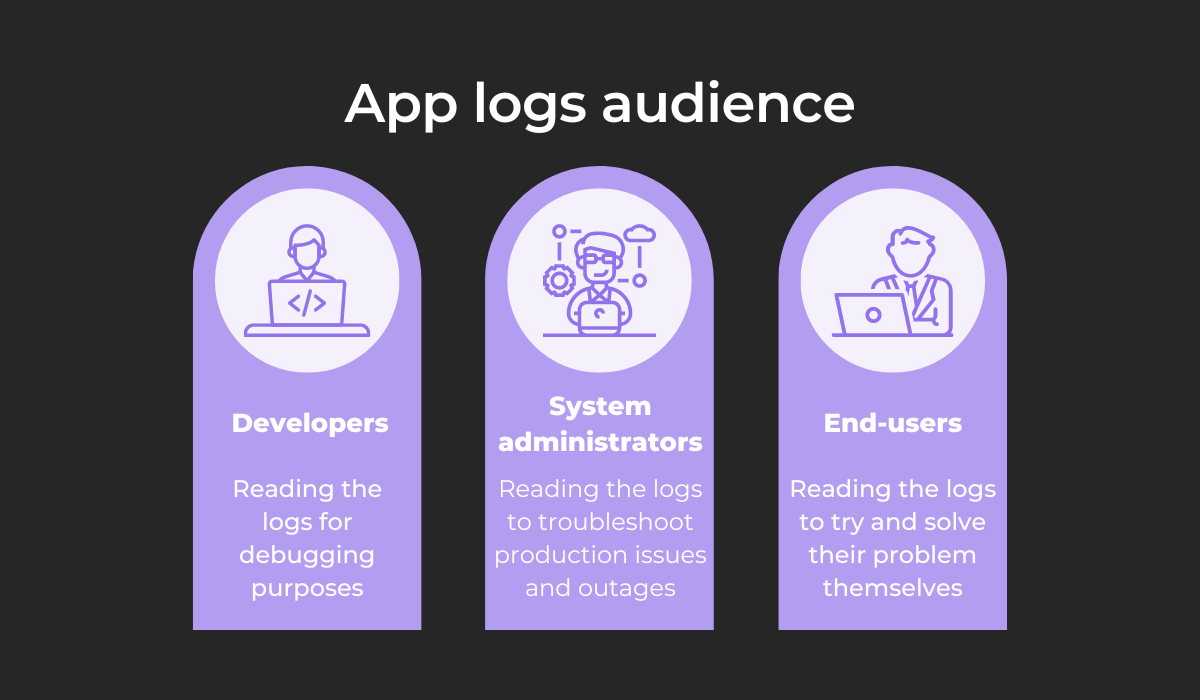
Despite their different intentions, each group will eventually examine the app logs.
Consequently, these records are clearly a trustworthy source of information for multiple parties (and multiple needs).
This topic was also discussed in a Reddit thread:
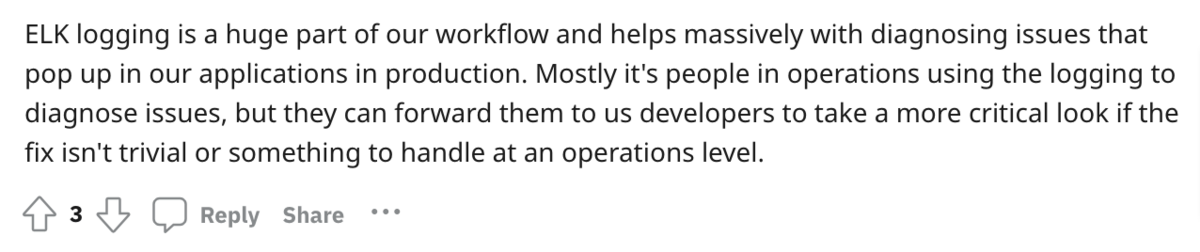
As per this developer’s testimony, the app logs serve as the central communication channel between Development and Operations teams.
When solving issues, the first step to collaboration is consulting the app logs.
To facilitate this log analysis and cooperation, try adhering to a defined logging framework.
That way, you’re not writing arbitrary, haphazard messages but following a consistent format everyone can easily follow.
For example, logback is a common logging framework, popular for its easy configuration option.
Here’s an excerpt from its guidelines:
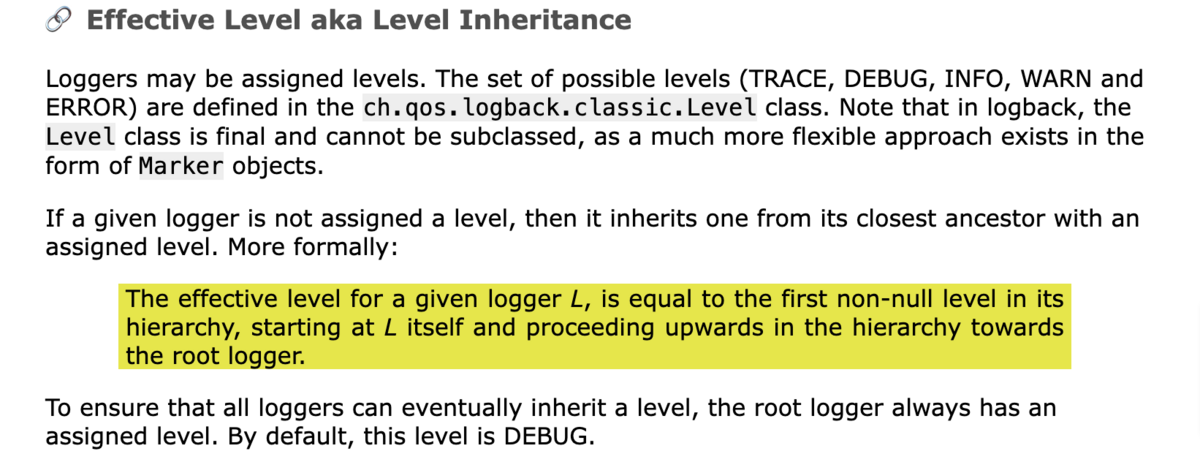
This logging framework omits the usually-included FATAL level.
Therefore, when using this framework, you bypass some ambiguity and encourage developers to examine all error-related logs equally.
In other words, no issues will be unjustifiably classed as FATAL. Instead of these so-called urgent issues demanding developers’ attention, all problem logs will be treated equally.
Consequently, developers should have a broader worldview when troubleshooting the software.
Furthermore, all app log readers will know not to search for FATAL logs but to just rely on the ERROR level.

Capture, Annotate & Share in Seconds with our Free Chrome Extension!
If you want, you can also use the app logs to note any sensitive, internal information.
That way, employees won’t constantly contact one another to extract this data—it’ll simply be stored in the logs.
However, this shouldn’t be written in plain text. Instead, it’s worth employing tokenization practices.
This entails attaching a reference to a log record’s raw value and exchanging sensitive data for a token.
Here’s a visualization of the process:
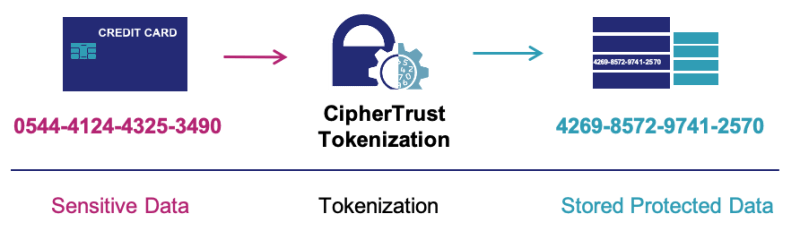
With this approach, all application references will become tokens after confidential data is stored in a data privacy vault.
Utilizing such a tokenization system allows your app logs to remain the ultimate single source of truth, including even sensitive data.
Your employees won’t have to contact others to access private information. Instead, it’ll be safely noted in the logs, along with everything else.
App logs provide a detailed, comprehensive look into your application, delivering countless insights regarding app behavior and usage you can’t find anywhere else.
Consequently, debugging should be greatly facilitated, your incident metrics will likely decrease, and you’ll have a single source of truth to rely on.
With all this newfound knowledge, your developers will have the perfect environment to optimize your application and improve it as much as possible.
You’ll be significantly empowering their performance.
As such, if you haven’t yet ironed out your app logging process, consider dedicating some time to it—your efforts are sure to pay off.
From internal bug reporting to production and customer support, our all-in-one SDK gets you all the right clues to fix issues in your mobile app and website.
We love to think it makes CTOs life easier, QA tester’s reports better and dev’s coding faster. If you agree that user feedback is key – Shake is your door lock.
Read more about us here.

Add to app in minutes

Doesn’t affect app speed

GDPR & CCPA compliant

Unexpected things pop up
Just like bugs in your app or web 🐛 Fix them now with just one reporting tool.