What are the best app session replay tools?
Key Takeaways:
A bug report lands in your inbox. You have the logs and crash reports, but that’s not enough to figure out why it happened.
So your team wastes sprint time chasing symptoms instead of solving the real issue.
But it doesn’t have to be that way.
At least not if you incorporate session replay into your process.
This analytics technique will help you speed up debugging because it shows exactly what happened in a session gone wrong.
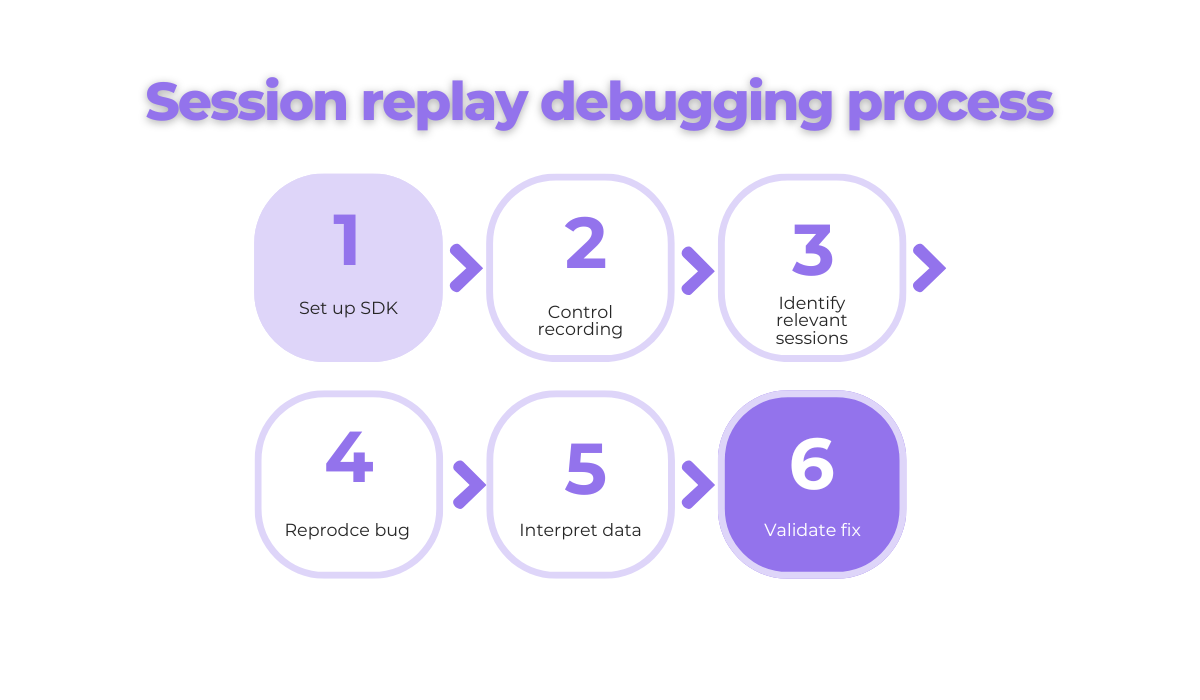
This guide will walk you through using session replay, from setup to fix validation, so you can resolve those pesky bugs faster and with more clarity.
Table of Contents
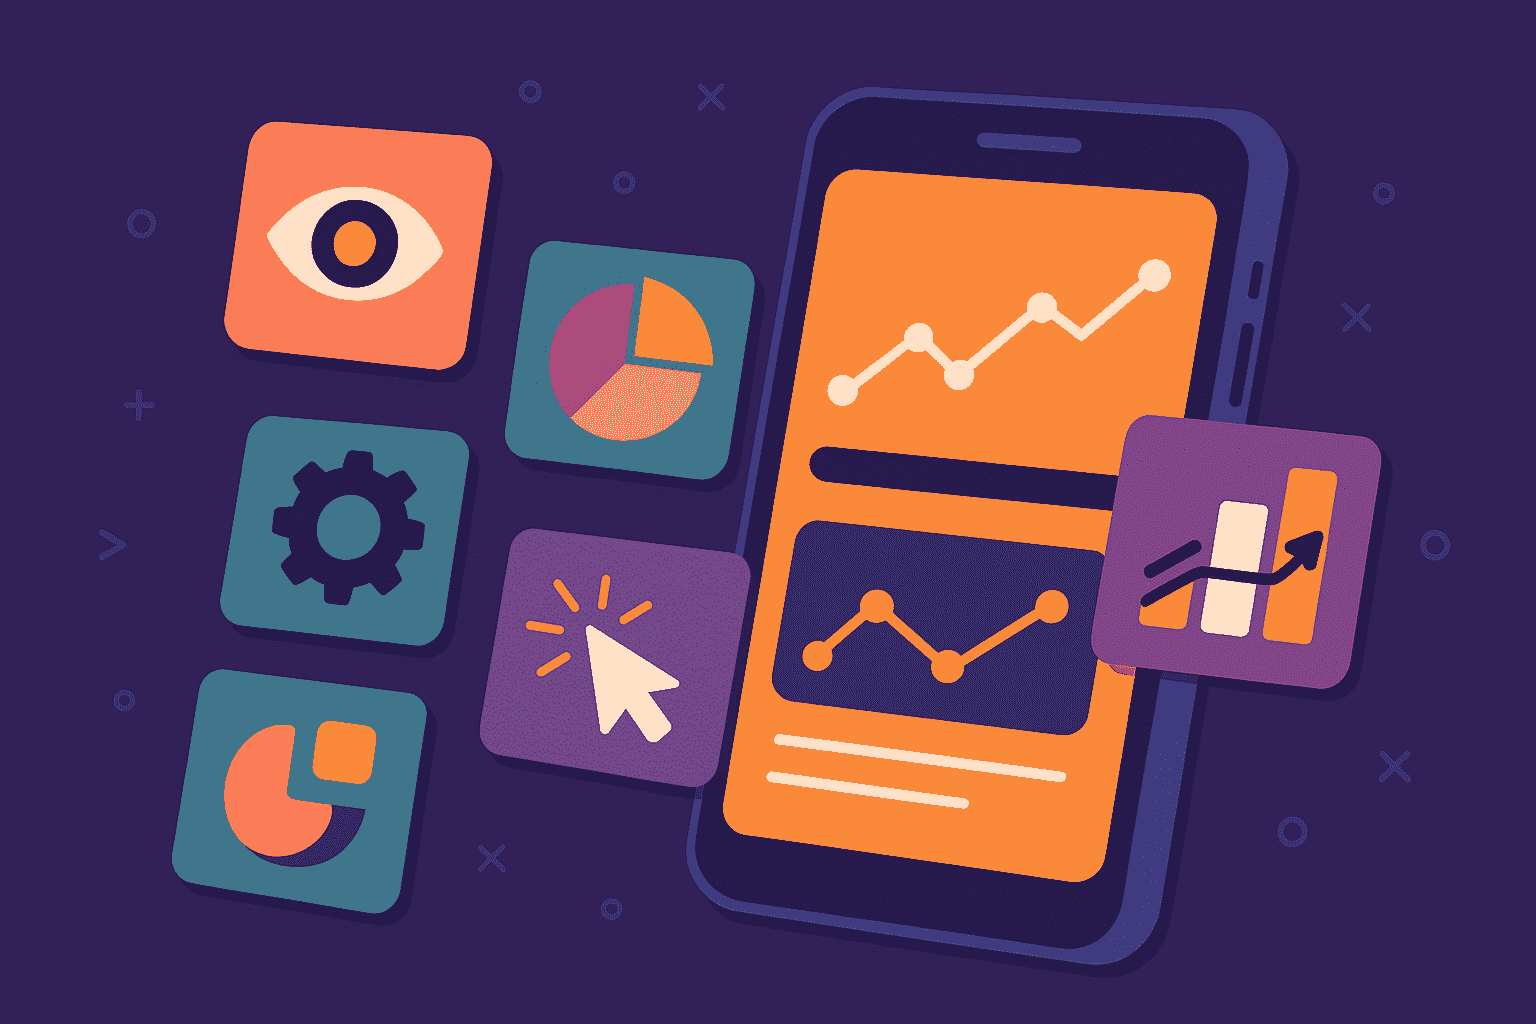
First, let’s get technical.
You’ll need to implement a session replay Software Development Kit (SDK) into your app so you can get access to user data and enable functionalities.
However, the exact process depends on the platform and tool.
If you’re using Shake’s session replay, it requires no additional setup.
You can either enable or disable it. This enables or prevents data being sent to your dashboard.
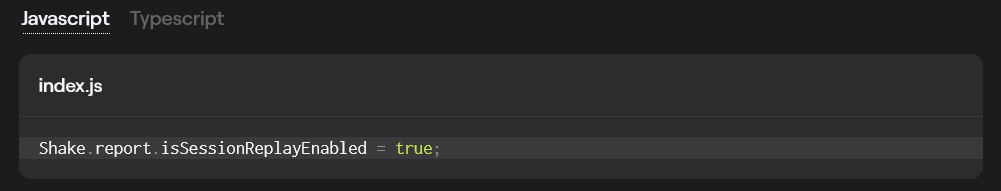
Also, when a bug happens, you get the session replay automatically attached to the bug report.
That’s great news for your developers because they get the big picture without manually collecting info about the bug.
On the other hand, if you’re using Datadog, you’ll need to set up Datadog RUM Browser Monitoring first.
Start by creating a RUM application, generating a client token, and initializing the RUM Browser SDK.
After you’ve initialized the SDK, set up mobile session replay for iOS or Android.
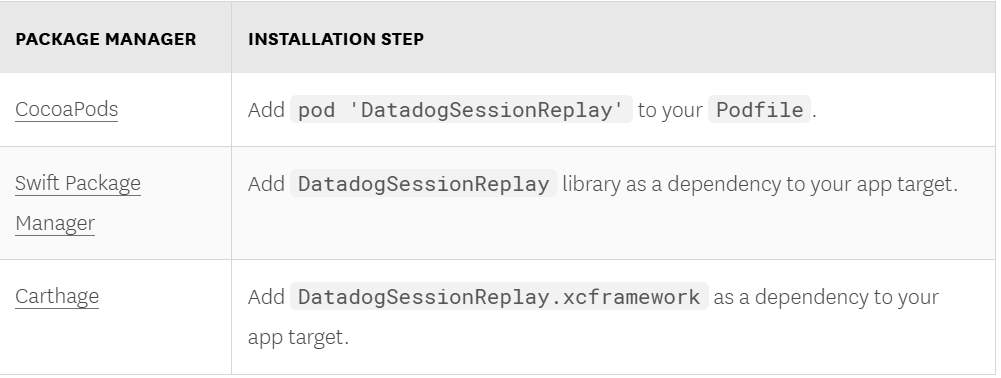
When it comes to iOS, link the Session Replay library to your project based on your package manager.
Then enable session replay in your app. Here’s how to do it if you’re using Datadog:
import DatadogSessionReplay

SessionReplay.enable(
  with: SessionReplay.Configuration(
    replaySampleRate: sampleRate,
    // Enable the experimental SwiftUI recording
    featureFlags: [.swiftui: true]
  )
)
If you want to set up Mobile Session Replay for Android, follow these two steps.

Get unreal data to fix real issues in your app & web.
Declare the Datadog Session Replay as a dependency:
build.gradle.kts
implementation("com.datadoghq:dd-sdk-android-rum:[datadog_version]")
implementation("com.datadoghq:dd-sdk-android-session-replay:[datadog_version]")
// in case you need Material support

implementation("com.datadoghq:dd-sdk-android-session-replay-material:[datadog_version]")
// in case you need Jetpack Compose support
implementation("com.datadoghq:dd-sdk-android-session-replay-compose:[datadog_version]")
After you’ve done that, you can enable Session Replay in your app.
Application.kt

val sessionReplayConfig = SessionReplayConfiguration.Builder([sampleRate])
  // in case you need Material extension support
  .addExtensionSupport(MaterialExtensionSupport())
  // in case you need Jetpack Compose support
  .addExtensionSupport(ComposeExtensionSupport())
  .build()

SessionReplay.enable(sessionReplayConfig)
After this initial setup, it’s time to enable base functionalities like:
This step is important because these data points are the baseline and, in some cases, can be enough to positively impact your debugging workflow.
For example, Shake comes with these features and much more.
Also, its SDK adds only 2.5 MB to your app, so it can continue to run fast and seamlessly.
Don’t forget to mask sensitive data like passwords, credit card numbers so your users’ privacy stays protected and in line with privacy regulations.
Once the SDK is live, the app will start capturing user sessions.
But that doesn’t mean you should capture everything.
Imagine you have an app that’s used thousands of times per day, by users all over the world.
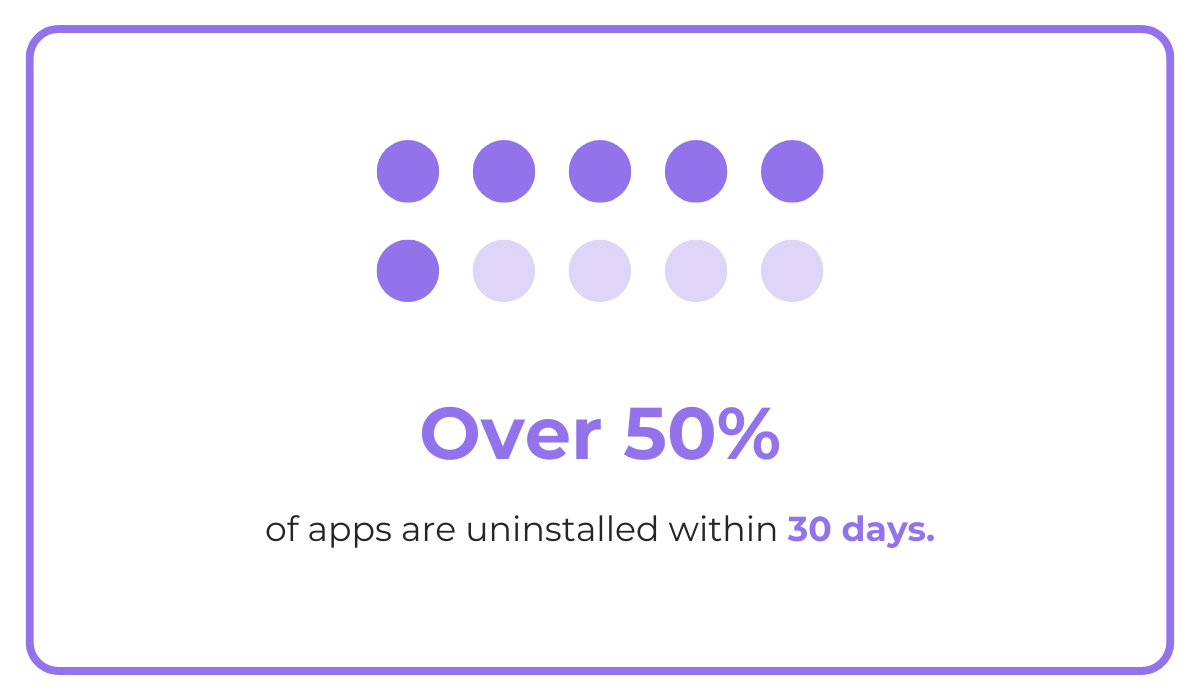
If you record its user sessions randomly, all you’ll get is heaps of irrelevant data, and even worse, you’ll miss bugs that make users leave the app.
And when more than 1 in every 2 apps installed is uninstalled within 30 days of being downloaded, that’s a risk you can’t afford to take.
That’s why being strategic when deciding what sessions to record is essential.
Start by thinking about where bugs are most likely to happen. Maybe it’s in a newly released feature, or a flow users often get stuck in.
But don’t play a guessing game and waste valuable time. Use data from other sources like your analytics to identify and choose the most critical issues.
Look for patterns.
For example, if your analytics show a significant drop in app registrations, active users, or session length, it’s worth checking whether a bug or another technical issue caused it.
But you don’t have to record everything and sift through it manually. You can automate what gets captured.
For instance, record sessions that include:
Or capture only sessions triggered manually in the code.
That way, your team avoids reviewing dozens of irrelevant replays just to find one useful clue.
Another way to customize your recording logic is with tags and filters.
Let’s say you’re testing a new checkout flow. You could tag users in that experiment and record only their sessions.
App session replay tools like Sentry, Shake, and Instabug let you use custom filters and tags like this to cut through the noise and focus on critical bugs.
So before you hit “record”, think about what goal you are trying to achieve and why.
This way, you won’t get overwhelmed by a mountain of data, and you’ll save time and energy for the next step.
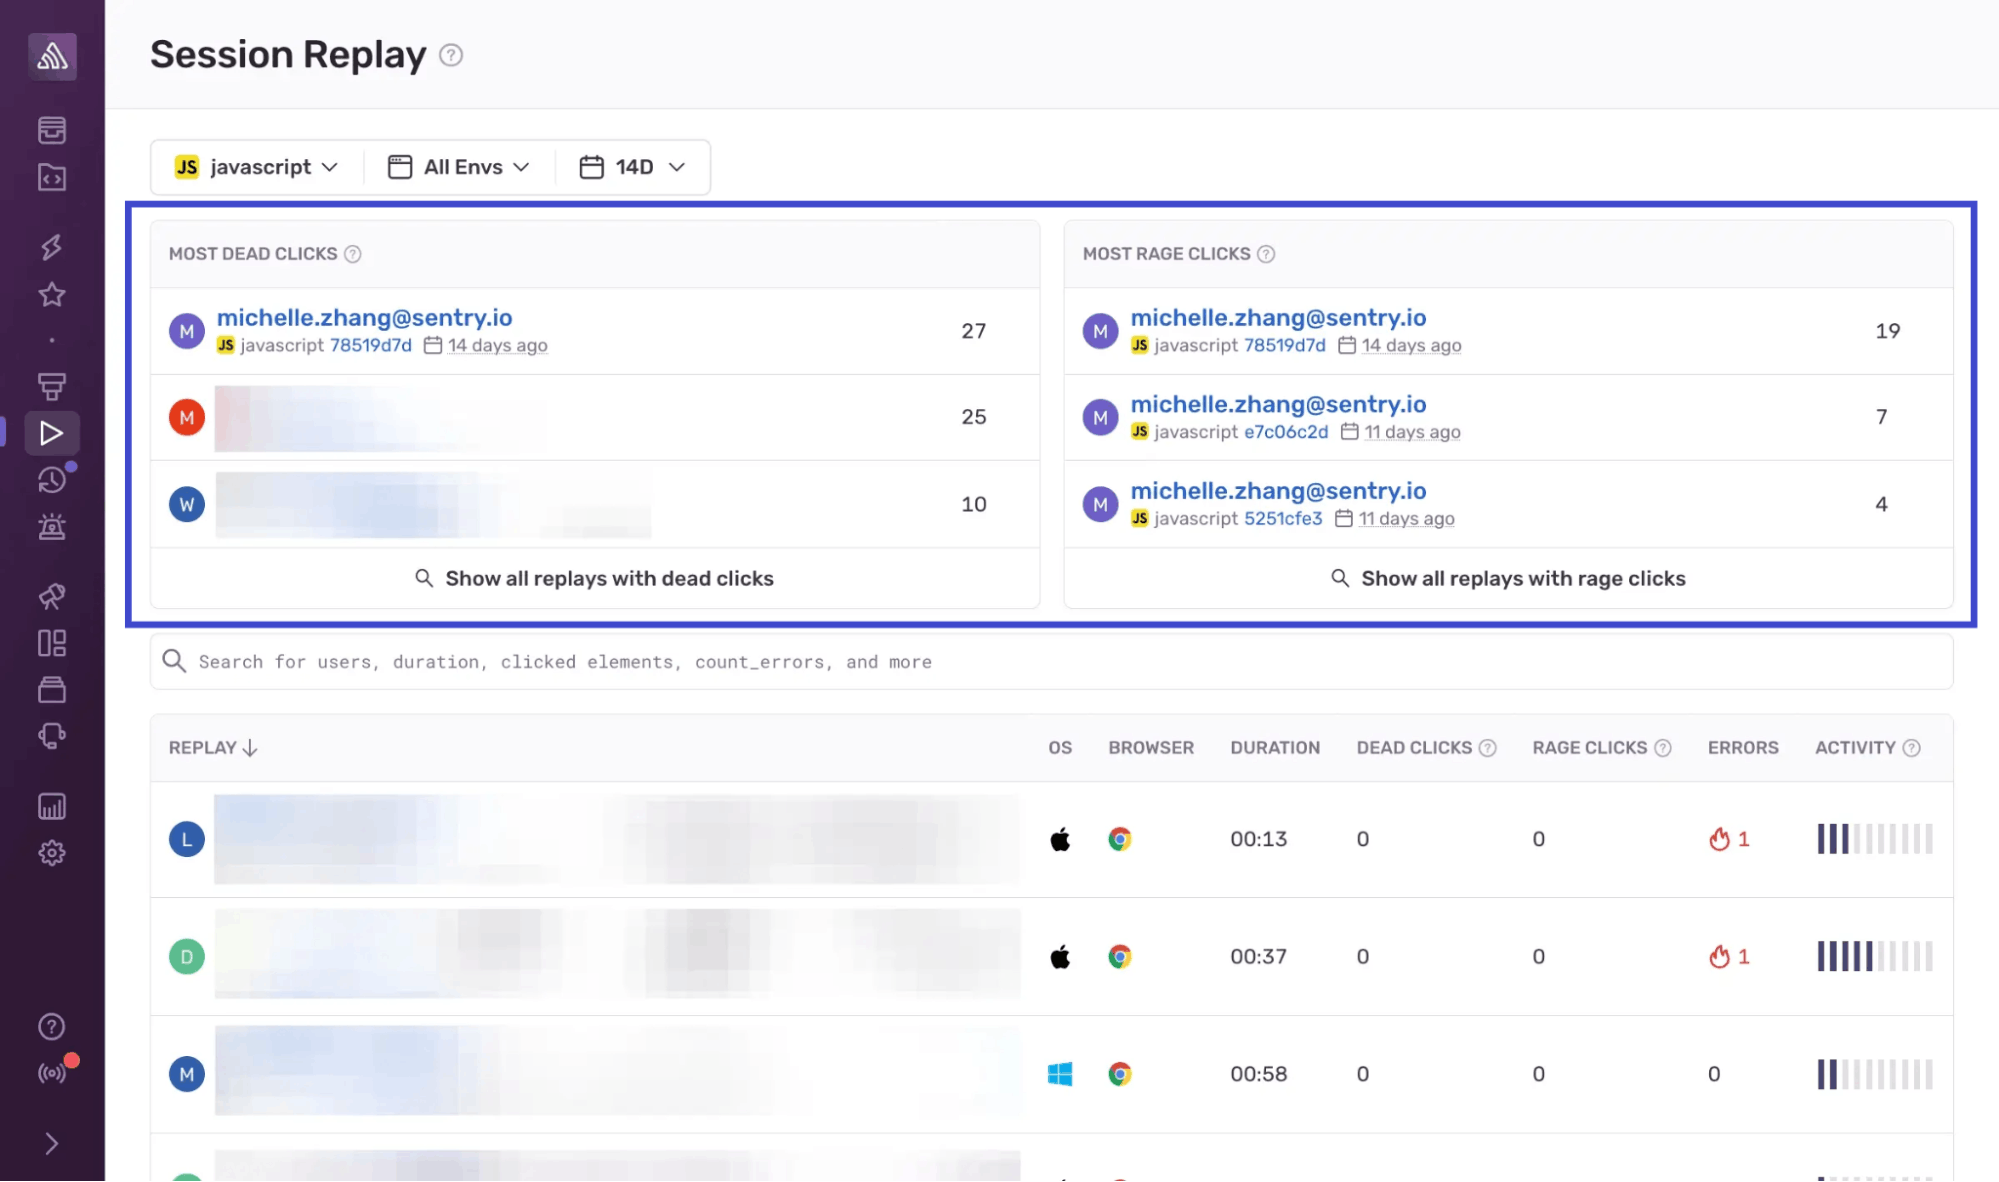
Once the session recording is live, it’s time to find and identify roadblocks in user sessions.
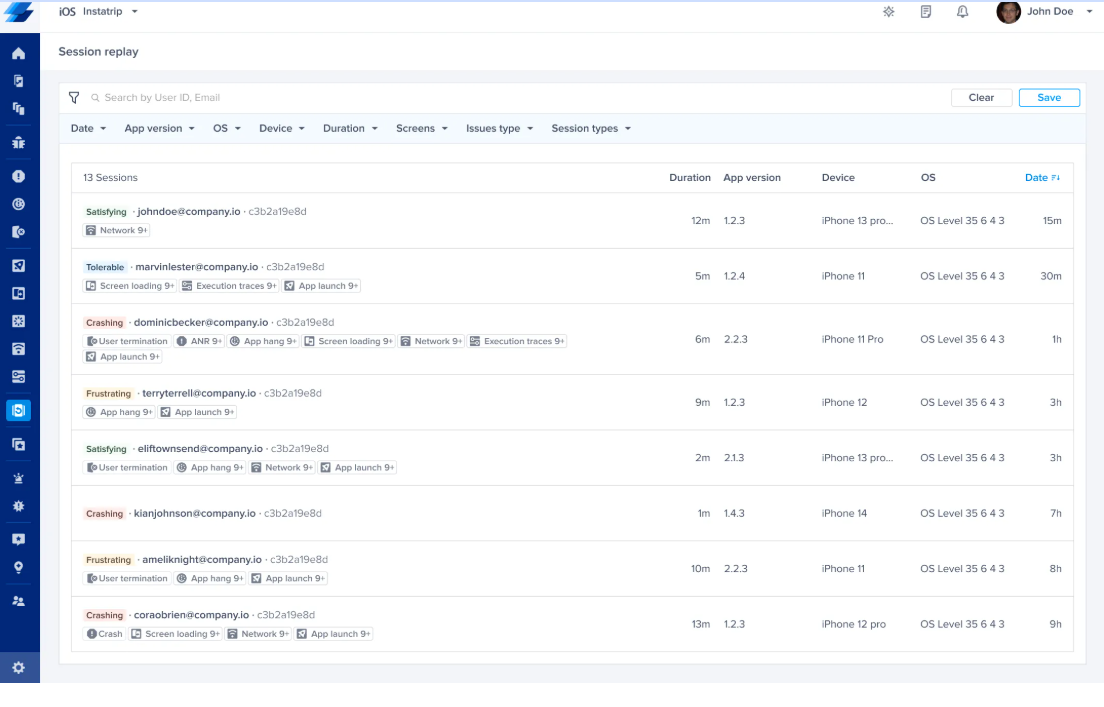
Now, you don’t need to watch hundreds of recordings until you find a bug or error. Filters, tags, search, and triggers will help you find them more quickly.
You can filter session replays by error type, such as:
You can also search sessions by user ID to follow up on a specific bug report. Some tools let you filter sessions by:
For example, if you’re tracking an issue that appears limited to a specific OS version, those filters help you isolate the problem faster.
Similarly, if you’ve just released a new build, filtering by app version lets you compare user behavior before and after deployment.
This helps you confirm whether a fix worked or identify if a new issue has emerged.
Sentry’s session replay, for example, offers a replay page with filters for URL path, error tags, and more. You can also group sessions by shared issues or behaviors.
The point is to narrow your view so you’re only watching sessions that matter right now.
This step is especially important if you’re dealing with a high-traffic app. Filtering cuts your watch time dramatically by pointing you to relevant or critical sessions.
The faster you find the right replay, the faster you’ll debug. You’ll also gain insights that help you improve the app experience for end users.
After you’ve found the right session, it’s time to figure out what went wrong and why.
App session replays are great for this because they have what logs or basic user feedback don’t: context.
You can see what the user tapped, which screen they were on, how they navigated, and even how long they paused between actions.
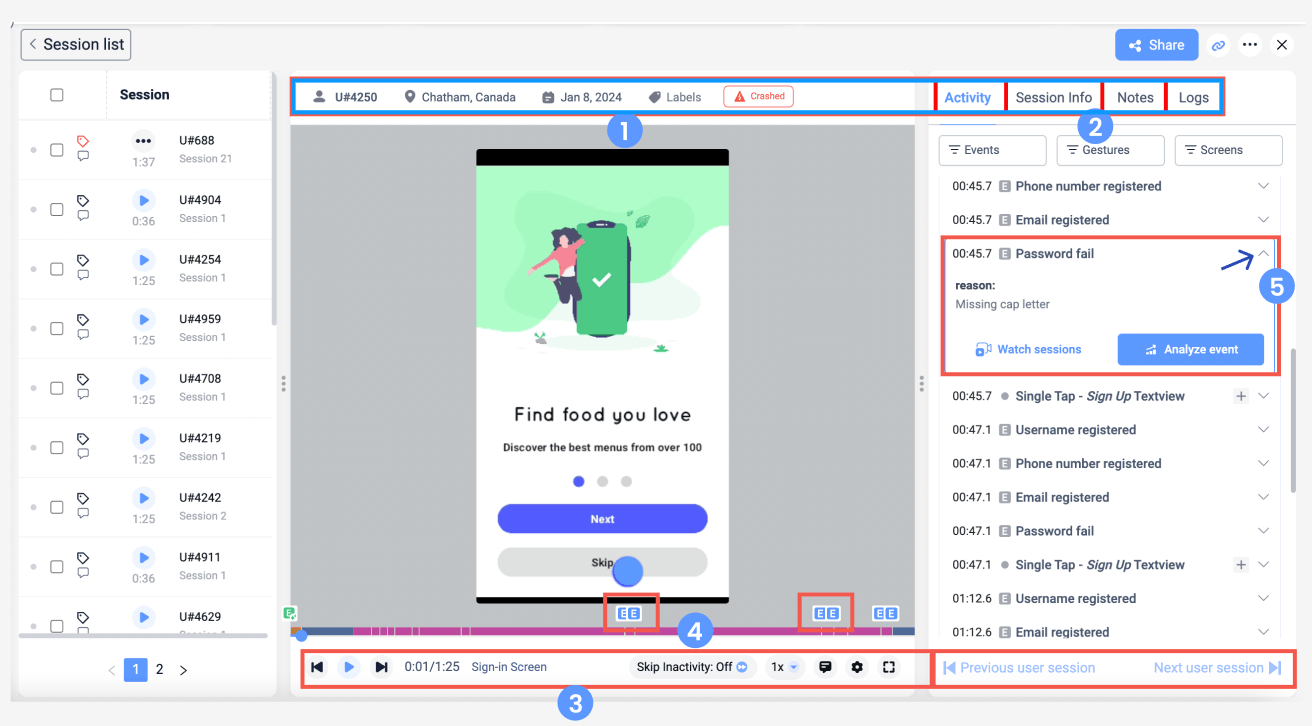
These little details matter because they show you whether the app truly is in line with user expectations.
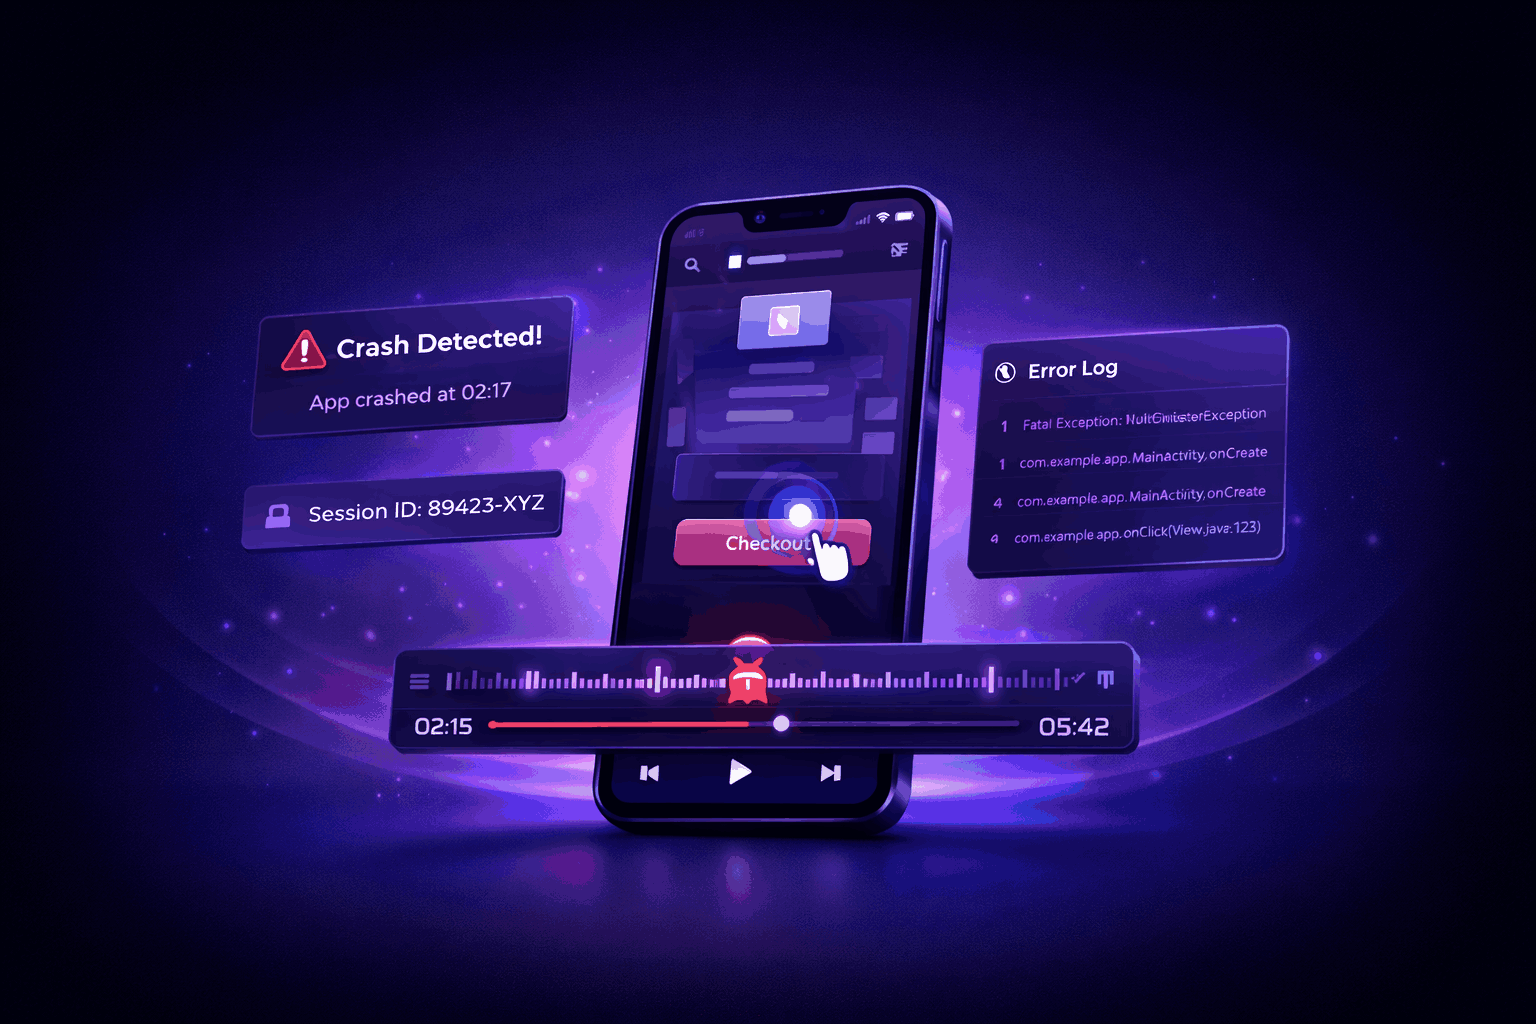
Let’s say a user abandons the checkout flow.
Logs might show an error, but the replay shows what triggered it:
These kinds of interactions, like dead taps (when a tap does nothing) or rage taps (repeated taps on the same spot), are often signals of either broken elements or confusing UX.
Many session replay tools detect these automatically, giving you faster insight into real usability problems.
On top of that, always pay close attention to user intent. Ask yourself:
Learning to spot these cues will help you identify not just technical bugs, but also usability problems that impact the overall user experience.
The more clearly you see what the user was doing before the bug appeared, the easier it is to recreate the bug and fix it.
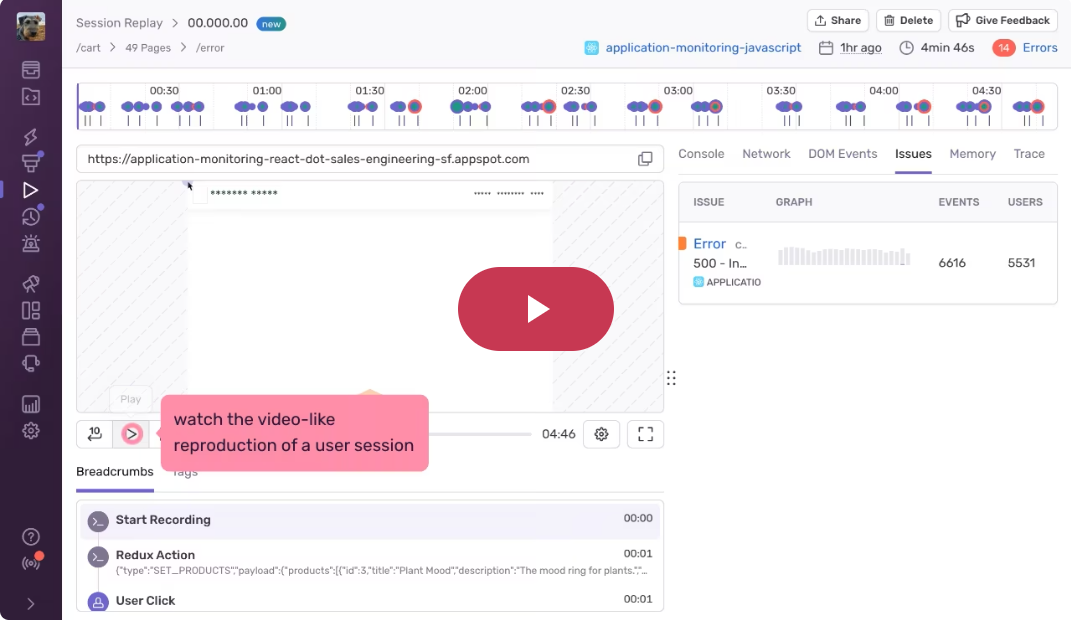
The next step is to reproduce the bug in your dev environment.
Session replay gives you a detailed timeline of a session:
Together, these make it much easier to recreate the conditions that triggered the issue.
Let’s say a replay shows a crash on an Android after the user navigated back and forth a few times.
You can open your staging build, match that same flow on an emulator or test device, and walk through the steps.
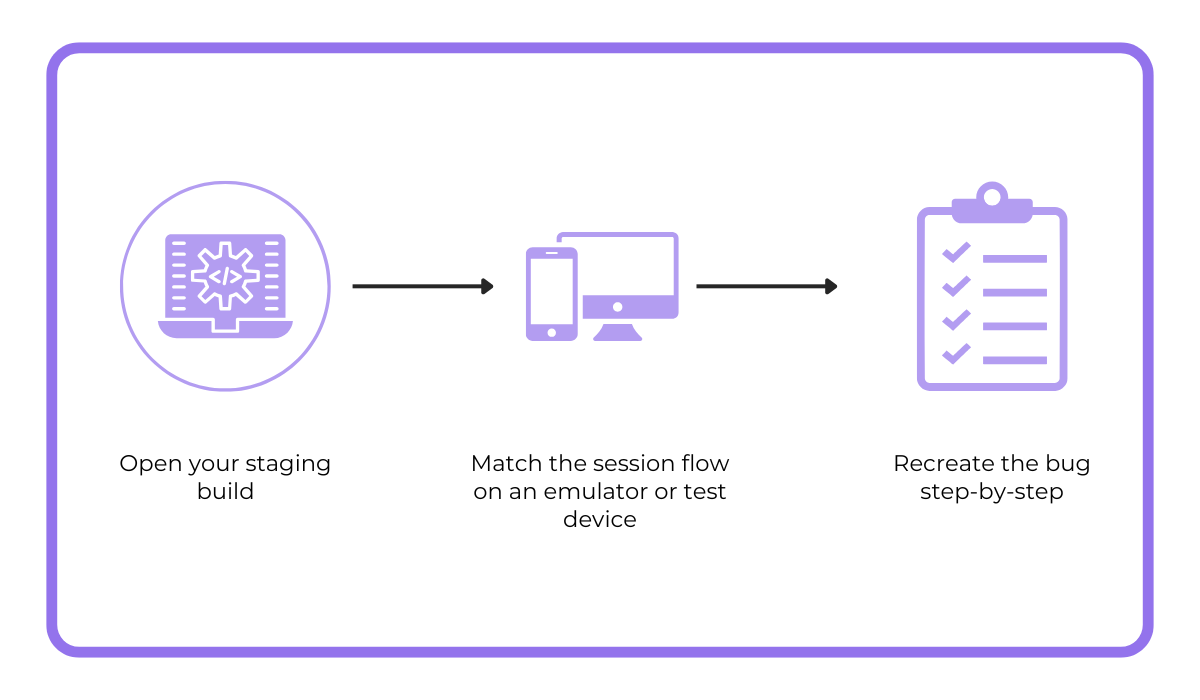
Once you’ve triggered the same issue locally, you can go into the code, isolate the problem, and work on a fix.
And because you’re working from a session that actually broke, you know the steps you’re testing are not a guess, but based on an authentic user session.
Visual replay isn’t the only thing that’ll help you dig out issues.
Tools like Shake give you logs, gestures, and even console output from the session.

Capture, Annotate & Share in Seconds with our Free Chrome Extension!
You can trace the issue in your debugger using all this information.
For bugs tied to timing or edge cases, this level of detail is often the difference between a guess and a meaningful fix.
Overall, when your local reproduction is based on actual user sessions, it leads to faster, more precise debugging.
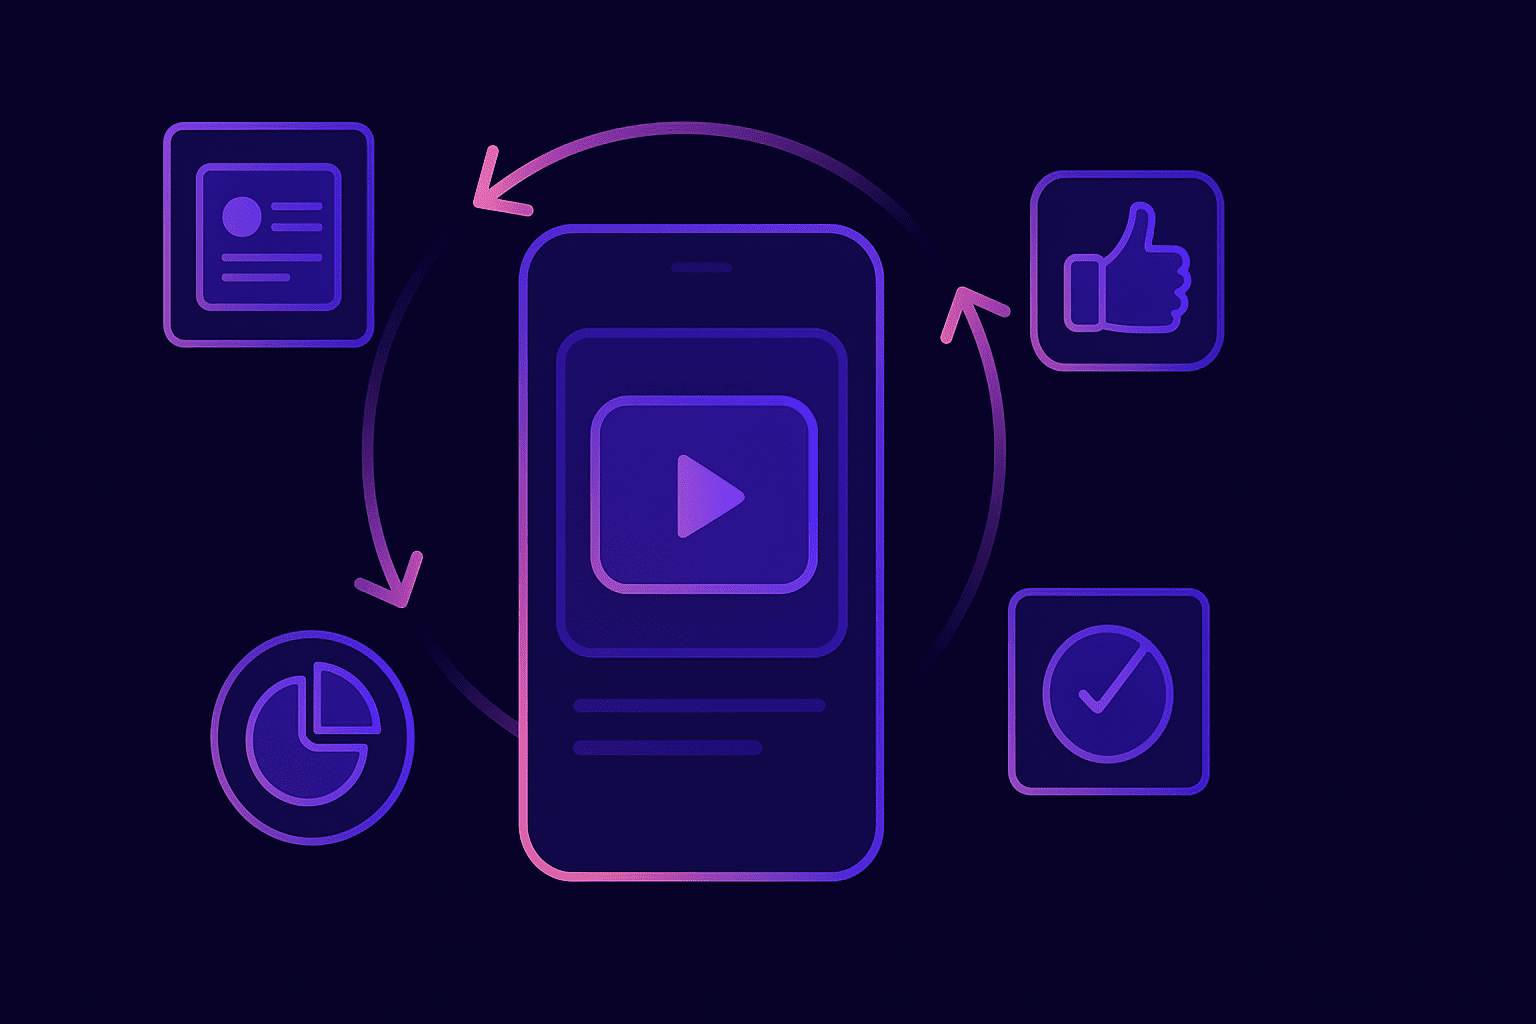
After a fix is deployed, use session replay to monitor new sessions and make sure the bug doesn’t reappear.
This step is especially useful when dealing with bugs related to flows or user behaviors that happen in real time.
Instead of waiting for new reports, save time by watching how users interact with the updated feature.
Start by reviewing sessions that follow the same path where the bug first happened.
Ask yourself:
If you had previously seen drops in interactions or crash spikes, check those metrics again to see whether they’ve returned to normal.
Many tools let you tag or group sessions by version, device, or even custom flags. That makes it easier to compare behavior before and after the fix.
You can also check whether related issues still appear in logs, or whether original triggers like slow network calls or edge-case inputs continue to cause trouble.
Also, session replay can confirm whether the fix has restored expected user behavior, like seeing users complete a form they previously abandoned.
It also gives you insight into any unintended consequences of your fix, such as:
This kind of post-fix validation will give you a confidence boost before you roll out a wider release.
Instead of relying solely on QA testing or user feedback, you’re seeing how the fix performs in real usage.
And if something still isn’t right, you’ll catch it early and correct it quickly, saving time, frustration, and follow-up cycles.
Session replay speeds up debugging and gives your team the clarity and confidence to fix issues.
While logs and reports tell you what happened, session replay shows you how and why it happened, through the user’s eyes.
To get the full picture, combine session replays with insights from analytics and user feedback.
No need to wait for the next bug to slow down your sprint.
Build session replay into your workflow and start solving app issues with more confidence.
From internal bug reporting to production and customer support, our all-in-one SDK gets you all the right clues to fix issues in your mobile app and website.
We love to think it makes CTOs life easier, QA tester’s reports better and dev’s coding faster. If you agree that user feedback is key – Shake is your door lock.
Read more about us here.

Add to app in minutes

Doesn’t affect app speed

GDPR & CCPA compliant

Unexpected things pop up
Just like bugs in your app or web 🐛 Fix them now with just one reporting tool.