
Recommended
How to properly plan your beta test
The success of any software app heavily relies on the effectiveness of the beta testing phase, since that is the final evaluation of the product before its release.
Tracking the right metrics during this critical stage is essential, as doing so can help teams guide and optimize the entire process to ensure its ultimate success.
In this article, we’ll show you the four vital beta test metrics you should be monitoring to improve your beta testing efforts and set the stage for a launch of a great product.
By honing in on these indicators, you can address pressing issues and elevate your product’s quality, leading to satisfied customers and increased revenue.
So, let’s begin our journey into the realm of beta test metrics by looking at quality metrics.
Table of Contents
The main goal during beta testing is to collect valuable user feedback and other relevant data, and then use it to help polish an app before release.
But how do you determine whether the collected data is useful?
To ensure that the data you are gathering truly contributes to product improvement, employing a range of quality metrics for evaluating it is essential.
Quality metrics are indicators that measure the usefulness of the feedback from beta testers and how effectively it is being used to address potential issues.
We’ve listed some commonly used metrics of this type below:
These metrics can help understand how well beta testers identify problems and whether their insights help resolve issues and any redundant or incorrect reports.
Tracking these metrics provides a clear picture of the effectiveness of the beta test process and can ensure that crucial issues are being addressed.
Consider the next image, showing a graph of created vs. resolved issues.
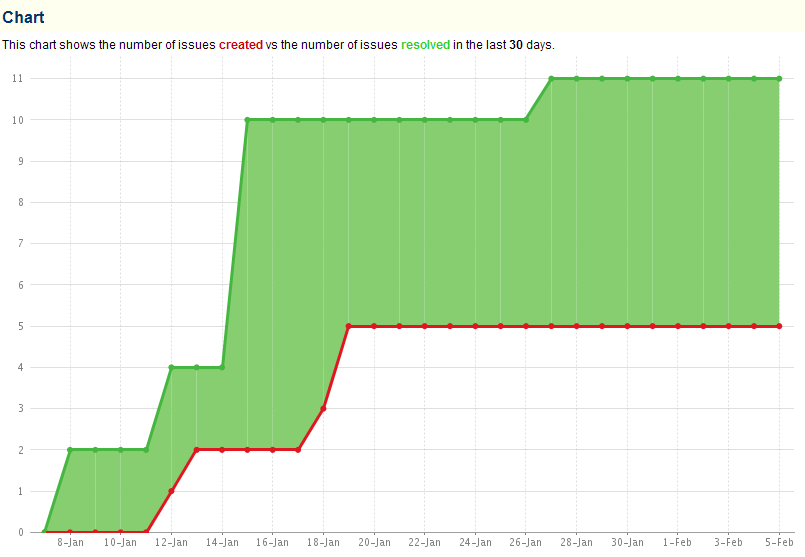
Statistics such as these can give you insight into the number of issues found by beta testers and whether the feedback contributes to their resolution.
Monitoring this ratio helps to ensure that the beta testing process yields high-quality, actionable input that contributes to the overall improvement of the product.

Get unreal data to fix real issues in your app & web.
Or, consider the more advanced feedback impact score offered by Centercode, a beta test management tool often used by organizations to manage and analyze data during beta testing.
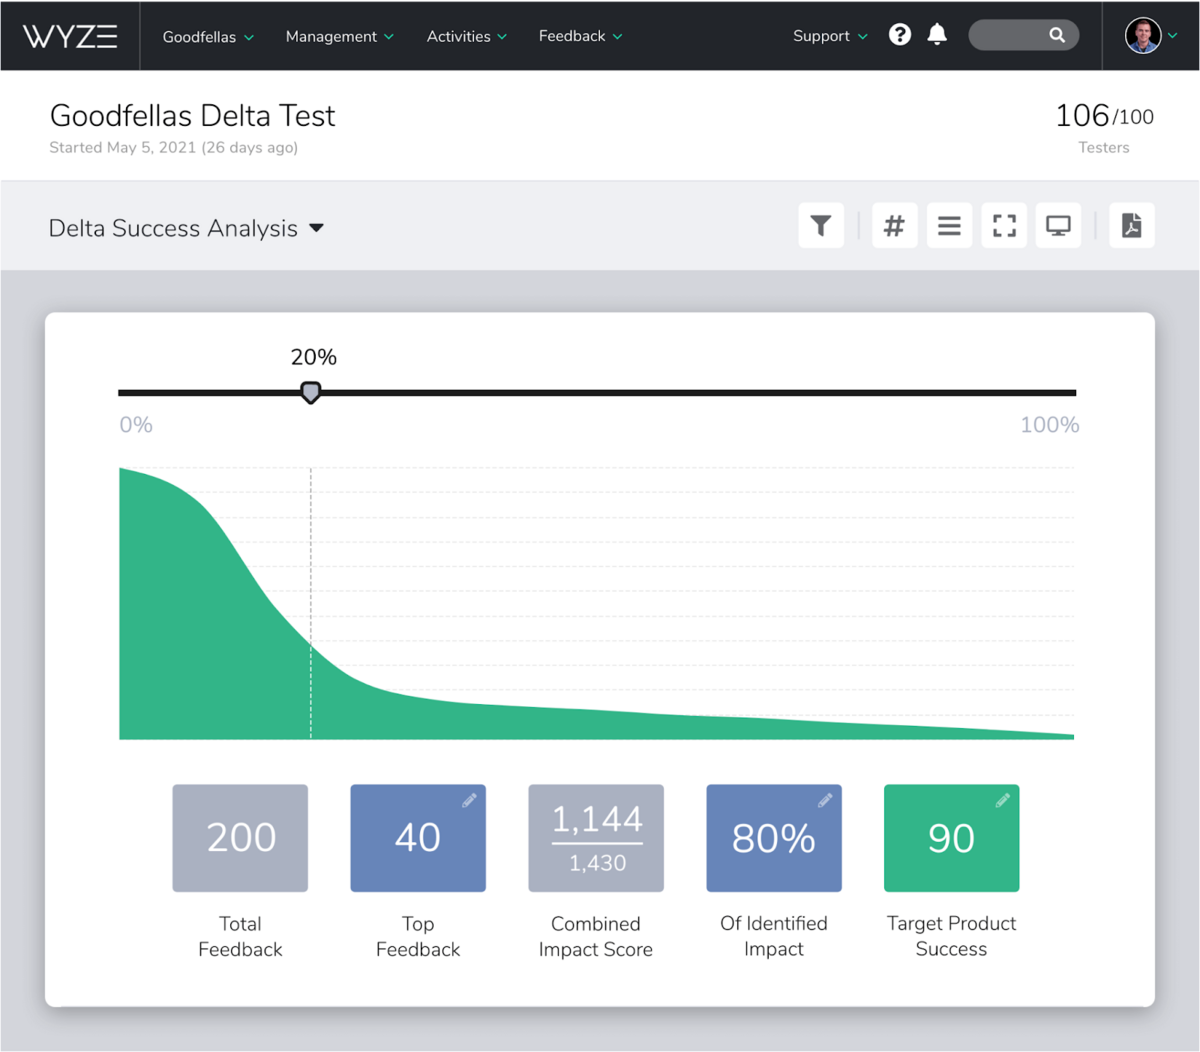
By gathering different metrics and combining them into a single number, this feedback impact score can help you figure out whether the testers’ insights contribute to the success of your application, and how much.
Overall, keeping a close eye on quality metrics can help you assess the value of the collected data and determine the overall success of the beta test in enhancing your app.
Beta testers play a crucial role in identifying flaws and suggesting improvements to an app, but their involvement goes beyond merely reporting issues.
To understand the depth of their interaction with your application and pinpoint areas that need more attention, engagement metrics should be closely monitored.
Engagement metrics are a collection of data points that help you assess how actively and effectively your beta testers interact with your app.
They provide a quantitative measure of user engagement, enabling you to identify trends and patterns that can inform your product development decisions.
Let’s take a look at some popular engagement metrics in the following image.
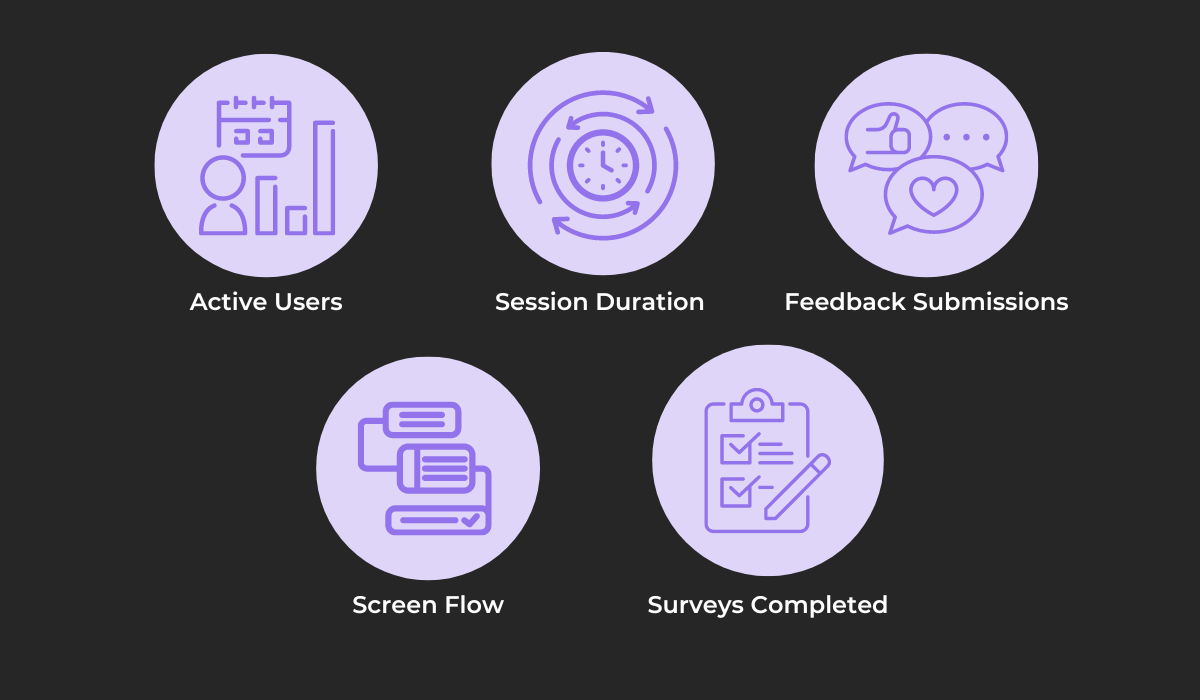
By tracking the shown metrics, an organization can gain a comprehensive understanding of how beta testers are using your software product.
For example, consider the active users data, which can be monitored on a daily, weekly, or monthly basis.
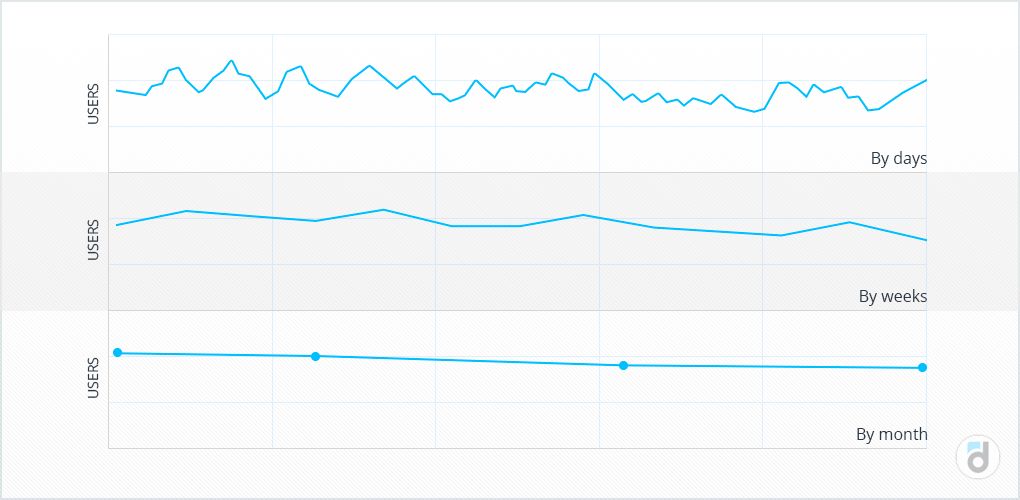
Analyzing active users data is a crucial aspect of determining the engagement of beta testers during the beta test process.
This information provides an overview of how often and consistently testers interact with the app, which can indicate the level of interest and commitment they have toward the testing process.
Similarly, heatmaps and screen flow data, like the data provided by UXCam, can give valuable engagement information.
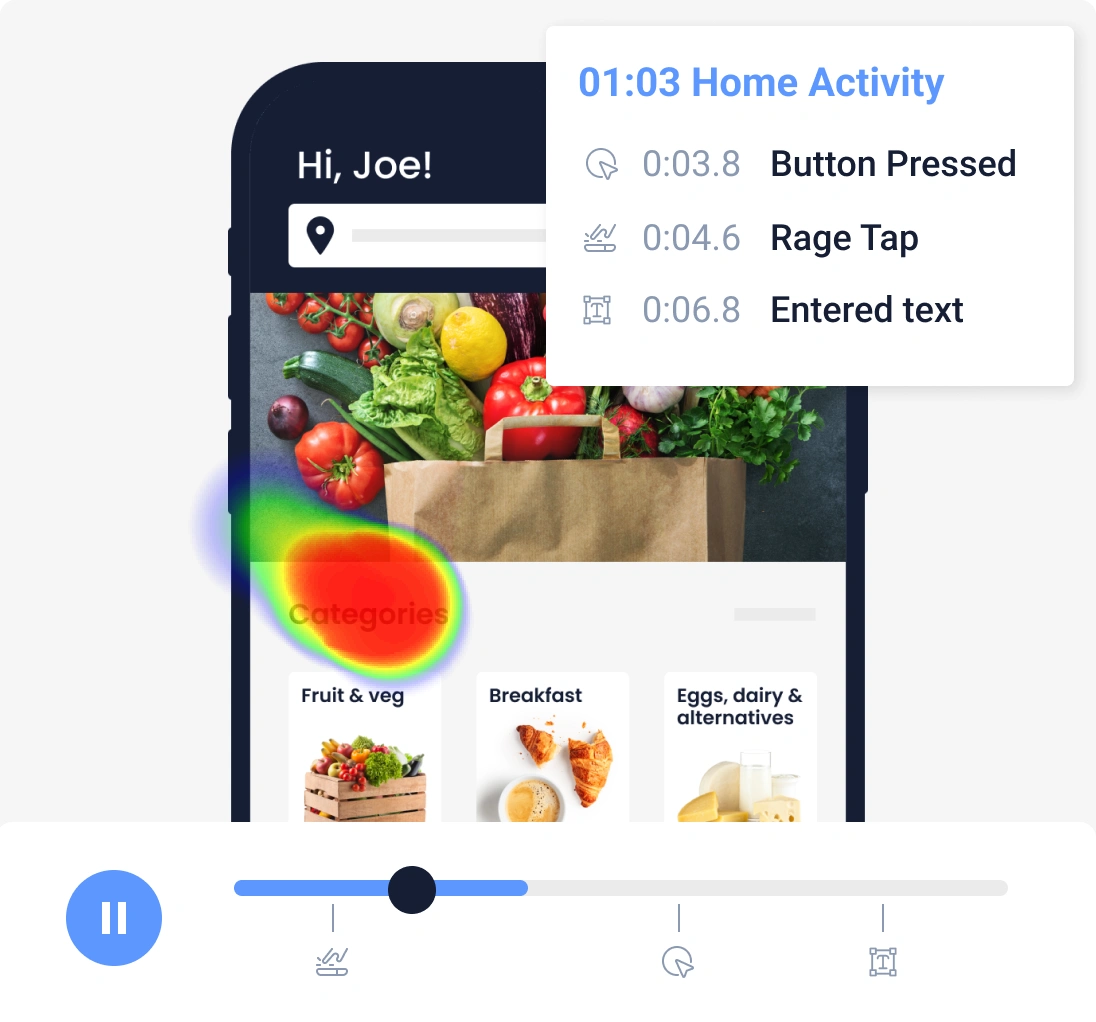
These heatmaps can show how each beta tester uses and navigates your product’s user interface.
The data can reveal whether testers are thoroughly examining and engaging with your app or just casually browsing through without testing the product.
These and other engagement metrics can help evaluate the commitment and involvement of users to your beta testing initiative, so tracking them is key.
Besides engagement, evaluating how beta testers feel about the overall experience while using your product is also vital.
Satisfaction metrics are used to measure the level of satisfaction and enjoyment testers have while they interact with an app.
As beta testers should represent the target audience that will use your product after release, these metrics can be a great indicator of how an app will be received by end users.
One valuable satisfaction metric is the retention rate, which measures the percentage of users who continue to use the app over a specified period.
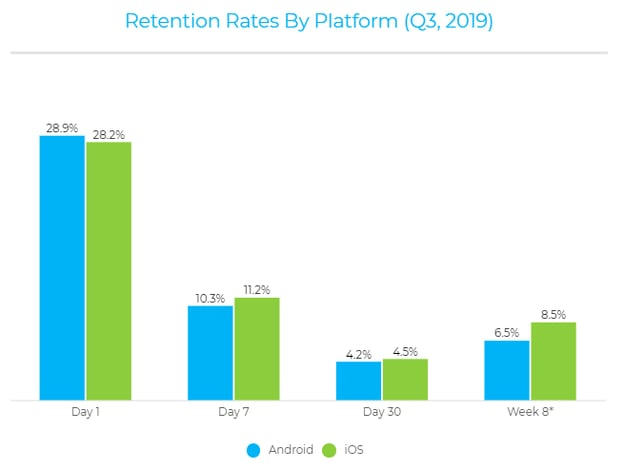
The data above shows the common retention rates for apps on Android and iOS from day one to week 8, with which you can compare your beta tester retention rates.
A high retention rate can indicate that beta testers find an app useful and enjoyable, while a low rate suggests potential issues with the app that may be causing them to abandon it.
To add to this metric, you can use the Net Promoter Score (NPS), which gauges the likelihood of beta testers recommending an app on a scale of 0 to 10.
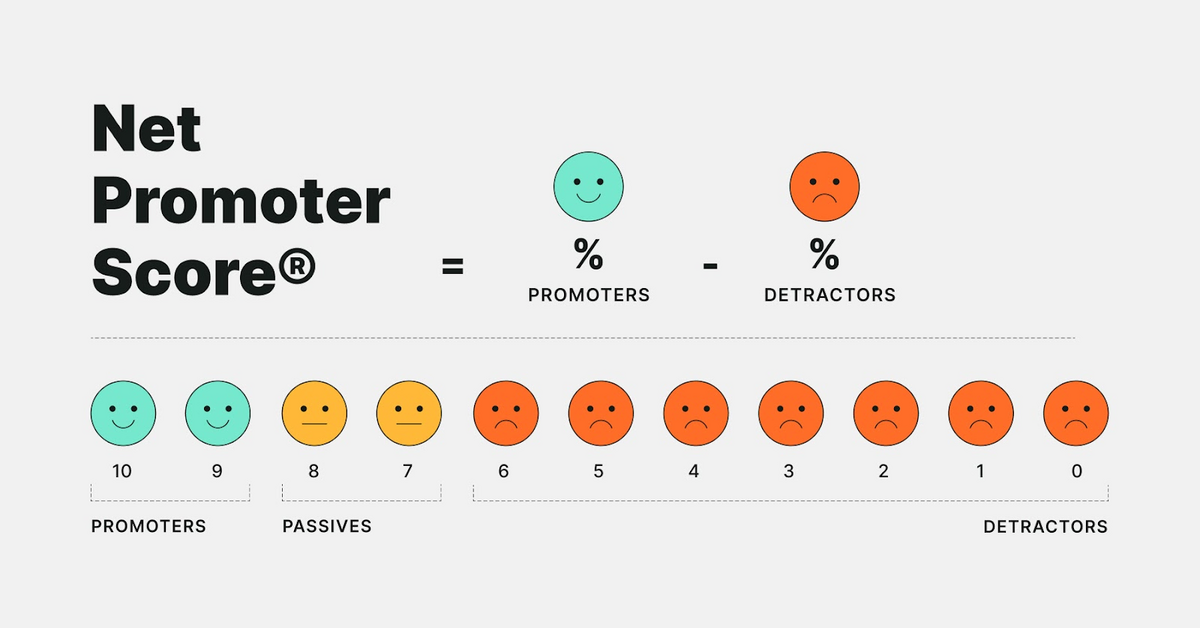
The overall NPS is calculated as the percentage of users most likely to recommend your app or the promoters minus the percentage of users who won’t promote your app, called the detractors.
To see why the detractors wouldn’t recommend your app, a survey can give additional satisfaction data and insights into their issues and what made them dissatisfied.
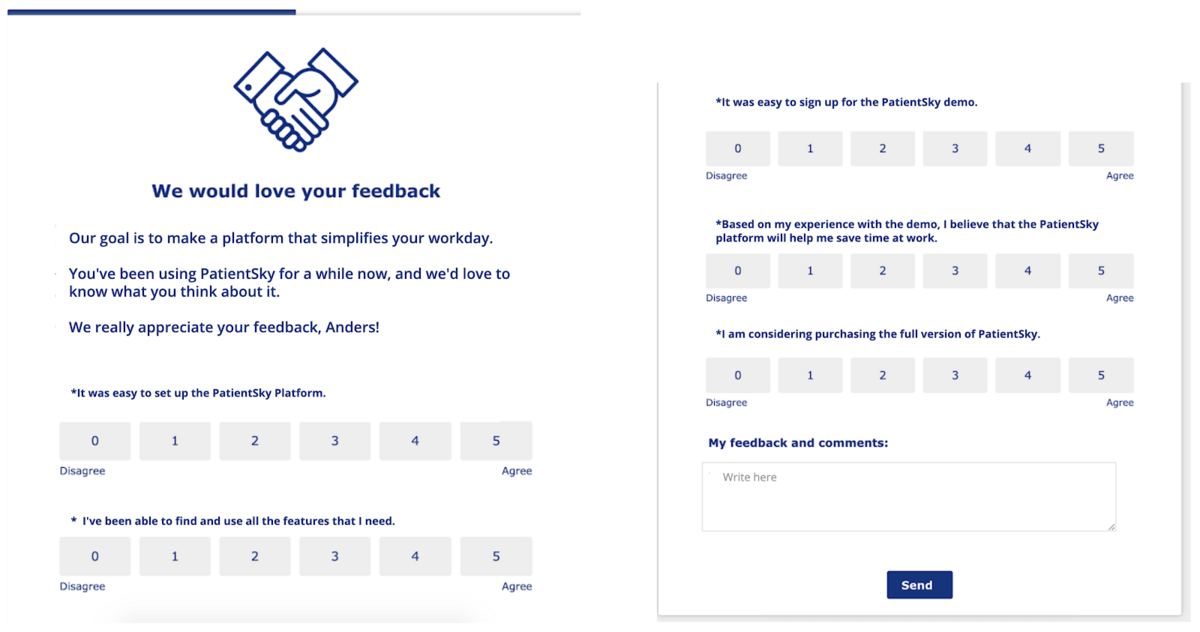
A survey that users can access from inside the app can be used to quickly gather feedback from beta testers, including data about their experience with specific areas of the app and their overall satisfaction with the product.
As you can see, satisfaction metrics like these can be crucial in identifying potential user experience issues and guiding future development decisions.
Finally, to assess the success and performance of your organization’s beta testing endeavors, you can use multiple output metrics to measure the amount of work and effort put into these programs.
Output metrics essentially quantify various aspects of your beta testing process, giving you a clear picture of how your beta testing programs are progressing. Some key metrics of this kind include the following:
Monitoring these metrics can help evaluate your beta testing programs in terms of the efficiency and effectiveness of the process.
For instance, tracking the number of beta testers across projects can provide valuable insight into the tester recruitment practices and how they affect the program’s outcomes.
You can use a great project management tool to compare this metric and various others across projects.
To illustrate, look at the following image showcasing Asana’s project overview dashboard.
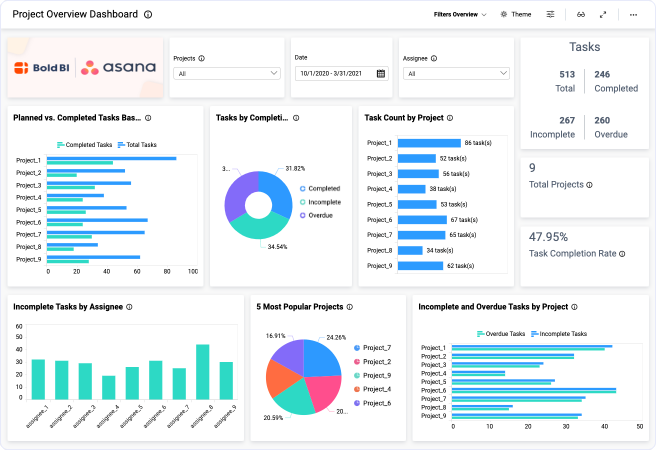
Asana’s dashboard can be customized for beta testing activities, and it can provide valuable insights into any major changes across programs.
For example, you can determine that the amount of feedback sent by testers has lowered in your more recent beta test programs, and you need to change your feedback management practices.

Capture, Annotate & Share in Seconds with our Free Chrome Extension!
Or you can find that despite having more beta testers, feedback numbers stayed the same, so managers should evaluate their recruitment practices.
Overall, tracking output metrics ensures you can measure the success of your beta testing efforts and make data-driven decisions moving forward.
In this article, we delved into the importance of tracking four key beta test metrics to streamline and enhance your beta testing process.
We hope that by now, you have a solid understanding of how these metrics can help you identify potential issues, prioritize improvements, and optimize your beta test programs.
Armed with this knowledge, you can better navigate the complexities of beta testing, ensuring a smoother path to a successful release.
So, as you embark on your next project’s beta test, remember that the power of these metrics is at your fingertips, ready to guide you toward an exceptional final product.
From internal bug reporting to production and customer support, our all-in-one SDK gets you all the right clues to fix issues in your mobile app and website.
We love to think it makes CTOs life easier, QA tester’s reports better and dev’s coding faster. If you agree that user feedback is key – Shake is your door lock.
Read more about us here.

Add to app in minutes

Doesn’t affect app speed

GDPR & CCPA compliant

Unexpected things pop up
Just like bugs in your app or web 🐛 Fix them now with just one reporting tool.