7 best tools for tracking app user behavior
Key Takeaways:
If you’re a novice developer, you’ve probably run into a cryptic error message and had no idea where to start.
Even experienced developers sometimes struggle to make sense of stack traces, but once you know how to read them, they become one of the most powerful debugging tools in your arsenal.
In this guide, we’ll break down the key parts of a stack trace and show you exactly how to use them to find and fix bugs faster.
Table of Contents
When a software program encounters an error (exception), it often produces a stack trace.
A stack trace is a detailed report showing the sequence of function calls (stack frames) that led to the error.
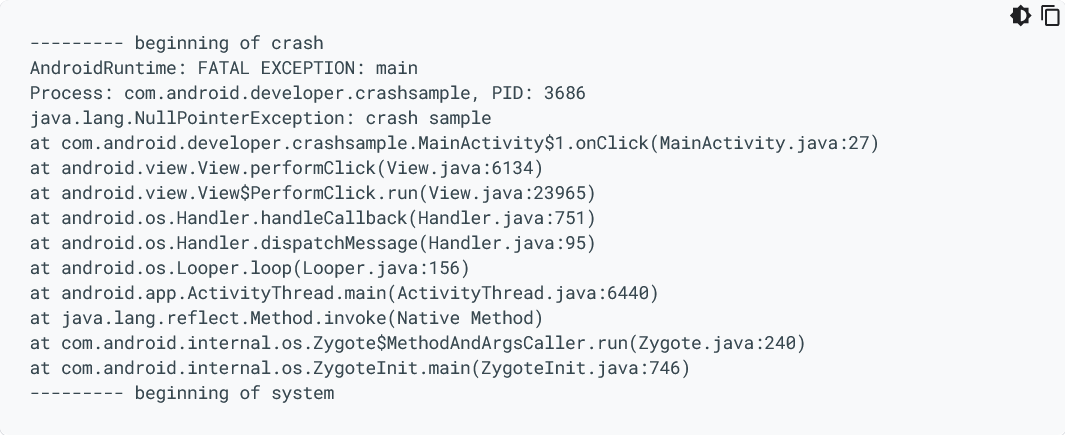
This helps developers understand what went wrong and where.
However, whether a stack trace appears automatically depends on the programming language and environment configuration you’re using.
Some languages, such as Java, Python, and C#, display it by default when an unhandled error occurs, while others require developers to explicitly generate stack traces for debugging.
Regardless of how it appears, a stack trace always contains key details about the error.
Below, you can see these elements highlighted in a simple stack trace:
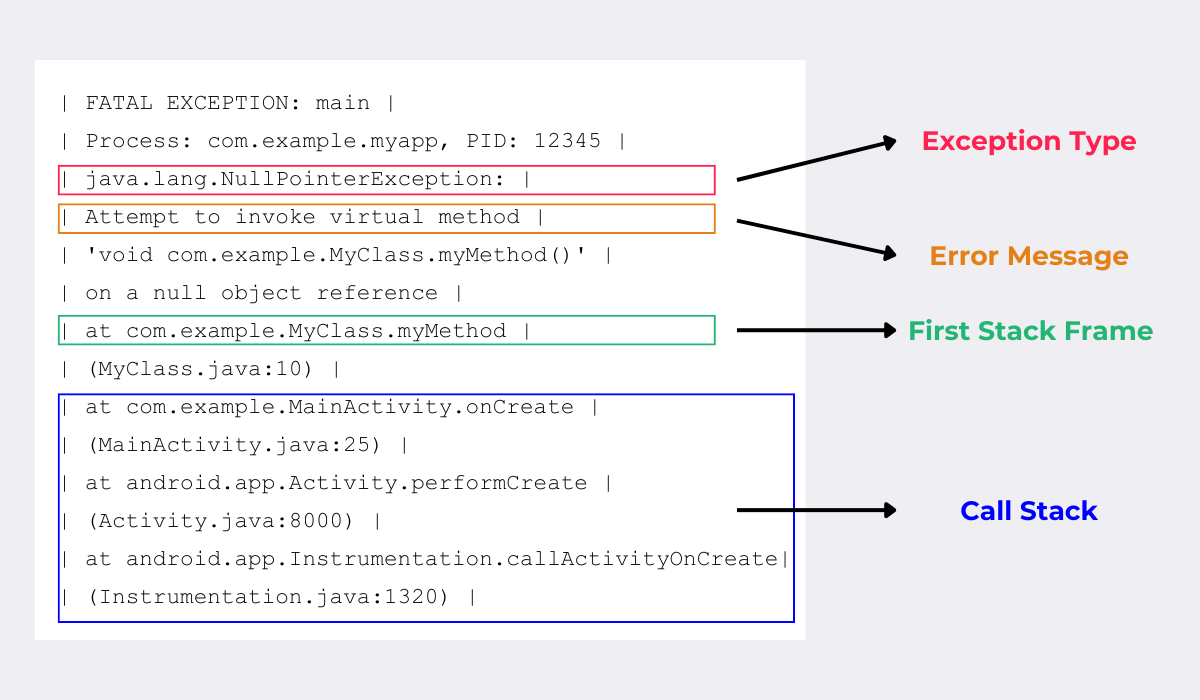
As illustrated, each stack trace consists of four key elements.
First, after the opening lines that indicate an error has occurred, you’ll find the exception type.
This tells you what kind of error occurred, providing a high-level clue about what went wrong.
Next is the error message, which gives a brief description of the problem and provides more context about the nature of the error.
Following the error message, the first stack frame (function call) typically shows the most recent call, which is often where the error happened.
The remaining stack frames represent the call stack—the sequence of method or function calls that were active at the time of the error.
Each line in the stack trace shows the method name, the file or class where it’s located, and the line number where the call was made.
This information helps developers trace the sequence of events leading up to the error, making it easier to pinpoint exactly where things went wrong.
Understanding these key elements is the first step in troubleshooting an issue.

Get unreal data to fix real issues in your app & web.
As we’ve mentioned several times, a stack trace is an invaluable tool for debugging, helping developers quickly pinpoint where things went wrong in the code.
It acts as a “breadcrumb trail,” showing how the program reached the point where the issue occurred.
To effectively use a stack trace for debugging, follow this four-step process.
The first step in debugging with a stack trace is identifying the exception type and error message.
These provide a high-level clue about the underlying problem, helping you determine what went wrong and where to start troubleshooting.
Different programming languages have common types of exceptions, each indicating a specific kind of issue.
The table below highlights some frequent exception types and what they typically mean:
| Exception Type | Description |
| NullPointerException | Occurs when the program tries to access an object or variable that hasn’t been initialized. |
| IndexOutOfBoundsException | Happens when attempting to access an array or list element outside its valid range. |
| TypeMismatchException | Raised when an operation is performed on incompatible data types. |
| IllegalStateException | Indicates that a method has been called at an inappropriate time in the program’s lifecycle. |
| ArithmeticException | Occurs when there’s an illegal arithmetic operation, like division by zero. |
| StackOverflowError | Caused by excessive recursive calls that exceed the system’s stack limit. |
| OutOfMemoryError | Happens when the program runs out of available memory, often due to inefficient resource management. |
Understanding the exception type gives you an immediate clue about what might have caused the error and where to look in the code.
For example, if you encounter a NullPointerException, it means your program is trying to access an object that hasn’t been initialized.
Knowing this, you can check the variable mentioned in the stack trace to see if it was assigned a valid reference before being used.
Let’s say you have this Java snippet:
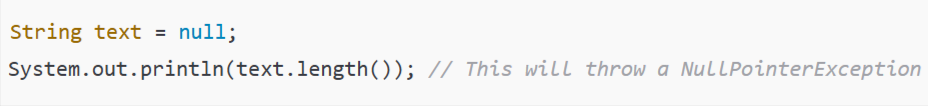
Here, text is null, so calling length() on it results in a NullPointerException.
To fix this, you can add a check before accessing the variable:
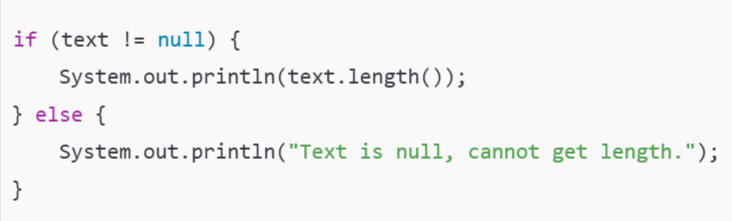
This straightforward example illustrates how, by understanding what the exception type means, you can narrow down the problem and apply the right fix.
However, identifying the error type is just the first step.
To fully understand why the error happened, you need to analyze the call stack.
As mentioned earlier, the call stack represents the sequence of function calls that were active at the time of the error.
Each time a function is called, a new stack frame is pushed onto the stack, storing essential details like local variables and execution state.
Once the function completes, its stack frame is removed.
However, when an error occurs, the stack trace captures the call stack at that moment, showing the chain of calls that led to the failure.
To analyze an error effectively, it’s important to understand how the call stack grows and shrinks as functions are called and completed.
The image below illustrates this process:
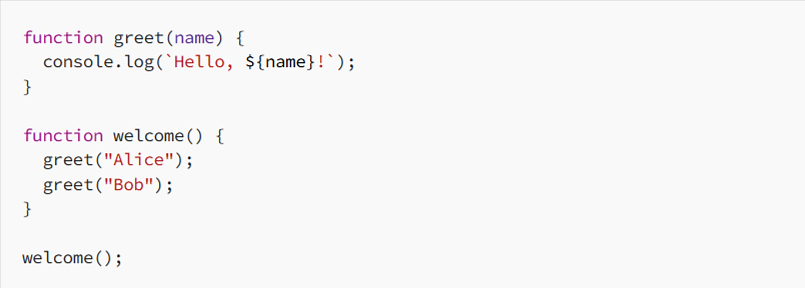
In this example, calling the welcome function pushes greet (“Alice”) onto the stack, which then pushes console-log, and so on.
Because the call stack follows a Last In, First Out (LIFO) structure, the most recent function call remains at the top until it completes.
When an error occurs, the first stack frame at the top of the trace represents where the failure was detected.
However, to fully understand the issue, developers may need to trace back through earlier calls to see how the error originated.
To illustrate this, the image below highlights the first stack frame within a stack trace and shows the sequence of function calls leading up to it.
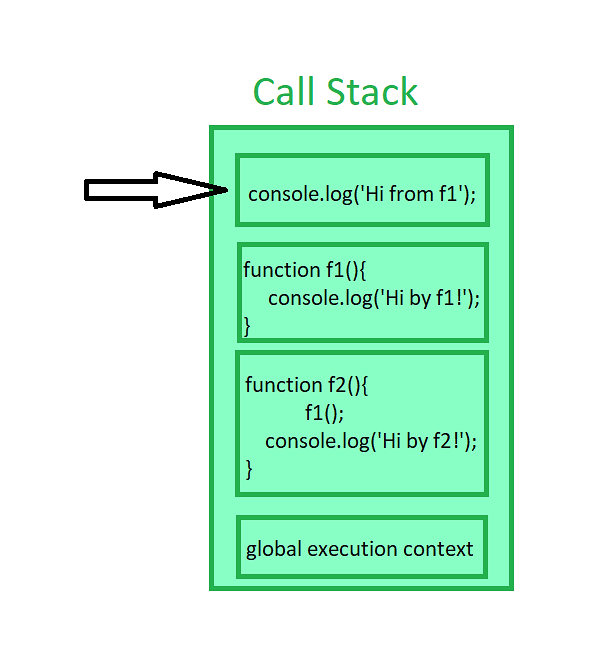
While the error was detected in the first stack frame, that doesn’t necessarily mean it originated there.
Often, the root cause lies in an earlier function call, so it’s advisable to follow the stack trace from top to bottom to understand how the error propagated through the app.
This helps trace the exact path the program took before failing.
In doing so, it’s important to look for problems like bad inputs, uninitialized variables, or failed assumptions.
When you think you’ve found the cause of the error, it’s time to replicate the issue.
Reproducing the error helps verify that it consistently occurs and confirms whether the correct source has been identified.
By recreating the issue, you can better understand its behavior and narrow down the circumstances in which it occurs.
When replicating the error, it’s important to test different scenarios, such as various inputs or edge cases, that could trigger the issue.
This also helps identify any conditions or patterns that may be leading to failure.
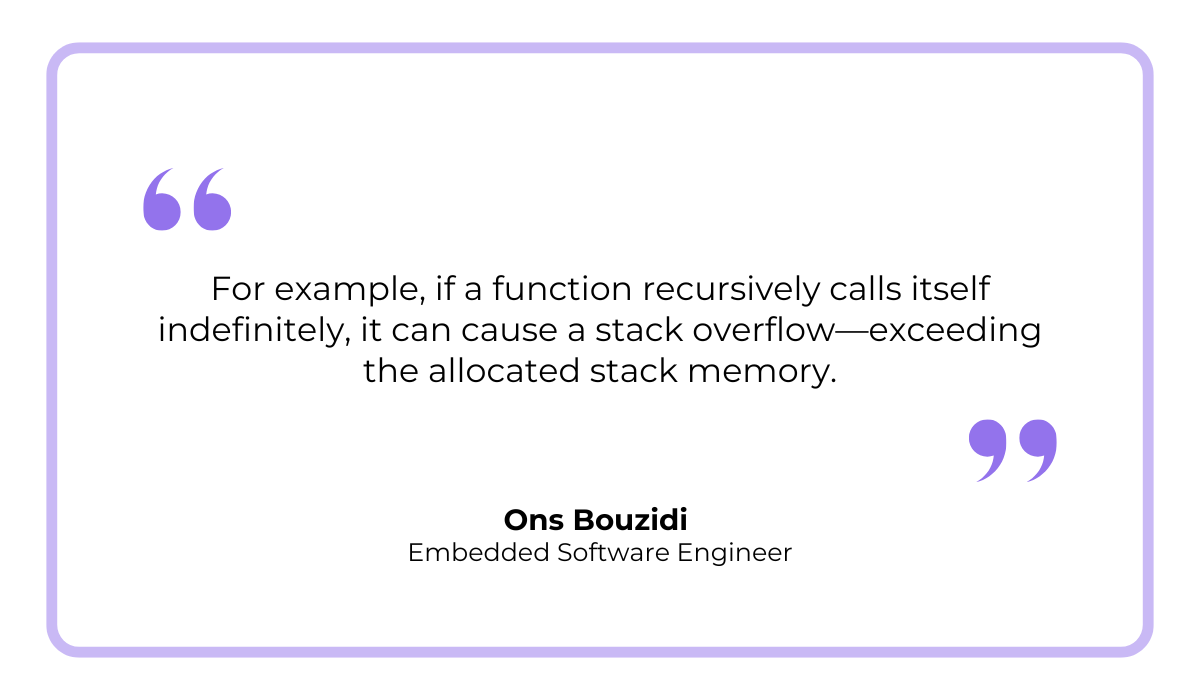
As Ons Bouzidi, an Embedded Software Engineer, puts it:
She adds that this can result in a segmentation fault or crash when the program tries to access memory beyond its allowed limits.
By attempting to recreate this or any other issue, you can confirm whether the root cause is truly understood.
This step also helps gather more details and ensures you’re not missing any critical factors contributing to the error’s occurrence.
For example, you might uncover additional dependencies or environmental conditions that only trigger the error under specific circumstances.
To replicate the error, you can start by using the same inputs or conditions that led to the failure.
If you’re unsure, try simplifying the steps or using debugging tools to log variables or track function calls, which can provide more insight into the issue.
Once you’ve identified the error’s source, debugging tools become crucial for further investigation.
Debuggers allow you to step through the code, running it in debug mode and pausing at specific points to inspect the state of the program.
This way, you can closely examine the flow of execution and observe how the values of variables change over time.

Capture, Annotate & Share in Seconds with our Free Chrome Extension!
By inspecting the program’s behavior at each step, you can gain insights into why and how the error occurred.
Using a debugger is far more efficient than adding print statements or recompiling repeatedly.
Debuggers offer real-time visibility into the program’s internal workings, speeding up the process of identifying the root cause, as one Reddit user highlights:
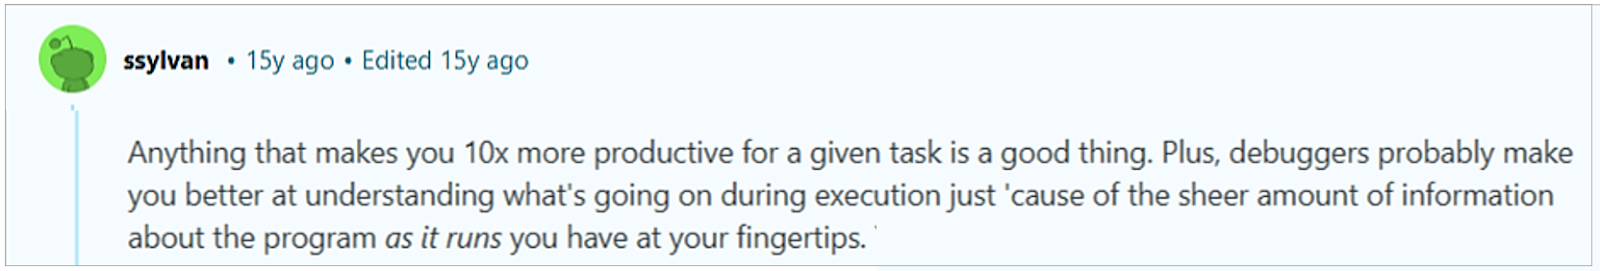
As cited, debuggers provide a lot of information while the program is running, making the process faster than traditional debugging methods.
Debugging tools can either be standalone programs (paid or open source) or built directly into your integrated development environment (IDE).
For example, the Chrome Debugger is a free tool built into the Chrome browser and can be accessed through Chrome DevTools.
In the screenshot below, you can see the software’s files in the left-side column, the code in the middle, and the call stack in the right-side column.
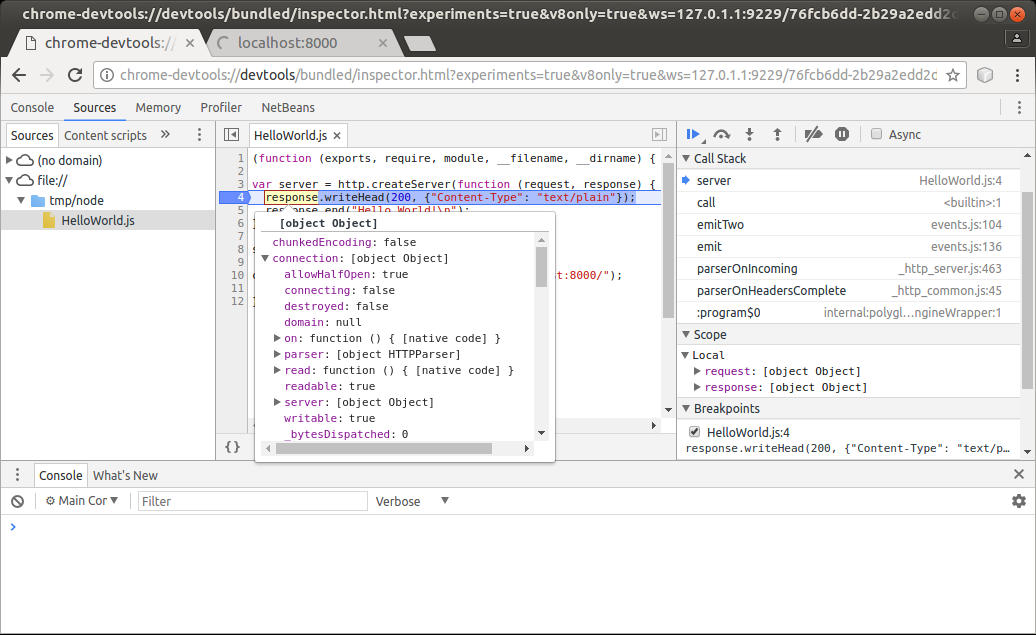
Whether part of your IDE or added separately, debuggers allow you to inspect variables, track data changes, and monitor the flow of program execution in real time.
This lets you directly observe how changes affect the program’s behavior.
Once the root cause has been addressed, retesting the application is essential to ensure the issue is fully resolved and that no new bugs have been introduced.
Debugging tools streamline this process, providing an efficient way to verify that the program is now functioning correctly.
While debuggers are great for facilitating the bug-fixing process, they don’t provide information on how a bug or crash occurred and why.
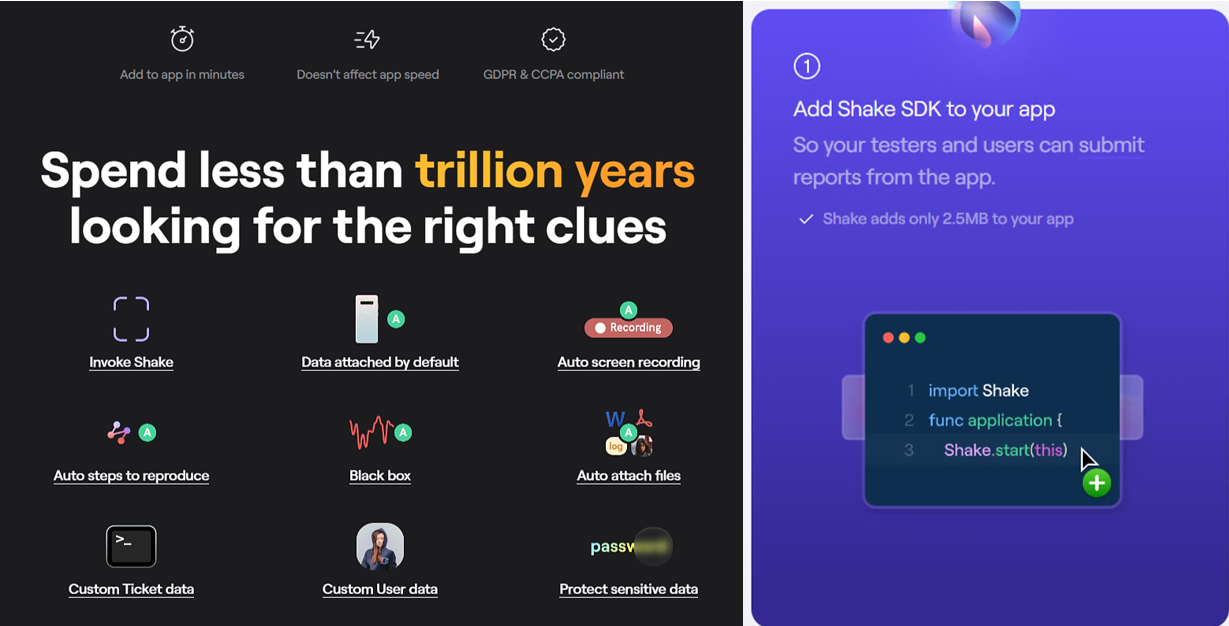
That’s why it’s worth pairing your debugger with a bug and crash reporting tool like our Shake.
Shake is lightweight and can be easily integrated into both mobile and web apps.
When QA testers or end users encounter issues, they can simply shake their devices or tap a floating button to report a bug or crash.
This action prompts Shake to capture key software and hardware specifics related to the issue and automatically generate a detailed report, requiring no additional input from the user.
Once the report is generated, testers or users can add comments and annotations for additional context if needed.
Regardless of whether they add comments, the bug or crash report is automatically forwarded to your development team.
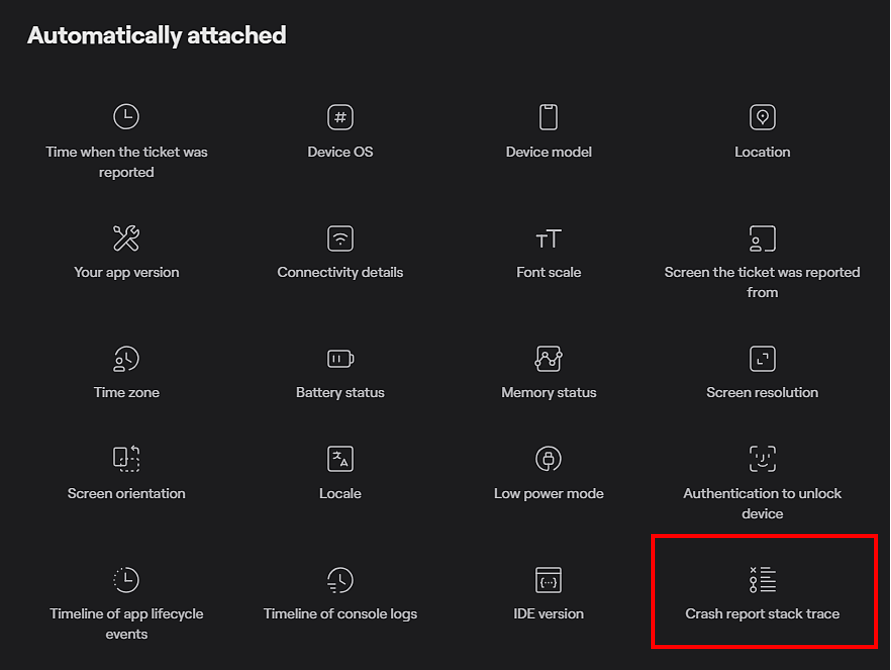
Each report includes everything your developers need to quickly address the issue:
One of the over 70 data points that Shake collects for each report is, naturally, the stack trace.
In addition to this wealth of structured information, Shake provides extra features like real-time chat, session replays, and integrations with project management tools.
These functionalities improve collaboration between developers and their QA teams, support, and end users.
Overall, bug reporting tools like Shake provide invaluable information, helping your developers quickly determine the root cause of an issue and efficiently resolve it.
We hope this guide has shed more light on stack traces, one of the most valuable tools developers have for debugging.
As you saw, stack traces provide a clear, step-by-step breakdown of how an error occurred, allowing you to quickly pinpoint and fix issues in your code.
By understanding the error type, analyzing the call stack, and using debugging and bug-reporting tools, you can make the troubleshooting process faster and more efficient.
Ultimately, the more comfortable you become with reading and interpreting stack traces, the easier debugging will be.
From internal bug reporting to production and customer support, our all-in-one SDK gets you all the right clues to fix issues in your mobile app and website.
We love to think it makes CTOs life easier, QA tester’s reports better and dev’s coding faster. If you agree that user feedback is key – Shake is your door lock.
Read more about us here.

Add to app in minutes

Doesn’t affect app speed

GDPR & CCPA compliant

Unexpected things pop up
Just like bugs in your app or web 🐛 Fix them now with just one reporting tool.