Recommended
App logging: what logs should you collect

Modern apps have become more functional and advanced than ever before.
But this complexity also means that developers encounter more errors. Nowadays, developers face dozens of error alerts and warning messages at any given time.
Fortunately, developers have an easy way to sort through this mess—app logging levels.
It’s a prioritization feature that allows you to sift through hundreds of log messages at a glance and determine exactly which ones to work on first.
Needless to say, it could make development teams much more efficient.
Therefore, this article discusses everything you need to know about app logging levels.
Table of Contents
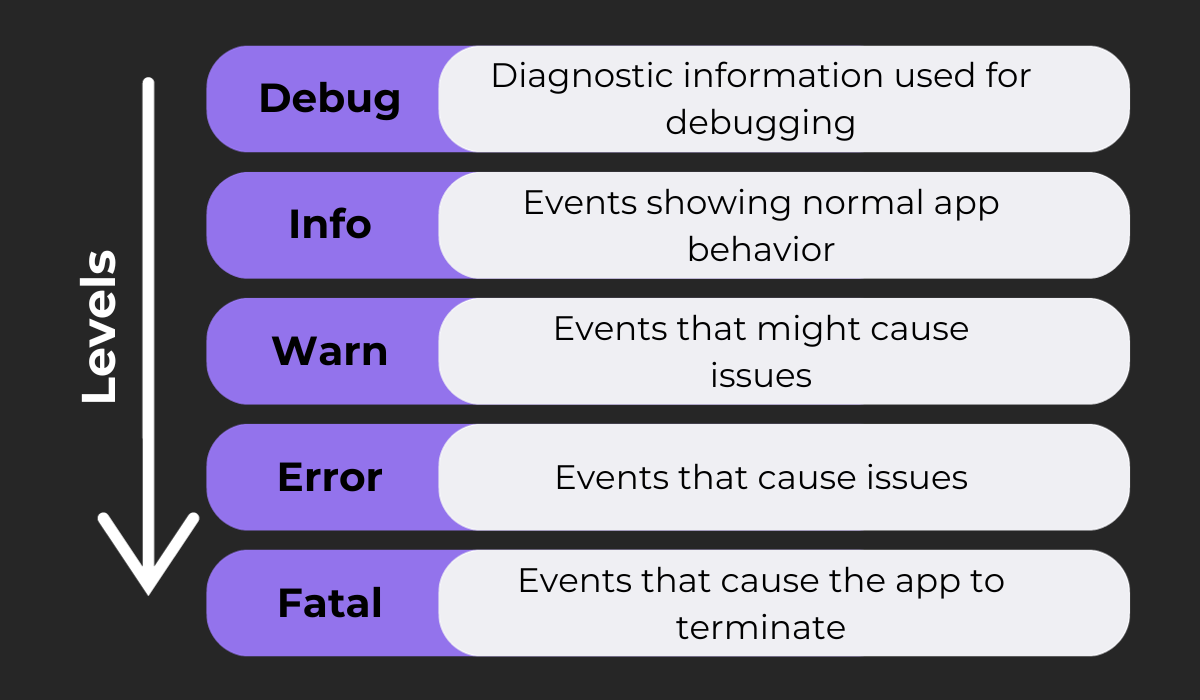
A log level measures the severity or importance of a log message. It’s an indicator that helps developers determine which logs to tackle first or, if necessary, focus only on the high-priority ones.
To give you an idea, here’s a quick overview of the standard app logging levels. Notice that there is a hierarchy that ranks logs according to severity, with mission-critical items at the top levels.
We’ll go through each in greater detail later in this article.
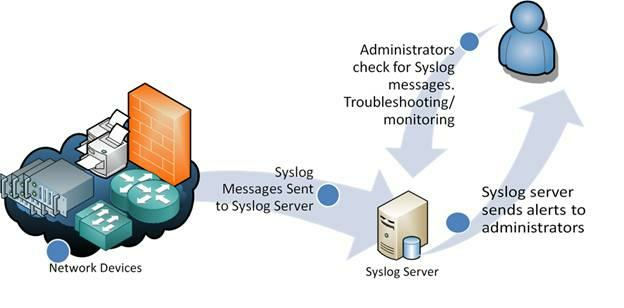
App logging levels follow the System Logging Protocol (Syslog). This standardizes the classification of application logs, ensuring they remain consistent across devices, programming languages, and operating systems.
Syslog is actually the origin of the app logging level hierarchy. It was created by Eric Allman while working on Sendmail. The project needed a logging system, which is where Allman conceptualized the logging levels.

Get unreal data to fix real issues in your app & web.
Nowadays, app logs are stored in a Syslog Server. It receives all logs from different locations, allowing developers to check them conveniently from a single location.
Here’s what it looks like:
Now that you know what app logging levels are, let’s explore why they’re critical to your development team.
Log levels are crucial for one simple reason—filtration.
Look at the message logs of a typical project, and you’ll see hundreds of entries. Finding what you’re looking for can be challenging and time-consuming.
The fact is that not all messages are relevant to any single person.
For example, trace messages that contain variable states are only useful for developers. Show that to a system administrator, and they will be overwhelmed with data that is irrelevant to them.
Furthermore, not all messages are also critical to a developer’s task at hand.
For instance, say they’re trying to fix an issue causing the app to crash consistently. In this case, they should focus on fatal-level messages (where critical errors are) when investigating.
Using log levels is a simple way for developers to instantly filter through the important messages and ignore the rest.
You can also use levels to regulate the amount of log data your mobile app produces. This eliminates unnecessary noise that could be overwhelming you.
For example, you can filter it to show only debug and error messages while you’re busy debugging code.
Ultimately, code logging levels exist to make life easier for the entire development team. They highlight the messages that matter, allowing developers and administrators to take action without wasting time figuring out what that action is.
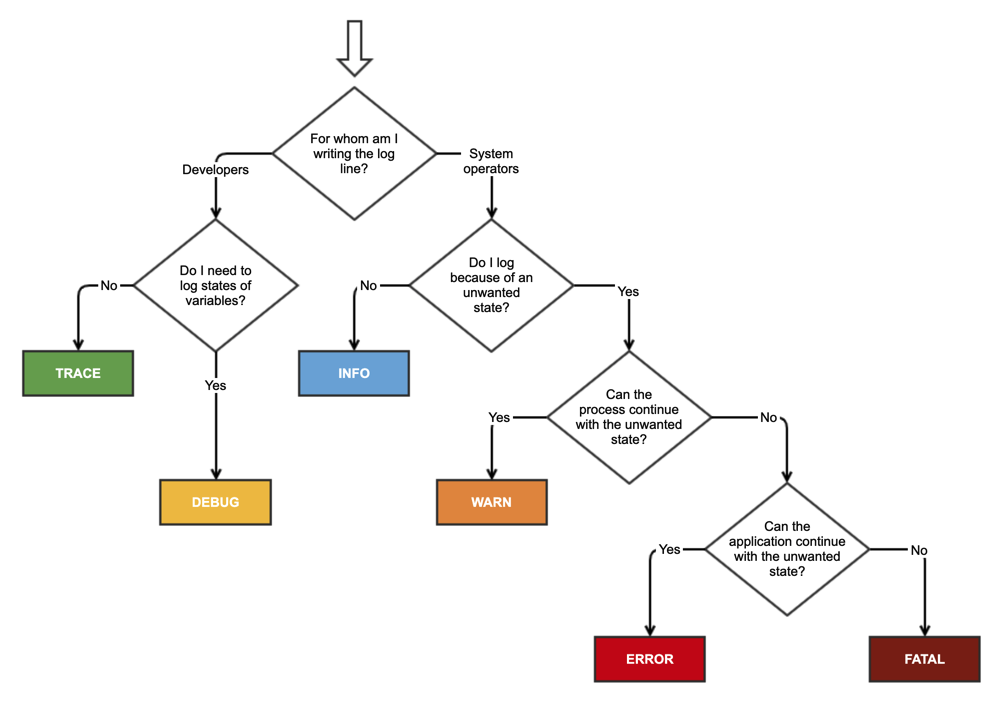
Let’s now look into the common log levels that you’ll encounter. We’ll start with the most severe level that has the highest priority.
This log level includes severe errors that could put the application at risk.
Basically, any error that either shuts down the app completely or corrupts its data warrants a fatal tag. It’s often generated before an application shuts down completely.
One example of a fatal log message is a server running out of memory or disk space. Such an event would cause the app to become unresponsive or even crash the entire server.
Another common fatal log is when a data breach is detected. To help protect sensitive information, the app would close and issue a fatal error.
Regardless of the reason, fatal logs have the highest tier because they deserve immediate attention from developers and administrators.
Not doing so would put the entire system at risk. So, ideally, fatal errors should be few and far between.
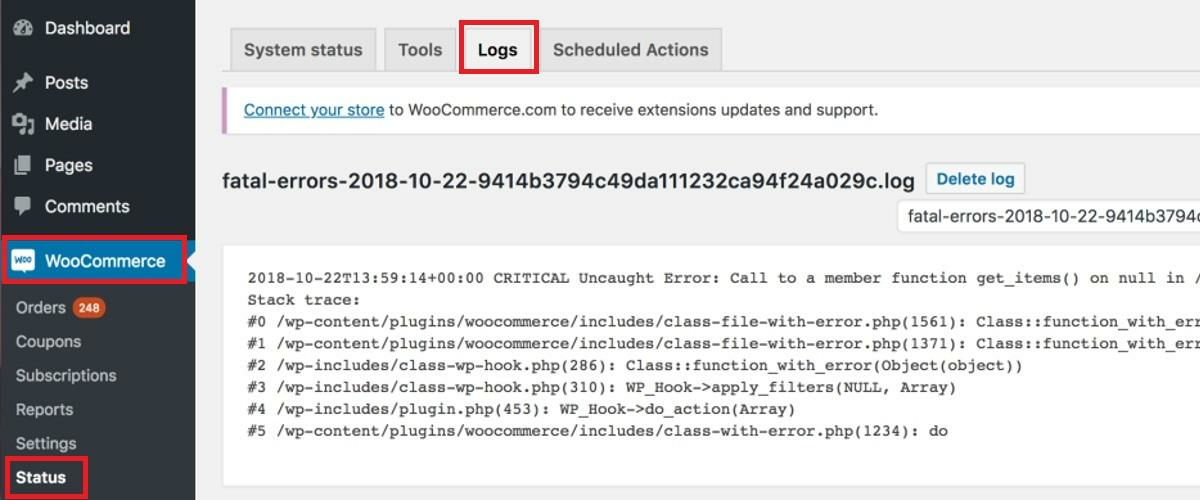
It’s important to include as much supporting information on fatal log messages as possible.
Because the software had already shut down, collecting further data required to recreate and fix the problem will be difficult. At the minimum, you should include a stack trace.
The error tag is reserved for errors that shut down only a non-critical function or component without affecting the entire application. Hence, the app can still run without endangering itself or its data.
Missing or unavailable service is quite a common error log.
For example, say you have a mobile banking app that can’t connect to a specific bank due to an API error. It’s a major problem that affects functionality but is not severe enough to cripple the app completely. Thus, you can tag it at the error level.
Another example is when your app can’t create an external file due to a read or write issue. As long as it’s not a crucial file to your software, it can be tagged on the error level.
But even if they’re not mission-critical entries, error logs should still be addressed ASAP. They negatively affect the user experience and thus have the potential to get people to uninstall your app.
However, not all errors should be tagged at the error level. Some, like the expected exceptions, should be tagged with the debug level instead (more on this later).
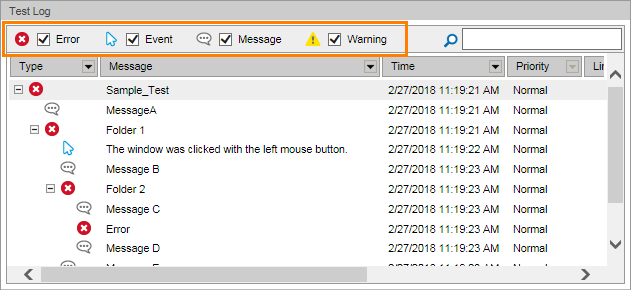
A warn-level message refers to non-critical errors on non-critical functions. It means it doesn’t severely impact the app in any way, though they still need to be addressed.
For example, a warning log can be issued if your code sends the wrong value or variable to a class function, as shown below. It’s not critical, but it could be a risk for the software in some way.
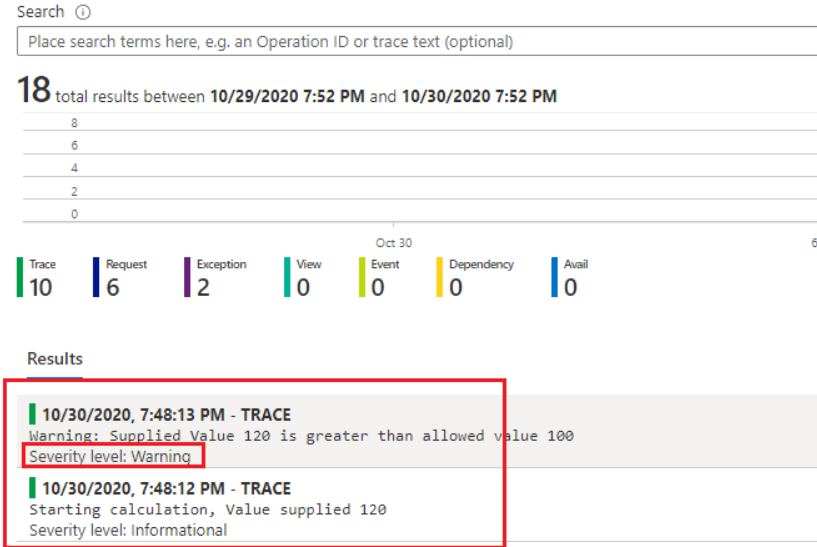
Warning-level messages could also indicate the potential for problems to occur. Often, they are minor issues that the app can recover from without any impact. However, it might not be able to in the future if administrators don’t intervene.
One example is if the app consumes more memory or processing power than normal. While it’s not enough to bring down the app, it could signal developers to investigate for any deeper problems.
One challenge most teams have is whether to categorize a log as an error or warning.
A rule of thumb is that any issue the system can recover from is placed on the warning level. Otherwise, elevate it to the error or fatal tier.
For example, an app that successfully connects to the server after a few tries constitutes a warning. That’s because the software functions as normal, though there might be connectivity issues you’ll need to investigate. But if it fails to do so entirely, consider it an error-level log.
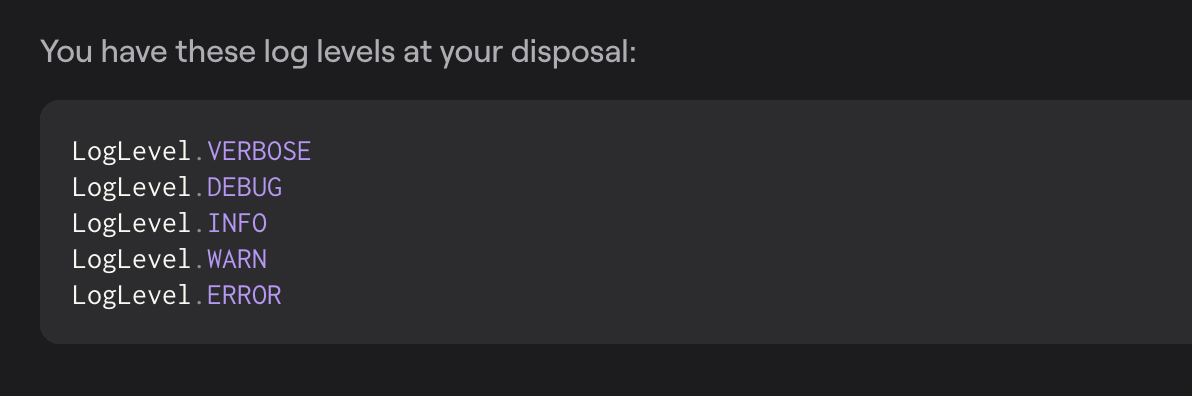
Debug-level logs encompass any messages that help troubleshoot an app. This can include variable values, app states, custom messages, and other valuable data during coding and testing.
Debug is also one of the log levels our users have at their disposal:
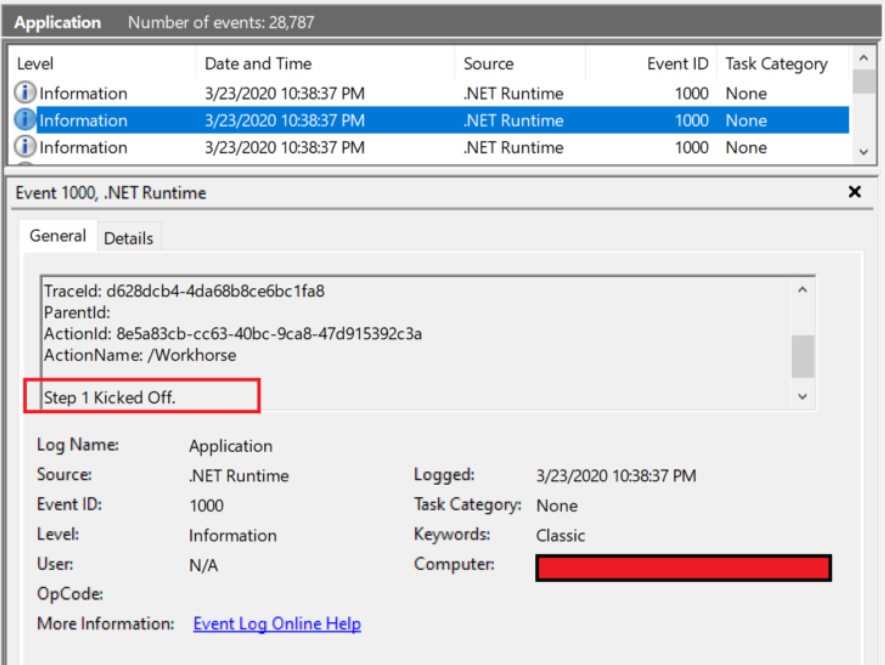
A classic use of debug logs is to generate messages indicating whether a background operation was successful. This is helpful to assess if the code is working properly or to isolate the specific line that’s generating an error.
For instance, you can issue a debug-level message after the app adds a new row in a database. You can include supplementary notes like how many rows were added or how long the operation took.

Capture, Annotate & Share in Seconds with our Free Chrome Extension!
Because of their diagnostic nature, debug logs are mostly reserved for developers. They should also only be visible during development and not on live apps.
Another reason for this is that debug logs could potentially contain sensitive information such as app configurations, login credentials, and application states. Hackers can use them to steal data or hack your app.
The trace level is similar to the debug level in that it’s used mostly during coding and development.
The difference is that trace logs also contain extremely detailed information on the code executed. It gives developers a clearer picture of the events that caused an error or crash.
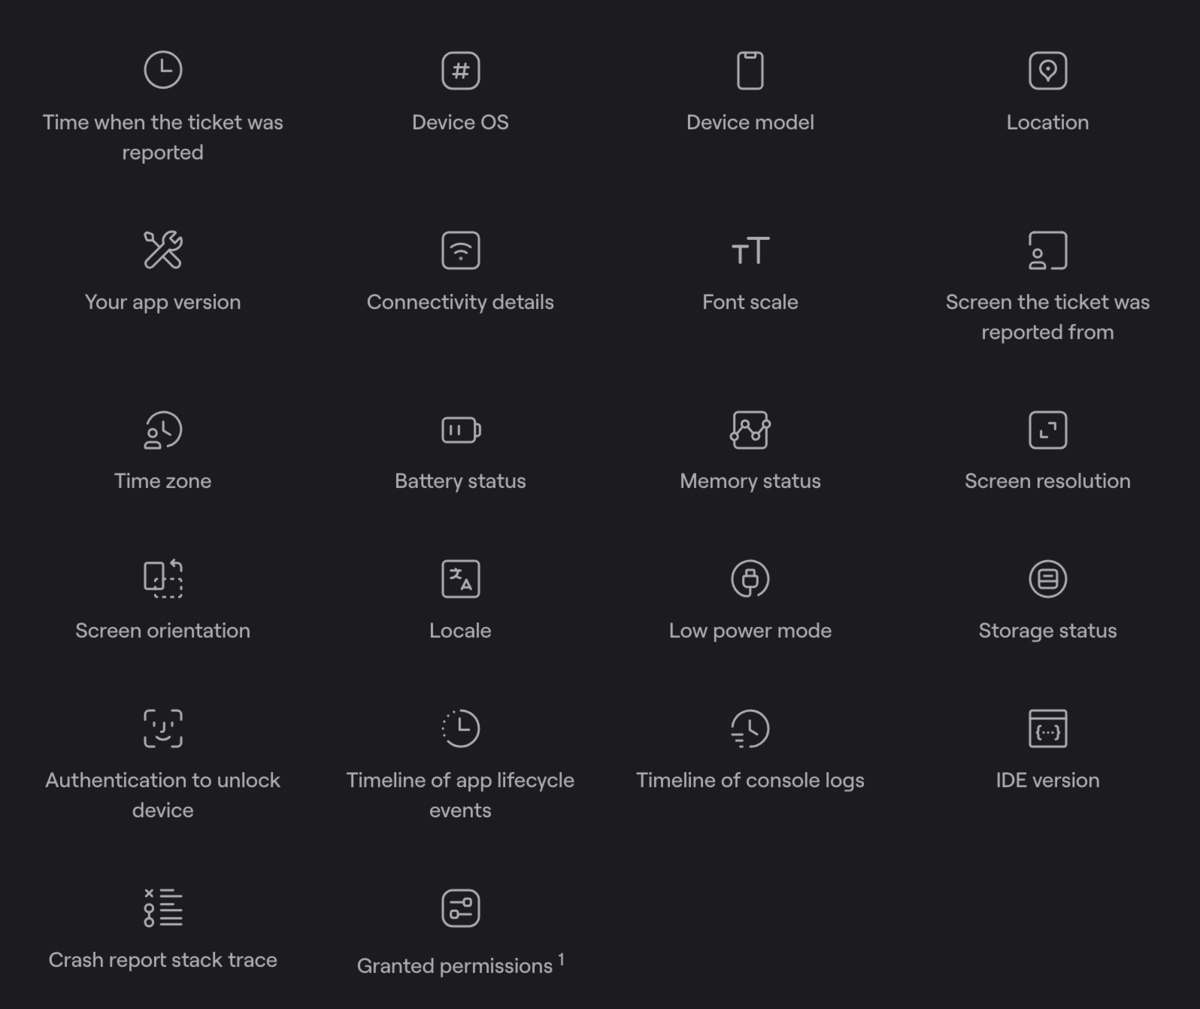
With Shake, this is some of the data that is automatically attached to the user feedback or crash report.
Because of the depth of information, trace logs are especially useful for debugging complex code. But that could also cause data to overwhelm, not to mention that it also increases the size of your log files.
As such, trace logs shouldn’t be enabled for every line of code or module.
Alternatively, you can use a bug and crash reporting tool like Shake. It sends useful information regarding an error without occupying your log files.
Info-level messages generate information about the app’s operation, including its various states and processes. It allows management and IT teams to track important events, such as when the application starts or performs a critical operation.
Access logs are one common type of info-level messages.
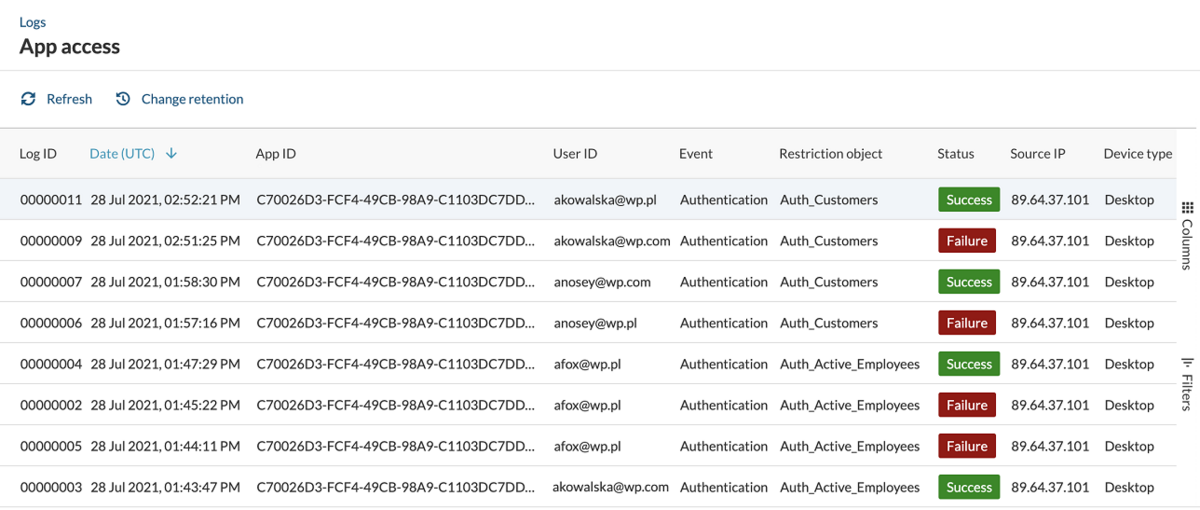
Despite being at the lowest level, info logs are extremely important. They allow you to spot anomalies or patterns in your app that could indicate a data breach or security risk. It could also alert you to performance dips before they become severe.
The short answer is yes.
App logging levels are merely a standard that can help maintain consistency. But if your app requires a specific category not covered by any tiers, then you can always create your own.
Here’s an example of how you can do that when using our own SDK for bug and crash reporting.
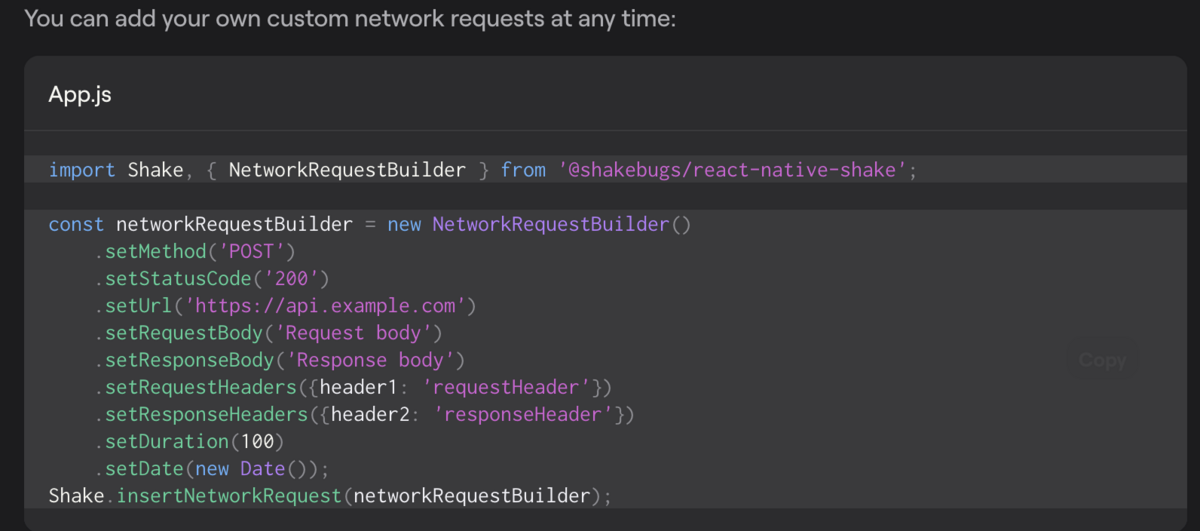
For instance, you can create a security tier so that all security and data privacy messages are separated. This is useful if you have a cybersecurity team in place.
However, you must create custom levels only when absolutely necessary. Too many levels can be confusing, which beats the purpose of using them to organize your logs.
App logging first requires a logging framework.
This module simply accepts log messages from various applications and devices. It then categorizes these based on the logging levels set by administrators or the development team.
Here’s an example of how the Log4J framework is set up:
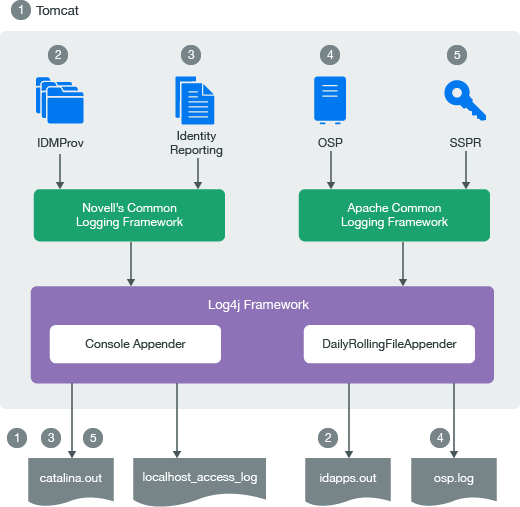
The logging framework can also deny any log requests from applications that don’t meet its threshold or requirements. This is a way to keep log volumes at a minimum.
As mentioned above, logging levels are a great way to organize your message logs so your team can quickly find the relevant ones.
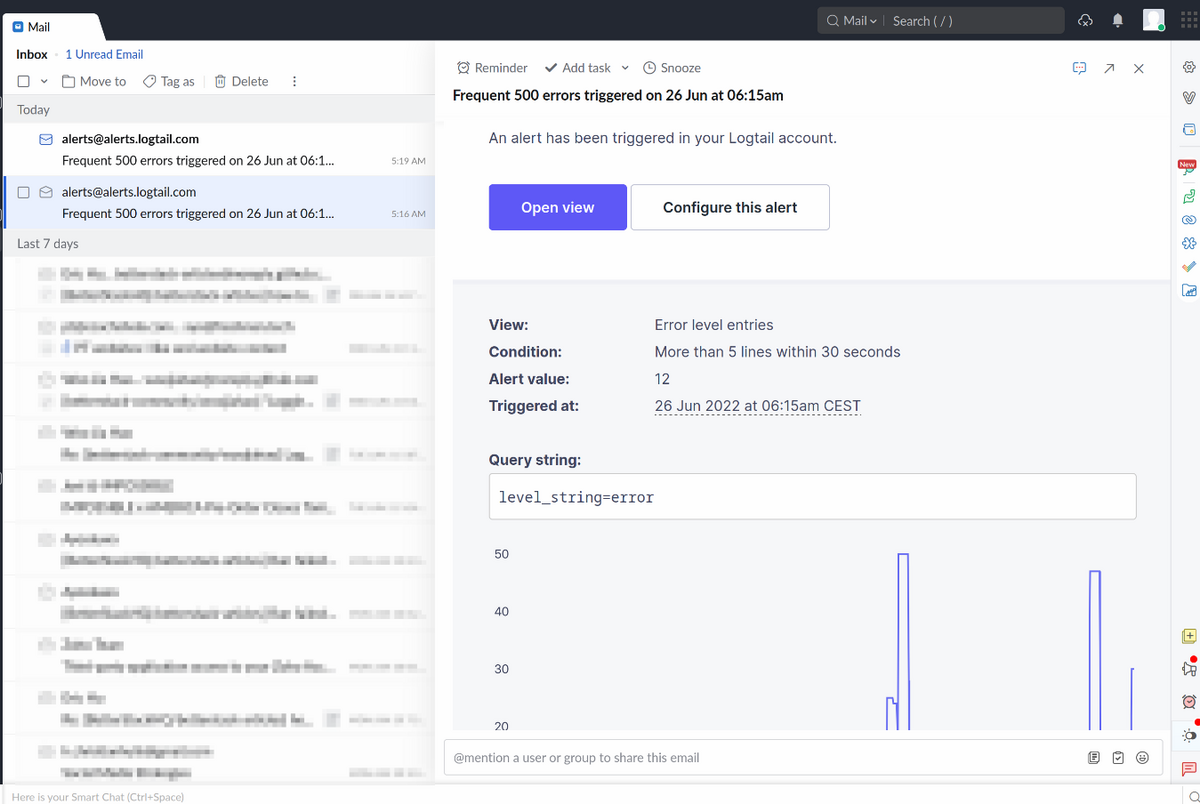
But you can also use logging levels to achieve some automation with your alerting system.
For example, you can configure your logging framework to automatically send you an email when it receives a fatal log. This can make your team aware of critical errors much more quickly.
Finally, logging levels can let you see how well your team is doing at a glance. For instance, you can quickly check how many fatal errors you’re getting currently compared to the previous month. Any reduction is a sign that your app stability is improving.
We hope you’ve learned about app logging levels and why they’re critical for app development.
They provide organization and categorization to your logs, so you spend less time looking and more time taking action. And that makes your team much more effective.
However, logging levels are only useful if they contain useful information. To ensure this, you must use proper error reporting tools like Shake.
Shake takes the guesswork out of bug and crash reporting by automatically appending relevant information to each log you receive. And you can implement all of that with just a few lines of code.
Try Shake for free today and see how beneficial it is for app testing and debugging.
From internal bug reporting to production and customer support, our all-in-one SDK gets you all the right clues to fix issues in your mobile app and website.
We love to think it makes CTOs life easier, QA tester’s reports better and dev’s coding faster. If you agree that user feedback is key – Shake is your door lock.
Read more about us here.

Add to app in minutes

Doesn’t affect app speed

GDPR & CCPA compliant

Unexpected things pop up
Just like bugs in your app or web 🐛 Fix them now with just one reporting tool.